Fundamentals
trump
Technical Analysis
Precious Metals Review & Outlook
04/10/2017 thru 04/21/2017
Originally Posted on 04/17/2017 @12:14am
Subscribe to this Weekly Blog post

Hello,
Thank you for visiting the Free-Bullion-Investment-Guide's latest blog post, I hope that you and your family had a Happy Easter.
Before we get to this week's post; here are a few of Last Week's Best News Articles that were taken from this guide's homepage.

Mining Journal - Gold to Fly on Inflation
Advancing Time - Show Me The Money! I Want Proof Not More Promises
St. Louis Post Dispatch - An economy badly out of balance: Consumer debt growth can't outpace wages forever
FAKE BULLION ALERT : Bend Bulletin (Oregon) - Bend Teen Masterminded Alleged Fake Gold Scam
The Deviant Investor - Titanic Parallel to the Federal Reserve
VIDEO : Mises Institute Media - Interview with Danielle DiMartino Booth: Inside the Fed
CoinWorld - Grading services certifying American Eagle silver bullion coins from multiple Mints
Best of the Week for Gold NanoParticle Cancer Research
GOLD NANOTECHNOLOGY : CANCER RESEARCH : Medical News Today - Nanoparticle Nasal Spray May Offer Rapid and Safe Delivery of Drugs to the Brain - gold nanoparticles have emerged as the material of choice for drug delivery. They are relatively easy to synthesize and customize, and they have good biocompatibility.
GOLD NANOTECHNOLOGY : CANCER RESEARCH : Science Daily - Nanoparticle Research Tested in Locusts Focuses on New Drug-Delivery Method

In last week’s post (seen here), I briefly wrote about the fact that ‘Fundamentals trump Technical Analysis,’ but when I wrote it the last thing I thought was that it would be the title of this week’s post.
When I wrote the phrase, I was writing about Janet Yellen’s speech and how it could affect the precious metals markets, but the speech didn’t move them at all, instead, it was the drums of war that caused the precious metals markets to move higher.
Fox Business - Gold Touches Five-Month High on Syria Strikes, Before Settling OutGold Made Simple - Tensions over North Korea push gold price up
In addition to the military moves last week, President Trump also helped precious metals climb after he made the comments about the US dollar being ‘too strong’ and that he prefers low-interest rates.
The Daily Mail - Trump sends dollar plunging as he says he wants interest rates kept low - and won't be calling China 'currency manipulator'The Globe and Mail - Traders welcome U.S. dollar slump under Trump comments

In my chart analysis last week, I showed that both gold and silver are now trading inside a bearish pattern called a 'Rising Expanding Wedge'.
Note: Click the chart (to the right) of a 'Rising Expanding Wedge' for Forex-Central's definition of the technical pattern.
However, last week the precious metals didn't move in the way that these patterns indicate.
Instead, the precious metals rose in price by investors who were motivated by a few of the fundamental truths behind investing in precious metals:
- Safe Haven Investment during troubled times or times of heightened military activity
- A good investment against a weak dollar
These fundamental truths will continue to move more investors into the precious metals as long as they persist, but once the tension breaks, the bear patterns in the charts will take a more prominent role in price movement.
This weekend, I have studied the gold and silver charts thoroughly and can only find one negative (bear) pattern after another.
See the silver and gold cluster charts below.


After I created the two cluster charts above of the repeated 'Rising Expanding Wedges' in both silver and gold, I found another negative pattern in their charts, which are shown in the charts below.
Bull Market
Before we move on to the individual precious metals
charts, I do want to say that the precious metals confirmed last year that they
are in a new bull market; this was shown in the 'Gold and Silver 2016 – Bull Market Wins' blog post.
Therefore, even though a pullback in price is expected sometime in the near future after they do so, gold and silver should continue to move higher.
SILVER
In last week’s silver chart, (below) it showed that a pullback was expected not only because of the ‘Rising Expanding Wedge’ but also because it looked like the MACD and RSI (lower indicators) were going to continue to fall.
That didn’t happen, instead, Fundamentals trumped Technical Analysis and the price of silver climbed in response to last week's current events.
(continued....)


Above, I wrote that when I was studying the charts, I found another bear pattern in silver and gold's chart, it is a 'Rising Wedge.'
I tried not to make the chart below look too confusing, but the ‘Rising Expanding Wedge’ is indicated by the solid lines and the ‘Rising Wedge’ is indicated by dotted lines.
Both patterns are negative (bear) indicators that will continue to loom over the price of silver until either the fundamentals push the price higher, destroying the negative technical patterns or the price pulls back confirming them.
Note: Click the chart (to the right) of a 'Rising Wedge' for Forex-Central's definition of the technical pattern.

charts provided courtesy of TradingView.com
Silver's Price Resistance &
Support Levels
Silver's Resistance Levels
$19.05
$18.75
Silver's Support Levels
$18.30
$18.00
GOLD
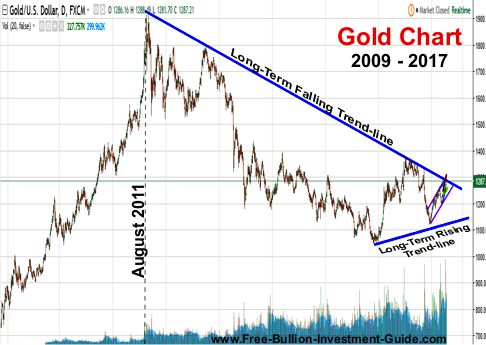
This week's gold chart (below) is filled with trend-lines.
Last week, gold’s price rose with the news of war and the President saying he preferred a weak dollar.
As the price of gold rose, it hit its Long Term Falling Trend-line, to see how "long-term" this trend-line is, take a look at the chart below this week’s chart.
When (not if) that trend-line is broken, you will hear about it in several financial news outlets because it will be a major bull signal to traders.
This week, if militarily tensions continue to rise, we may see gold break above this level, but if we don’t then the technical patterns in gold’s chart may take over and we may see the price of gold pullback this week. Time will tell.

Charts provided courtesy of TradingView.com
Gold's Long-Term Falling Trend-line Chart
Gold's Price Resistance and
Support Levels
Gold's Resistance Levels
$1305.00
$1300.00
$1290.00
Gold's Support Levels
$1270.00
$1250.00
$1225.00
US DOLLAR
Last week, the US Dollar didn’t break its previous high and it isn't giving much of any indication on its future direction.
Therefore, for the foreseeable future, it looks like it will continue to trade inside its negative (bear) patterns of the 'Rising Expanding Wedge' and 'Descending Channel.'

U.S. Dollar's Price Resistance and Support Levels
U.S. Dollar's Resistance Levels
$101.75
$101.40
$101.00
U.S. Dollar's Support Levels
$100.00
$99.85
$99.60
Platinum
Last week, the price of platinum tested and slightly broke the bottom of the Ascending Channel.
But, I decided to adjust the bottom of the channel; I did this because the adjustment did not compromise the integrity of the ascending channel, if it had I would have removed it.
This week, platinum’s chart isn’t offering much of an
indication as to which direction it will move, but it continues to look like it will trade inside the ascending channel.

Platinum's Price Resistance and Support Levels
Platinum's Resistance Levels
$1000.00
$980.00
Platinum's Support Levels
$960.00
$935.00
Palladium
In last week’s post, I posted the chart below that indicated a 'Rising Wedge' (bear pattern) had formed in palladium’s price chart.
(continued...)

price charts provided courtesy of TradingView.com
This week, the chart below shows that the price fell below the rising wedge; in addition, Palladium’s MACD and RSI (lower indicators) are showing that the price may have a little more room to fall before it finds support.

Note:
Click the chart above for Forex-Central's definition of the Rising Expanding Wedge or 'Ascending Broadening Wedge.'

Palladium's Price Resistance and Support Levels
Palladium's Resistance Levels
$835.00
$820.00
Palladium's Support Levels
$785.00
$770.00
Music
If you have been a long time visitor of this blog, you know that sometimes I post music because (when I can) I like to listen to music when I work.
Lately, I’ve been listening to a lot of Bob Moses, here's one of my favorites.
Bob Moses - Keeping Me Alive
Have a Great Week.
Thank you for your time & God Bless,
Steve
'Click Here' see all of the prior Blog posts,
Thank You for Your Time!
|
 | |||||
Free Bullion Investment Guide

Recent Articles
-
Free Bullion Investment Guide - April 2024 Newsletter - Volume 45
Apr 12, 24 11:12 AM
The Free Bullion Investment Guide's April 2024 newsletter (Volume 45) provides the latest updates, market analysis, the best articles from last month, and a list of merchants offering bullion discount… -
Silver is Going Higher
Mar 21, 24 09:59 AM
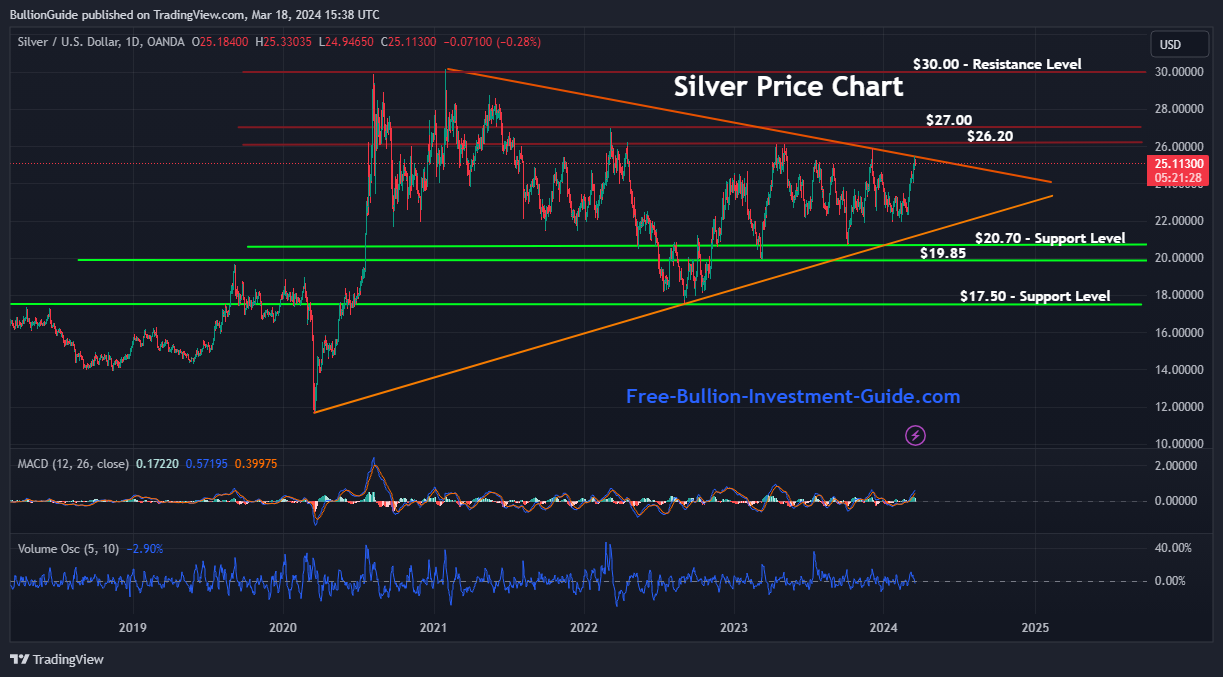 Silver is going higher. Silver has broken a multiyear Pennant pattern to the upside, which is a positive indication that the price of silver will hold its recent gains and move higher.
 -
March 2024 Newsletter - Volume 44
Mar 12, 24 11:06 AM
 The March 2024 newsletter of the Free Bullion Investment Guide (44th Issue) provides the latest updates, market analysis, the best articles from last month, and a list of merchants offering bullion di…
 -
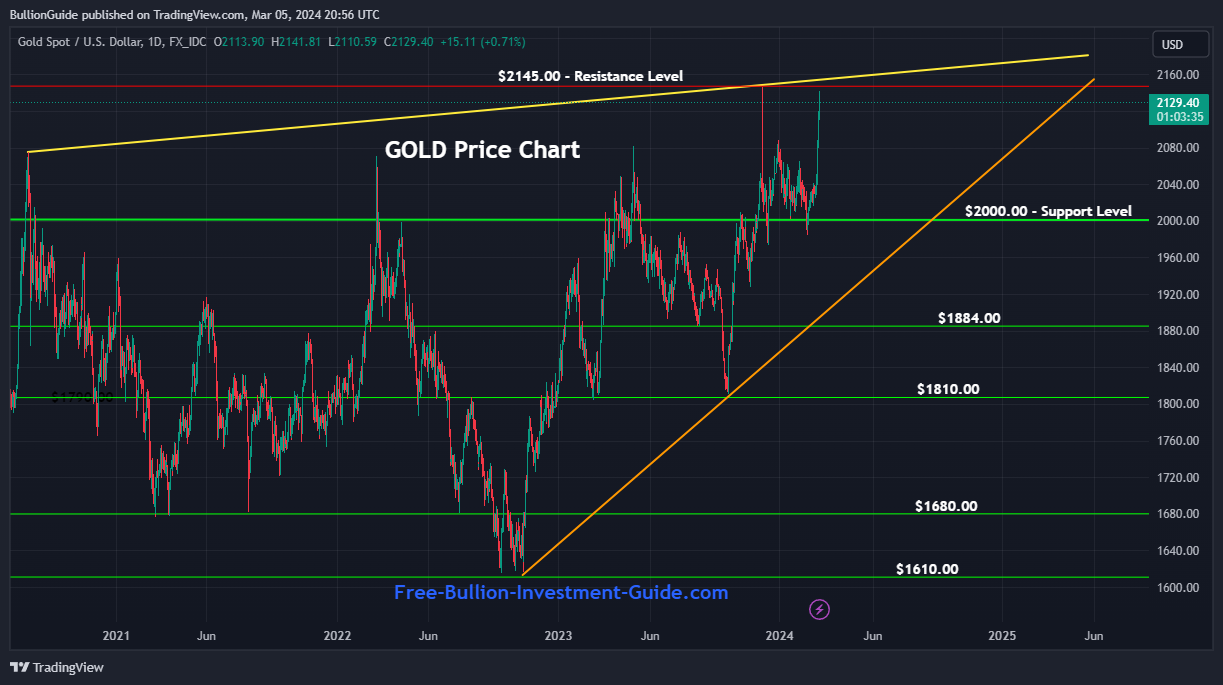
Gold is Going Higher
Mar 07, 24 11:43 AM
Gold is going higher. Gold has broken a negative rising wedge pattern to the upside, which is a positive indication that the price of gold will hold its recent gains and move higher. -
February 2024 Newsletter - Volume 43
Feb 12, 24 06:40 PM
 The February 2024 newsletter of the Free Bullion Investment Guide (43rd Issue) provides the latest updates, market analysis, the best articles from last month, and a list of merchants offering bullion…

Search the Guide
| search engine by freefind | advanced |

Daily
Updated

Updated
Numismatic & Bullion Auctions page

3/21/2024

Updated

03/07/2024
Blog Post
Updated


Update

Update

New Page

Mintage Figures

2023
Mintage Figures


Archangel Raphael
~
The Angel of Healing


Help Us Expand our Audience by forwarding our link
www.free-bullion-investment-guide.com.
Thank You!
