
Gold...
Same Pattern,
Different Week
Review and Outlook for the U.S. Dollar, Silver, and Gold
Originally Posted on 6/10/2018 @ 4:37 pm EDT
by Steven Warrenfeltz
Subscribe to this Blog

Hello,
Thank you for visiting the Free-Bullion-Investment-Guide, every visit you make is greatly appreciated.
Before we get to this Review & Outlook, below are some of the Best Bullion Market-Related News articles that were taken from this guide's home page, over the last few weeks.

CHART: Gold in € has moved to a 2-yr high.... - Tom McClellan (twitter)
Gold Investing Goes AWOL As Google Searches To 'Buy Gold' Hit 11-Year Low - Forbes
Once Again, Gold Is Not Commodity - Sunshine Profits
Coin Finds: Supermarket visits deliver Wheat pennies, Mercury dimes - Numismatic News
SOLD OUT Latest bullion coin sell outs at The Perth Mint - Perth Mint Blog
Economic Reality Will Soon Be Knocking On The Gate - Advancing Time
AUDIO: Danielle DiMartino Booth on the Fed's Mission Impossible - Mises Institute
CHART: Investor Cash Allocations - TopDown Charts
Why Gold Is The King Monetary Asset, Not Bitcoin - SRSrocco Report
Visa Goes Down in the UK, Chaos Ensues, Cash is Suddenly King - Wolf Street
Best of the Week for
Gold NanoParticle Cancer Research
Gold Nanoparticle Cancer Research Report - #8 - Free Bullion Investment Guide
NANOTECHNOLOGY: The BS and the Science of Nanotechnology - The Conversation

Review & Outlook
|
All the charts on this blog are Daily Charts unless noted otherwise.
US DOLLAR
In Review
Three weeks ago, the following outlook was posted for the U.S. Dollar.
For the U.S. Dollar's outlook, one of the biggest fundamental truths that I can state after looking at the U.S. Dollar's chart below is that: "Nothing Goes Up Forever."
Can it go higher? "Yeah," right now, fundamentals in the bond markets are fulling the dollar's rise.
Technical patterns will always take a backseat to Market Fundamentals and as long as bond yields continue to move up, so will the dollar.
So, the outlook for the is simply to expect more of the same until market fundamentals start to set-aside for the dollar.

U.S. Dollar - In Review - continued
When the dollar was rising in the Outlook chart above, the Ten-Year Treasury Note's yield had moved up to 3.11%, this was a big factor that helped to fuel the dollar's rise in price.
However, over the last three weeks, the Ten-Year Note has been falling, it had fallen to a monthly low of 2.76%, but it has since had a bit of a bounce and is now sitting around the 2.96% level.
When the Ten-Year Note fell it helped the dollar fall in price and so did the jobs report that was released on 6/1/2018.
The jobs report was great in substance, it just gave a signal to the market that told it to expect an interest rate hike soon, which should come in the middle of this week, at the FOMC on 6/13/2018.

U.S. Dollar - Outlook
In the U.S. Dollar's outlook chart below, you can see that there are now two wedges identified.
First, the large negative 'Rising Expanding Wedge' has been in its trading chart for more than a month, and now there's a smaller positive 'Falling Expanding Wedge' that has been identified.
For the U.S. Dollar's Outlook, both wedges are very close to being confirmed, as to which one will be confirmed first, is a 'toss-up.'
Why?
Well, first off, if the summit between President Trump and North Korea's leader Kim Jong Un goes well on June 12th, then this should help push up the dollar, breaking the positive 'Falling Expanding Wedge' first.
However, if it doesn't go well, then we'll most likely see the dollar fall, breaking the negative 'Rising Expanding Wedge' first.
A lot is riding on this summit, but beyond that, the Federal Reserve meets on June 12-13th, and because of the jobs report, the FOMC is expected to raise rates another .25% this week, which will also be a negative on the dollar.
So, the outcomes of these factors will mostly dictate how the U.S. Dollar moves; meaning, the technical patterns exist, but, fundamentals are having more influence over the dollar's price moves.

Charts provided courtesy of TradingView.com
U.S. Dollar's Price Resistance and Support Levels
U.S. Dollar's Resistance Levels
$95.00
$94.00
U.S. Dollar's Support Levels
$93.00
$92.00
$91.00
SILVER
In Review
Two weeks ago, I wrote a blog post for Silver titled: Where's Silver Going? The outlook for silver had three parts, below are the charts and commentaries from that outlook.
As mentioned in the introduction, silver now has two technical
patterns in its short-term trading chart, and as the 'title graphic'
implies one is negative, the other is positive.
Silver Outlook Chart #1
The first outlook chart looks a lot like last week's outlook chart.
Even though the 'Falling Wedge' was broken, last week, it can still be drawn, which means that it is still relevant.

Silver Outlook Chart #2
The other pattern that has formed in silver's short-term trading chart is a negative 'Rising Expanding Wedge' pattern.
Continue to the next chart, below, to see the full outlook.

Silver Outlook Chart #3
In Silver's final outlook chart below, both of the technical patterns are shown in the chart.
For the week to come, we are simply at the whim of the Fundamentals in the news.
Yesterday (5/26), we heard that North Korea, South Korea, and U.S. official met to talk about the future of talks and it sounds like that the summit between Kim Jong Un and President Trump may be back on schedule.
05/26/2018: U.S., North Korean officials meet for talks on summit - Reuters
This is good news for the U.S. Dollar, which may be bad for silver.
But,
silver isn't only a safe haven, it is also an industrial metal, so it
could be a positive or a negative for the precious metal.
There are other variables at play this week to pay attention to for silver's future market.
First, on Thursday (5/31) the U.S. 'Core Inflation'
report will be released, and I don't know if you've bought gas or
groceries lately but, in case if you haven't, prices are on the rise.
Secondly, the U.S. Jobs Report is expected to be released on Friday (6/01), which depending on whether it is bad or good will give market players an idea as to how the Fed will move at its June Meeting (06/12-13/2018).
So, with all these fundamental variables in play this week, it's very hard to say how silver will move in the week to come.
However,
if I were just looking at the chart and had no knowledge of what's
going on in the World, it looks like silver will break and confirm the
negative 'Rising Expanding Wedge' pattern before it breaks and confirms
the positive Falling Wedge pattern again, but time will be the ultimate
judge of what happens.
I hope you have a Safe and Happy Memorial Day! SW

Silver - In Review - continued
In the next two review charts below, you can see that was stated in the last sentence of the silver outlook from two weeks ago, happened.
"However, if I were just looking at the chart and had no knowledge of what's going on in the World, it looks like silver will break and confirm the negative 'Rising Expanding Wedge' pattern before it breaks and confirms the positive Falling Wedge pattern again, but time will be the ultimate judge of what happens."


Silver - Outlook
In silver's outlook chart below, you can see that two patterns have been identified in silver's charts.
First off, even though the 'Falling Wedge' was confirmed last week, it is still relevant because it can still be drawn in the silver chart.
However, it looks like the price of silver is peaking, for now, so we may see silver fall in the early part of this week, at least until the FOMC meeting, and in doing so it may break and confirm the new negative 'Rising Wedge' that was is now in its chart.
But, as always, time will tell what happens.

Charts provided courtesy of TradingView.com
Silver's Price Resistance &
Support Levels
Silver's Resistance Levels
$17.50
$17.00
Silver's Support Levels
$16.40
$16.00
GOLD
In Review
Three weeks ago, the following charts and commentary were posted in gold's outlook.
As mentioned in the review above, the positive patterns in gold's chart can still be drawn, and as long as the technical patterns can be drawn, they are still relevant.
For gold's outlook this week, like silver, gold's future mostly depends on how the U.S. dollar moves, if market fundamentals for the dollar turn negative, then we may see gold move up and confirm the 'Falling Wedge' pattern.
Time will ultimately be the judge as to how the precious metals move.
In addition, for gold to break and confirm the 'Bull Flag,' I still agree with my previous statement from three weeks ago:
"it will need to be a strong and convincing move up for the price of gold to break above the 'Bull Flag."
Perhaps, that strong and convincing move may come when the FOMC moves to increase interest rates as is expected on June 13th, but that's just speculation (on my part), yet it's just one more thing for gold investors to think about, as time moves on.

In Review - continued
In Gold's review chart below, you can see that the positive 'Falling Wedge' was broken last week, but nothing that was written in the previous outlook was the cause of it.
Instead, gold's slight move up in price last week was mostly due to the talking heads in the media about a 'Trade War' between the United States, Canada, and Europe.

Gold - Outlook
As you can see in gold's outlook chart below, it looks as the title says 'Same Pattern, Different Week.'
The positive 'Falling Wedge' can still be drawn, so its still relevant, plus the Bull Flag is still in gold's chart, but at the time being it's nowhere near being confirmed.
For the week to come, it depends on how well the Summit between President Trump and Kim Jong Un goes and on how the FOMC votes this week on interest rates will have a great influence on how gold moves.
Like the U.S. dollar, fundamentals outweigh technical analysis this week, time will tell what happens.

Charts provided courtesy of TradingView.com
Gold's Price Resistance and
Support Levels
Gold's Resistance Levels
$1310.00
$1300.00
Gold's Support Levels
$1280.00
Thank You for Your Time.
Have a Great Week and God Bless,
Steve
'Click Here' see all of the prior Blog posts,
Thank You for Your Time!
|
Investment/Information Disclaimer: All content provided by the Free-Bullion-Investment-Guide.com is for informational purposes only. The comments on this blog should not be construed in any manner whatsoever as recommendations to buy or sell any asset(s) or any other financial instrument at any time. The Free-Bullion-Investment-Guide.com is not liable for any losses, injuries, or damages from the display or use of this information. These terms and conditions of use are subject to change at anytime and without notice. |
Return from this Guide's Latest Blog Post
|
 | |||||
Free Bullion Investment Guide

Recent Articles
-
Free Bullion Investment Guide - April 2024 Newsletter - Volume 45
Apr 12, 24 11:12 AM
The Free Bullion Investment Guide's April 2024 newsletter (Volume 45) provides the latest updates, market analysis, the best articles from last month, and a list of merchants offering bullion discount… -
Silver is Going Higher
Mar 21, 24 09:59 AM
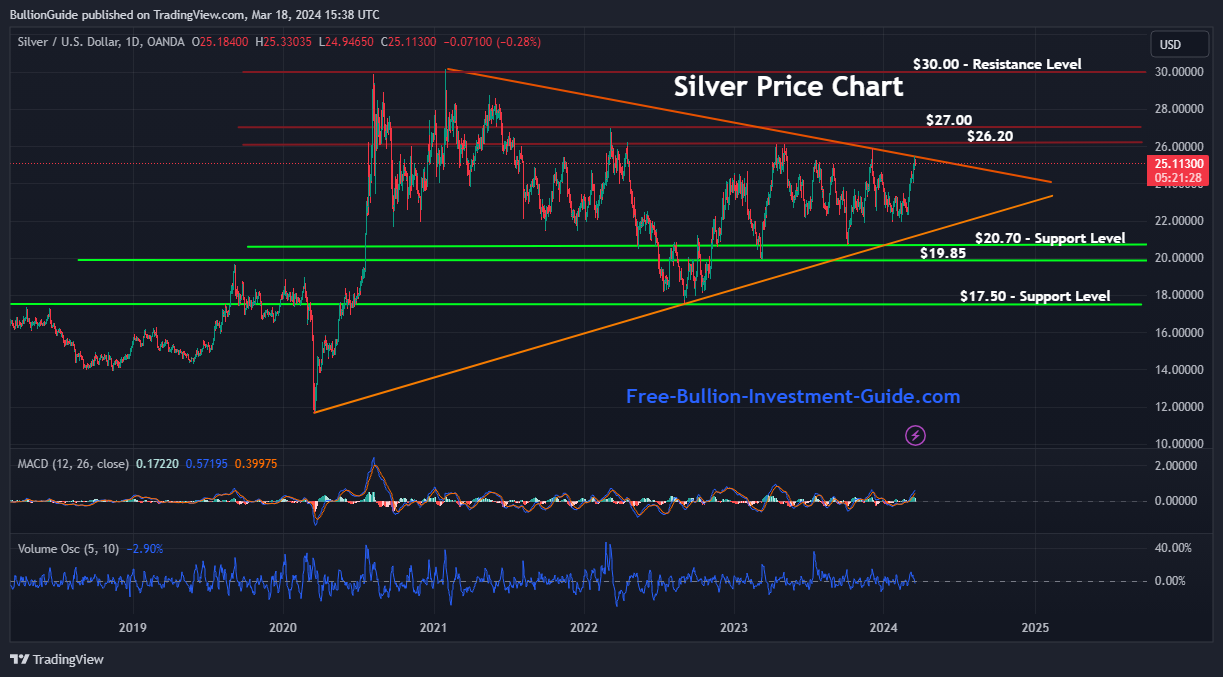 Silver is going higher. Silver has broken a multiyear Pennant pattern to the upside, which is a positive indication that the price of silver will hold its recent gains and move higher.
 -
March 2024 Newsletter - Volume 44
Mar 12, 24 11:06 AM
 The March 2024 newsletter of the Free Bullion Investment Guide (44th Issue) provides the latest updates, market analysis, the best articles from last month, and a list of merchants offering bullion di…
 -
Gold is Going Higher
Mar 07, 24 11:43 AM
Gold is going higher. Gold has broken a negative rising wedge pattern to the upside, which is a positive indication that the price of gold will hold its recent gains and move higher. -
February 2024 Newsletter - Volume 43
Feb 12, 24 06:40 PM
 The February 2024 newsletter of the Free Bullion Investment Guide (43rd Issue) provides the latest updates, market analysis, the best articles from last month, and a list of merchants offering bullion…


Search the Guide
| search engine by freefind | advanced |

Daily
Updated

Updated
Numismatic & Bullion Auctions page

3/21/2024

Updated

03/07/2024
Blog Post
Updated


Update

Update

New Page

Mintage Figures

2023
Mintage Figures


Archangel Raphael
~
The Angel of Healing


Help Us Expand our Audience by forwarding our link
www.free-bullion-investment-guide.com.
Thank You!
March's

pages
Bullion Refiner
Bullion Refiner
