The Dollar Breaks Barriers.
But, Will it Last?
Review and Outlook for the U.S. Dollar, Silver, and Gold
Originally Posted on 4/29/2018 @ 4:07 pm EDT
by Steven Warrenfeltz
Subscribe to this Blog

Hello,
Thank you for visiting the Free-Bullion-Investment-Guide, every visit you make is greatly appreciated.
Before we get to this Review & Outlook, below are some of the Best Bullion Market-Related News articles that were taken from this guide's home page, over the last week.

Silver price could increase in 2018 on safe-haven demand - CPM - Reuters
Federal grand jury indicts top Northwest Territorial Mint officials - Coin World
The Last 2 Times This Happened, Silver Surged Higher - The Motley Fool
10-Year Treasury Yield is Around 3%: Should You Care? - Nasdaq
Best of the Week for
Gold NanoParticle Cancer Research
New Method to Make Drugs Smarter Developed - MeD India

Last weeks blog post only covered Silver, you can see it here, but this week the dollar has broken out, to the upside, and denied the negative patterns that this blog has indicated for the last few weeks.
There were two big reasons for the dollar's rise in price; One was the rise of the 10-year Treasury Note rising above 3%, as you can see in the chart below.

The other reason for the dollar's break out last week was due to the easing of relations with North Korea.
As you can see in the chart above, the 10-year Treasury Note isn't trading above 3%, and with it trading inside the 'Rising Expanding Wedge' it should come down to the 2.9% to 2.7% range sometime in the near future.
To see how all this has affected the U.S. Dollar, Silver and Gold, scroll down to see the charts and analysis.
Review & Outlook
|
All the charts on this blog are Daily Charts unless noted otherwise.
US DOLLAR
In Review
In two week's ago, I wrote the following outlook for the U.S. Dollar and posted the chart below.
For the U.S. Dollar's Outlook, nothing has really changed from last week.
Even though the U.S. dollar confirmed the 'Rising Wedge' in last week's chart above, the same 'Rising Wedge' pattern is still in its chart, it's only a little broader this week.
Since this 'Rising Wedge' is a little broader, the dollar could trade inside it for a little longer before it confirms the negative pattern by falling below the lower trend-line of the wedge.
However, as I am writing this section (Saturday, 4/14) it's in the news that the United States, Britain, and France have launched airstrikes on Syria for their use of chemical weapons, so the dollar may fall sooner than I've stated.
Time will tell what happens.

U.S. Dollar - In Review - continued
In the chart below, you can see that most of what was posted in the last outlook was denied, most of which had to do with the rise in the 10-year Treasury Note's yield and with the positive news coming out of North Korea.
The dollar has only had two down days since I wrote the outlook above.
First, on Monday (April 23rd), after the 10-year Note started to flirt with the 3% level, the dollar broke the 'Rising Wedge' pattern denying its expected negative outcome.
Second, two days later, when the 10-year Note broke above the 3% level, the dollar broke above the $91.00 resistance level that was discussed here: The Dollar Breaks a Critical Support Level.
Lastly, on Thursday of last week (04/27), after North and South Korea had their peace induced summit, the dollar broke above its Descending Channel.
The Descending Channel is the only pattern who's outcome was partly expected, the way it would be broken was unknown, just that it would be broken was expected.
All channels are expected to be broken, fundamentals are usually the cause of what moves an asset break out of a channel, in the dollar's case it was the rise of the 10-year Treasury Note and the North and South Korean summit.

U.S. Dollar - Outlook
In the outlook chart below, the dollar has created a 'Rising Expanding Wedge' pattern.
The pattern is a little more narrow than the one found in the 10-year Treasury Note's chart discussed above in this blog post's introduction, but its negative expectations are the same.
In the title of this blog, this question is implied: Will the Dollar's breaking of barriers last? A: Time will tell.
My eye is on the $91.00 price level for the dollar, the line is now green because after a price has broken above a resistance level it becomes a support level.
However, now that the dollar has broken above it, it will have to show a lot of resilience to stay above it.
For this week's outcome, the FOMC has a meeting on May 2nd, if the Fed raises rates after this date, a pullback by the dollar is almost inevitable, but if they don't raise rates, then perhaps the dollar may trade inside the 'Rising Expanding Wedge' before it confirms it, to the downside, sometime in the near future.

Charts provided courtesy of TradingView.com
U.S. Dollar's Price Resistance and Support Levels
U.S. Dollar's Resistance Levels
$92.00
U.S. Dollar's Support Levels
$91.00
$90.40
SILVER
In Review
In last week's blog post titled: Silver Went Up (last week) Now, Where’s it Going?, the chart and commentary below was posted for silver's outlook.
Silver's has now formed two negative 'Rising Expanding Wedge' patterns in its outlook chart below.
I've
dotted the trend-lines of the larger (and older) of the two patterns
because it may be denied sometime in the coming days and weeks.
In
all honesty, I'd like to see silver deny it and trade higher above its
long-term rising trend-line because the higher it trades above it the
brighter its future is.
But, whether that pattern is denied or
not is up to silver traders, so time will tell whether the larger of
the two patterns is confirmed or not.
In the immediate future, silver has formed another, but more narrow negative 'Rising Expanding Wedge' pattern.
The new, more narrow, negative 'Rising Expanding Wedge' pattern is expected to be confirmed sometime in the near future, when that is exactly is unknown, but because there are now two negative wedge patterns in silver's chart, the precious metal is expected to move down sometime in the near future.

Silver - In Review - continued
In the chart below, you can see that the newer and more narrow 'Rising Expanding Wedge' was confirmed last week.
The older and broader 'Rising Expanding Wedge' is still in silver's chart, it was mentioned in last week's outlook (above) that the pattern may be labeled 'denied' sometime in the future.
This is why the lines on the 'Rising Expanding Wedge' are dotted.
But for now, I'm going to continue to leave it in the chart simply because the pattern can still be drawn, but a new pattern has also formed in silver's chart, it's discussed in the silver's outlook below.

Silver - Outlook
In silver's outlook chart below, it has formed a 'Falling Expanding Wedge.'
The pattern is a positive pattern and it is a narrow wedge, so silver could move above it sometime this week.
However, because the 'Rising Expanding Wedge' is still looming in silver's price chart, the precious metal could also trade down and confirm the older pattern before it confirms the new one.
With the FOMC meeting happening this week on May 2nd, it's almost a toss-up as to what will happen in silver's chart this week. Ultimately, time will tell.

Charts provided courtesy of TradingView.com
Silver's Price Resistance &
Support Levels
Silver's Resistance Levels
$17.50
$17.00
Silver's Support Levels
$16.10
$16.00
GOLD
In Review
Two weeks ago, the following charts and commentary were posted in gold's outlook.

In some of the technical analysis that I see, if a 'high or low' trade is made above or below a trend-line of an analyst's identified pattern, that pattern is considered to be 'confirmed or denied,' whatever the case maybe.
I don't agree with this way of analyzing charts.
If a pattern is broken, then the price should break the pattern convincingly by breaking one of the pattern's trend-lines and closing the trading day above or below it.
But calling a pattern confirmed on the 'flawed' panic trade last Wednesday (4/11) is a bad call, which is why I'm not calling the 'Bull Flag' confirmed or denied, yet.
In the outlook chart below, you can see that Gold moved above the 'Bull Flag' but it could not close the day above it.
President Trump's tweet about bombing Syria helped to create gold's panic trade 'high' by telling the market that missiles 'will be coming' to Syria.
The President's tweet was made in the morning of Wednesday - 4/11, but the 'flawed' panic trade came later in the day when night started to fall on Syria, when traders thought the missiles were going to start hitting Syria.
I too, thought that bombs were going to start falling when night fell in Syria, as I stated in this tweet: here.
But they didn't fall until this weekend, so perhaps the panic trade was a precursor of what the market will do Monday morning - (4/16).
Ultimately, time will tell how gold moves, but there are a lot of fundamental factor's that are working in gold's favor and because of this the 'Bull Flag' is expected to be confirmed sometime in the near future.

In Review - continued
As you can see in the review chart below, the 'Bull Flag' in gold's chart has not been confirmed or denied, yet.
Last week, gold saw a lot of downside with the 10-year Note's rise, but that downward movement has created a new pattern in gold's outlook chart, below, that could help to give it a brighter future.

Gold - Outlook
In gold's outlook chart below, it has formed a positive 'Falling Wedge' pattern inside its 'Bull Flag.'
As previously stated, the 'Falling Wedge' is a positive pattern, so it is expected to be confirmed by the price of gold breaking the pattern to the upside.
Perhaps when it breaks the pattern, to the upside, it could also confirm the 'Bull Flag,' but it will need to be a strong and convincing move up for the price of gold to break above the 'Bull Flag.'
Time will tell what happens.

Charts provided courtesy of TradingView.com
Gold's Price Resistance and
Support Levels
Gold's Resistance Levels
$1380.00
$1350.00
Gold's Support Levels
$1300.00
$1280.00
Thank You for Your Time.
Have a Great Week and God Bless,
Steve
'Click Here' see all of the prior Blog posts,
Thank You for Your Time!
|
Investment/Information Disclaimer: All content provided by the Free-Bullion-Investment-Guide.com is for informational purposes only. The comments on this blog should not be construed in any manner whatsoever as recommendations to buy or sell any asset(s) or any other financial instrument at any time. The Free-Bullion-Investment-Guide.com is not liable for any losses, injuries, or damages from the display or use of this information. These terms and conditions of use are subject to change at anytime and without notice. |
Return from this Guide's Latest Blog Post
|
 | |||||
Free Bullion Investment Guide

Recent Articles
-
Free Bullion Investment Guide - April 2024 Newsletter - Volume 45
Apr 12, 24 11:12 AM
The Free Bullion Investment Guide's April 2024 newsletter (Volume 45) provides the latest updates, market analysis, the best articles from last month, and a list of merchants offering bullion discount… -
Silver is Going Higher
Mar 21, 24 09:59 AM
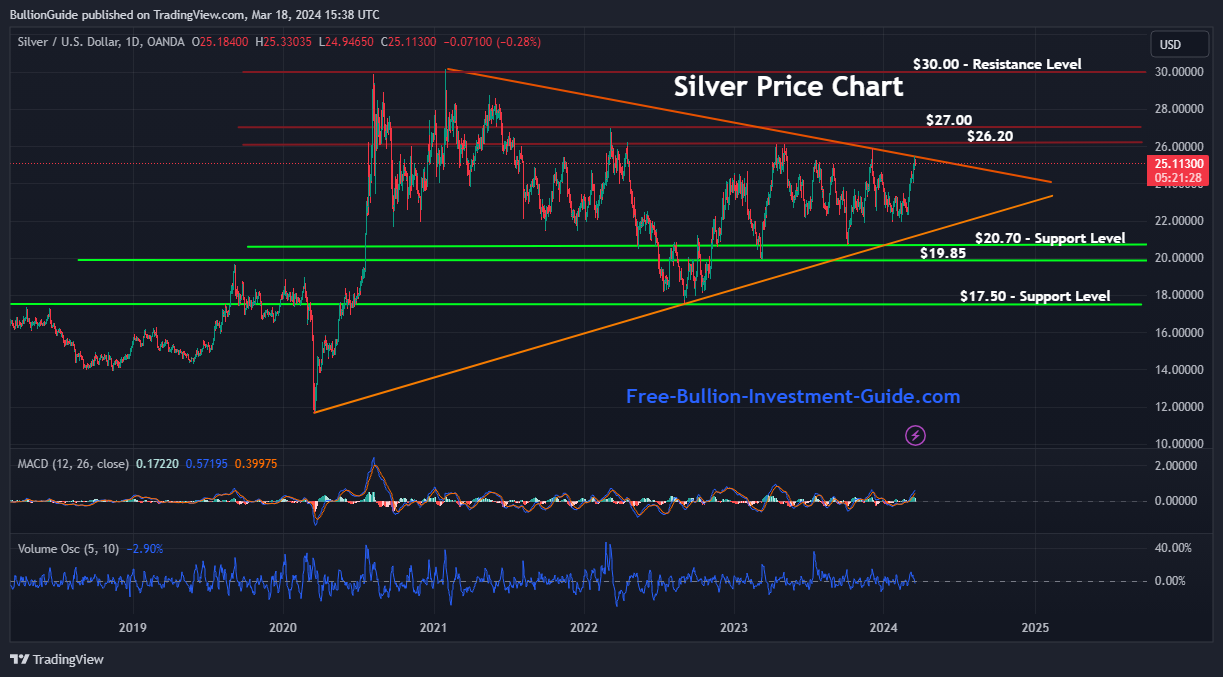 Silver is going higher. Silver has broken a multiyear Pennant pattern to the upside, which is a positive indication that the price of silver will hold its recent gains and move higher.
 -
March 2024 Newsletter - Volume 44
Mar 12, 24 11:06 AM
 The March 2024 newsletter of the Free Bullion Investment Guide (44th Issue) provides the latest updates, market analysis, the best articles from last month, and a list of merchants offering bullion di…
 -
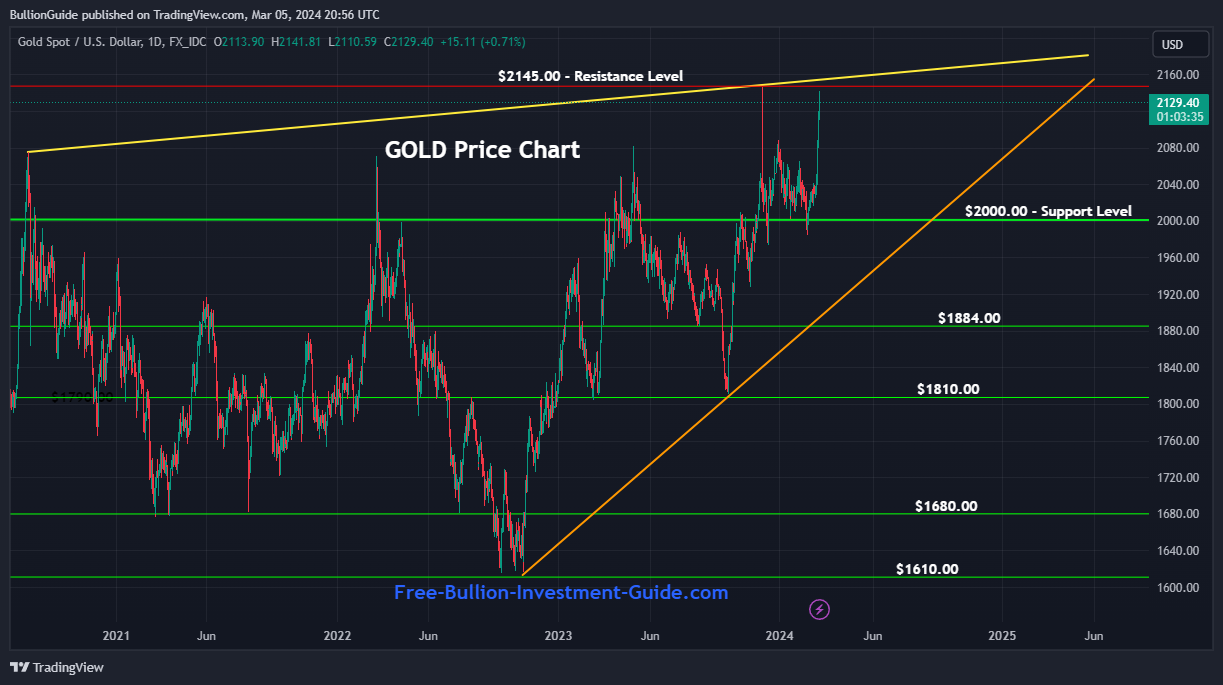
Gold is Going Higher
Mar 07, 24 11:43 AM
Gold is going higher. Gold has broken a negative rising wedge pattern to the upside, which is a positive indication that the price of gold will hold its recent gains and move higher. -
February 2024 Newsletter - Volume 43
Feb 12, 24 06:40 PM
 The February 2024 newsletter of the Free Bullion Investment Guide (43rd Issue) provides the latest updates, market analysis, the best articles from last month, and a list of merchants offering bullion…

Search the Guide
| search engine by freefind | advanced |

Daily
Updated

Updated
Numismatic & Bullion Auctions page

3/21/2024

Updated

03/07/2024
Blog Post
Updated


Update

Update

New Page

Mintage Figures

2023
Mintage Figures


Archangel Raphael
~
The Angel of Healing


Help Us Expand our Audience by forwarding our link
www.free-bullion-investment-guide.com.
Thank You!
March's

pages
Bullion Refiner
Bullion Refiner
