
ExpressGoldCash - 4.9 star - Customer Reviews
Gold and Silver are Moving
Back Up...
in their short-term trade
Precious Metals Review and Outlook for Mid-July 2017
Originally Posted on 07/17/2017 @7:43 pm
by Steven Warrenfeltz
Subscribe to this Blog

Hello,
Thank you for visiting the Free-Bullion-Investment-Guide's latest blog, I hope that you and your family have been well.
Before we get to this week's post; below are a few of Last Week's Best News Articles that were taken from this guide's homepage.

Silver Eagles Starting to take Wing - Numismatic News
The CPI Understates Inflation And Skews Expectations - Advancing Time
One Hundred Years of Federal Reserve Interest Rate Policy Explained - Econimica
Gold Buyers Flee a Month After Their Most Bullish Bet of '17 - Bloomberg
VIDEO : Janet Yellen's House Testimony in Two Minutes - Bloomberg
Why is the Dime Smaller than other Coins? - Philly Voice
Best of the Week for Nano-Particle Cancer Research
GOLD NANOTECHNOLOGY : CANCER RESEARCH : Using Light to Activate Genes and Kill Cancer - medGadget
Gold and Silver are Moving
Back Up...
A little over a week ago, gold and silver dropped unexpectedly in price.
After prices dropped, it had become very obvious that little technical analysis could be done to determine the future direction of the precious metals.
For this reason, last week’s post centered around gold and silver’s price drop and offered very little outlook.
Now that the precious metals have settled down in their volatility, positive patterns have formed and a clear ‘short-term’ outlook can be offered for your review; below you will find charts for Gold, Silver, the U.S. Dollar, Platinum, Palladium and a follow-up review of the GDX (Gold Miners ETF).
GOLD
Last week, after the dust settled from gold's price drop, a 'falling expanding wedge' formed in gold's price chart (below).
All falling wedges are positive technical patterns, however for gold to confirm the pattern it will need to break above the upper resistance trend-line of the wedge.
In addition, gold's MACD (lower indicator) is showing that its direction is about to change from negative to positive, so we should continue to see gold climb this week, but some profit taking is also expected as it moves up.

Charts provided courtesy of TradingView.com
Gold's Price Resistance and
Support Levels
Gold's Resistance Levels
$1250.00
$1240.00
Gold's Support Levels
$1210.00
$1195.00
SILVER
Two weeks ago, when silver's price dropped, it fell so much that it came very close to breaking its 'Long-Term Rising Trend-line.
This trend-line has been in existence since Silver's December 2015 low of $13.60.
Technically it has fallen below it, as you can see by the thin lines of the candlestick's shadow (candlestick chart description photo), but apparently, that was caused by some one's 'fat fingers.'
If the price of silver were to close a day of trading below this trend-line, lower prices would surely ensue. In fact, if silver falls below this line, we can almost be sure to see it test the December 2015 low.
But, that hasn't happened, instead silver has formed a falling wedge in its price chart.
So, this week we should see silver stay above the long-term trend-line and start to test the resistance (red) trend-line of its falling wedge.

charts provided courtesy of TradingView.com
Silver's Price Resistance &
Support Levels
Silver's Resistance Levels
$16.55
$16.30
Silver's Support Levels
$15.55
$14.80
US DOLLAR
It's been three weeks since I've done any commentary on the U.S. Dollar, but that's mostly been because nothing has really changed.
At least 2 months have gone by since I outlined its Descending Channel.
As long as it continues to trade inside it, there isn't much I can say except "to expect more of the same."
When it breaks out of this channel a clearer future can be given for the dollar because it will be an indication that sentiment has changed; either for the better or the worse.

Charts provided courtesy of TradingView.com
U.S. Dollar's Price Resistance and Support Levels
U.S. Dollar's Resistance Levels
$96.50
$95.50
U.S. Dollar's Support Levels
$94.50
$94.00
PLATINUM
Review
Like the U.S. Dollar, it has been three weeks since I've made any commentary for Platinum.
However, three weeks ago I posted the chart below with the following commentary:
The Descending Channel is an obvious negative pattern for the precious metal, but the Falling Wedge is a positive pattern, so in an investor's point of view they cancel each other out, unless the price of Platinum breaks above the Descending Channel, after it confirms the Falling Wedge.
Overall, Platinum's outlook won't change to the positive until it breaks above the Descending Channel.

PLATINUM - This Week
As you can see in the chart below, Platinum did confirm the positive Falling Wedge, but it is still trading inside the Descending Channel.
So nothing much has changed, except to say that Platinum's MACD does look like it is about to turn up, so the price of platinum could start to test the upper falling trend-line of the descending channel this week.
Time will tell.

Charts provided courtesy of TradingView.com
Platinum's Price
Resistance and Support Levels
Platinum's Resistance Levels
$945.00
$935.00
Platinum's Support Levels
$920.00
$910.00
PALLADIUM
Three weeks ago, I didn't give much of an outlook for Palladium because there wasn't much to give.
But that's changed, over the last few weeks it's been forming a Falling Wedge.
So sometime in the near future, Palladium is expected to break this pattern, although this week's chart its MACD and RSI are showing that perhaps some pullback will happen.

Charts provided courtesy of TradingView.com
Palladium's Price Resistance and Support Levels
Palladium's Resistance Levels
$925.00
$885.00
Palladium's Support Levels
$830.00
$800.00
GDX - Gold Miners ETF
Three weeks ago I posted the GDX chart below with the following commentary:
I'm going to start randomly follow other charts that relate to the markets above, this week's addition will be the GDX – Gold Miners ETF.
Next week, I will move on to another asset's chart, unless the GDX breaks in one way or another the pattern that I found in the chart.
However, if it doesn't I will move on, but I will come back to it when the pattern does break to show you how it moved.
So, in the GDX's chart I found a falling wedge, this is a positive pattern as seen in the definition here.
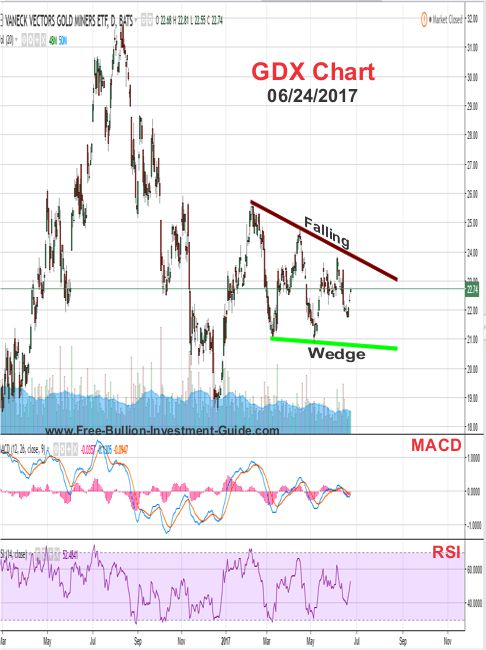
GDX Update
I didn’t do a different asset chart last week because I wrote about gold and silver’s price drop, but since three weeks have passed since I posted the chart, I wanted to show you an updated GDX chart.
Practically nothing has changed, the GDX is still trading inside its falling wedge, and like all the others at some time in the near future, it is expected to break above it.

Charts provided courtesy of TradingView.com
Thank You for Your Time.
Have a Great Week.
God Bless, Steve
'Click Here' see all of the prior Blog posts,
Thank You for Your Time!
|
Support this Guide & Paypal Thank You for Your Support |
|
|
 | |||||

Recent Articles
-
Newsletter of the Free Bullion Investment Guide - May 2026
May 05, 26 02:25 PM
 The May 2026 newsletter of the Free Bullion Investment Guide provides the latest updates, fundamental and technical gold and silver market analysis, the best articles from last month, and a list of re…
 -
Newsletter of the Free Bullion Investment Guide - April 2026
Apr 05, 26 04:44 PM
 The April 2026 newsletter of the Free Bullion Investment Guide provides the latest updates, fundamental and technical gold and silver market analysis, the best articles from last month, and a list of…
 -
Newsletter of the Free Bullion Investment Guide - March 2026
Mar 04, 26 02:08 PM
 The March 2026 newsletter of the Free Bullion Investment Guide provides the latest updates, fundamental and technical gold and silver market analysis, the best articles from last month, and a list of…
 -
Newsletter of the Free Bullion Investment Guide - February 2026
Feb 07, 26 02:12 PM
 The February 2026 newsletter of the Free Bullion Investment Guide provides the latest updates, fundamental and technical gold and silver market analysis, the best articles from last month, and a list…
 -
Newsletter of the Free Bullion Investment Guide - January 2026
Jan 07, 26 04:07 PM
 The January 2026 newsletter of the Free Bullion Investment Guide provides the latest updates, fundamental and technical gold and silver market analysis, the best articles from last month, and a list o…

18W LED Security Light (Dusk to Dawn & Motion Sensor) - $32.99
from:
 LED Lighting

) (as of March 11, 2011)")
This website is best viewed on a desktop computer.
Keep this Guide Online
& Paypal
Thank You for
Your Support
with Feedly
Search the Guide
| search engine by freefind | advanced |

Give a lasting gift of the iconic Silver Maple Leaf bullion coin [More]
Free Shipping on Orders over $100 (CDN/USA)
The Sovereign 2026 Gold Bullion Coin in Card

Britian's
Royal Mint

Daily
2026 Silver Kookaburra
Photo & Mintage Update

Newsletter
Mintages & Photos
|

|
Silver Panda |

Mintages
for
2024
Gold, Silver, & Platinum
Austrian Philharmonic Bullion Coins

|
Silver Philharmonics  |
Platinum Philharmonics

Platinum and Palladium Bullion


Mintages
for
2025
Gold & Silver Mexican Libertad
|
Gold Libertads |


Updated Mintages for
American Gold Buffalo
American Gold Eagle
American Silver Eagle


Help Us Expand our Audience by forwarding our link
www.free-bullion-investment-guide.com.
Thank You!
Last Month's

In No Particular Order
April 2026
|
All Articles were Originally Posted on the Homepage Gold Nanoparticle Cancer ResearchSona Nanotech’s Hyperthermia Platform Boosts Immunotherapy Response in Colorectal Cancer Study - Tipranks Sona Nanotech Showcases Cancer Therapy Results At Prestigious Industry Cancer Conferences - Financial Times Development of gold nanostars coated with mesoporous silica for chemo-photothermal therapy - Published Research Paper - Journal of Drug Delivery Science and Technology (Science Direct) |
All Articles were Originally Posted on the Homepage