The Dollar is Trading
in a Negative Pattern
Despite its Positive News
UPDATE
Review and Outlook for the U.S. Dollar, Silver, and Gold
Originally Posted on 11/07/2017 @ 11:43 am
by Steven Warrenfeltz
Subscribe to this Blog
Hello,
Thank you for visiting the Free-Bullion-Investment-Guide's latest blog post, before we get to the precious metals review and outlook, below are some of last week's Best Bullion Market-Related News articles that were taken from this guide's home page.

FAKE BULLION ALERT: Fake Gold Bar Did Not Come From RCM - Kitco
INFOGRAPHIC: All of the World’s Money and Markets in One Visualization - Visual Capitalist
Austerity Should Be Renamed Sustainable Spending - Advancing Times
Central-Bank Demand for Gold Bars 'Set to Grow' in 2018 - Bullion Vault
AUDIO : INTEREST RATES AT 5,000 YEAR LOW - McAlvany Weekly Commentary
Best of the Week for Gold NanoParticle Cancer Research
New clinical trial offers hope to patients with glioblastoma - WGNTV (Chicago, IL)
Magnetic gold is evidence of relativity, study finds - Cosmos Magazine
Besides the fact that 2-weeks have passed, not much has changed in the charts for the U.S. Dollar, Silver, and Gold since my last blog post.
In addition, the narrative for the first post under the same name hasn't changed either, the U.S. dollar is just getting more good press than it was two weeks ago.
It kind of sounds like I'm leading you up to something, doesn't it? I'm not trying too, except for the fact that the U.S. Dollar is still trading in a negative pattern and gold and silver are trading in positive patterns.
In the original blog post seen here, I discussed the fact that tax cuts without spending cuts lead to a lower dollar and higher gold, but they haven't been passed yet and nobody knows what will be in the final deal, so that argument is up in the air at the moment.
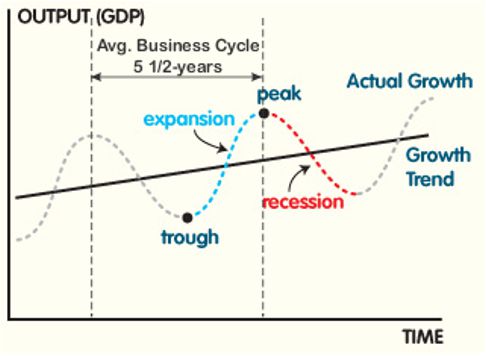
As for the rest of the information, it all sounds good to me, the only way to look at things negatively, is to look at the business cycle, which is completely out of whack, plus the stock markets hasn't had a decent pullback in over a year and volatility is at multiyear lows.
Average Business Cycle Chart

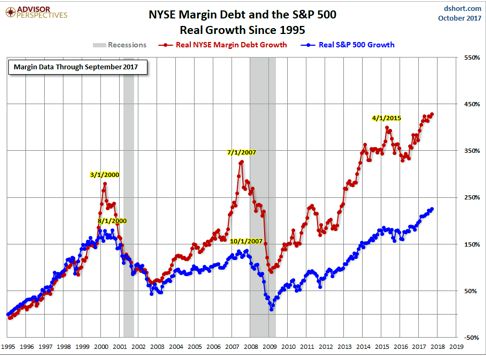
In addition, Margin debt is at all times highs and everyone thinks this is the 'New Norm.'
What could go wrong?
NYSE Margin Debt Chart
and the S&P 500
If your assets are covered, that's great, you have the freedom to play the market however you choose.
But, if they're not, its always best to have a little insurance (a.k.a. Precious Metals) in your portfolio so you don't end up a fool.
At least 10% of this insurance is recommended for everyone's portfolio, if you choose to have more or less, that's your prerogative, just don't tell me I didn't warn you.
As for the charts, below you'll find updated charts for the U.S. Dollar, Gold, and Silver.
Review & Outlook
|
All the charts on this blog are Daily Charts unless noted otherwise.
US DOLLAR
In Review
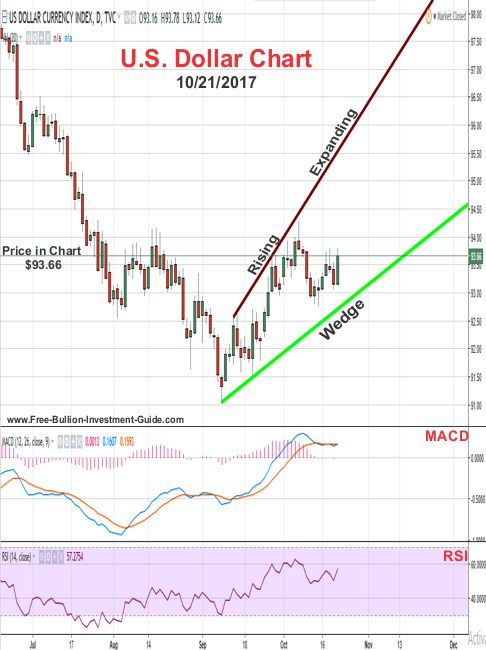
Two weeks ago, I wrote the following about the U.S. Dollar and posted the chart below.
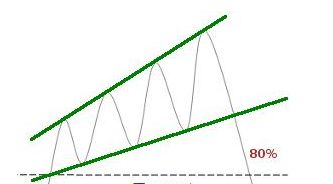
In the chart below, you can see that the negative 'Rising Expanding Wedge' pattern is very broad, and the dollar's been trading inside of it since early September.
It clearly could continue to move inside the pattern and that is expected as it continues to move up on the news of how the tax cuts will help the economy.
It won't be until the details of the 2018 budget deal are passed into law to know how the specifics in the bill will affect the Dollar.
But, as long as the negative pattern is looming over the dollar, its future does not look as bright as some may think.
In Review - continued
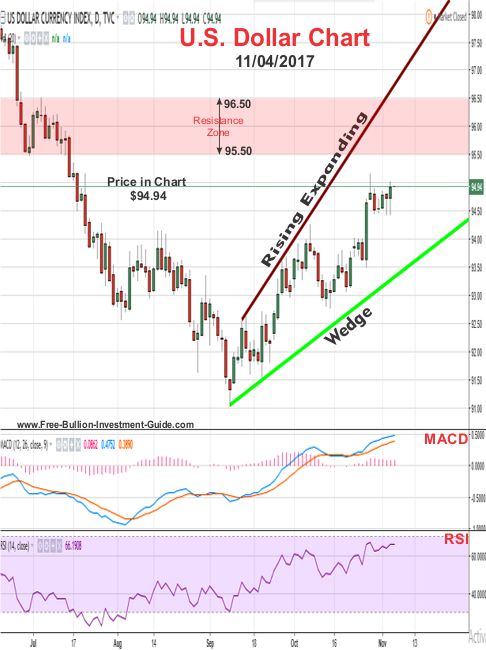
As you can see in the chart below, what was posted two weeks ago, is mostly what happened.
The dollar continued to move up in the wedge pattern, the price not only moved up on the continued reports of how the tax cuts will help the economy, it was also fueled by the positive non-farm payroll numbers and a good GDP report.
However, the negative pattern continues to linger over the dollar's price.
U.S. Dollar - This Week's Outlook
As for the week to come, if the U.S. Dollar continues to rise, it will start to hit resistance at the $95.50 level.
Therefore, although I have little doubt that the U.S. Dollar will continue to trade inside the 'Rising Expanding Wedge' some pullback may happen this week.
In addition, the Dollar's MACD and RSI are starting to move a little higher in the overbought territory, so if the dollar hits the $95.50 level this week, the dollar will consolidate at this level, and we may see a pullback.
Charts provided courtesy of TradingView.com
U.S. Dollar's Price Resistance and Support Levels
U.S. Dollar's Resistance Levels
$96.50
$95.50
U.S. Dollar's Support Levels
$94.00
$93.00
SILVER
In Review
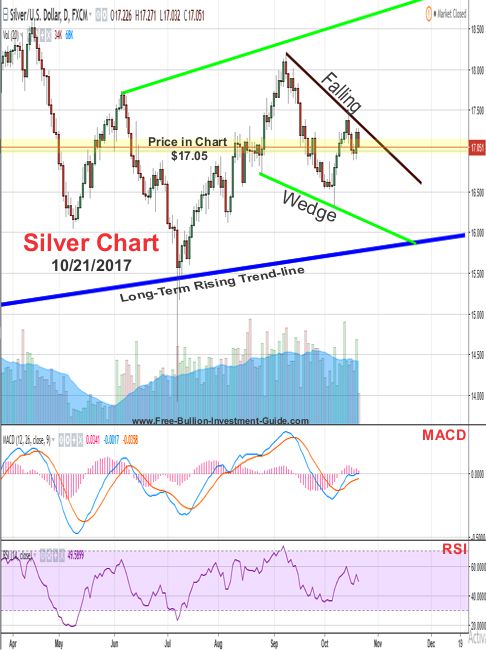
Below is silver's commentary and chart outlook from 2 weeks ago.
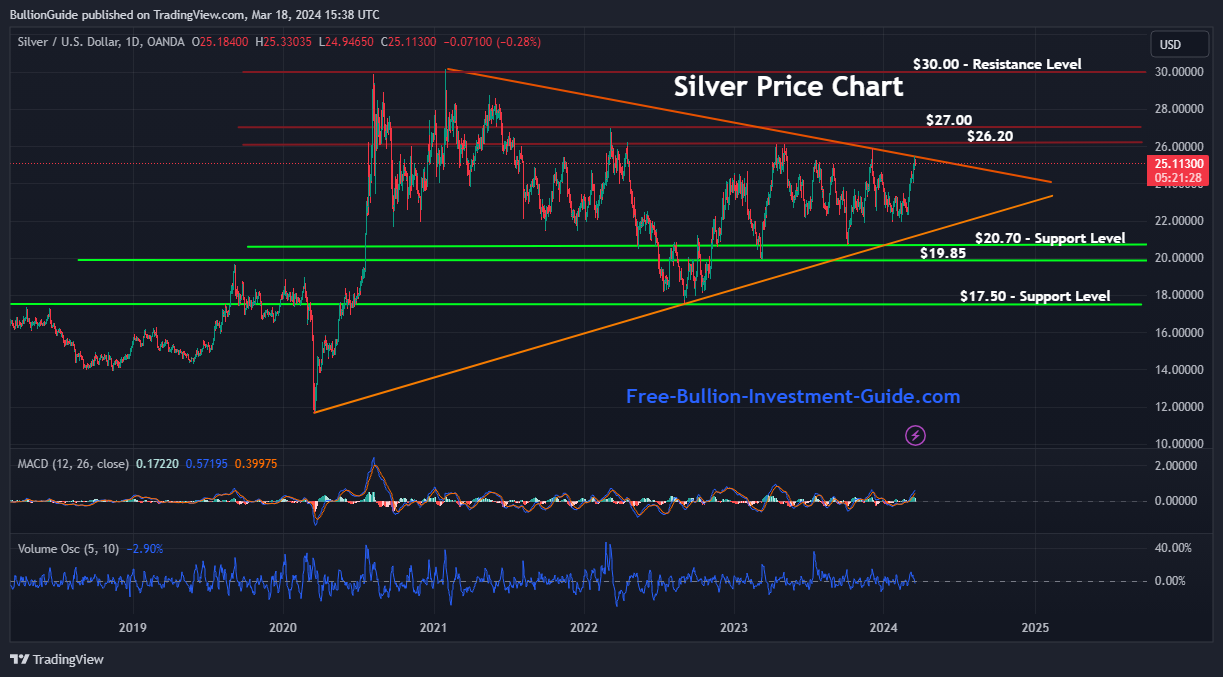
For the week to come, silver's price chart has formed a positive pattern known as a 'Falling Wedge'.
However, silver's MACD and RSI are giving very little indication as to which way the precious metal will move.
Furthermore, silver's 'Falling Wedge' is broad, so it may (continue to) trade inside it before it confirms the positive pattern. Time will tell.
In Review - continued
The outlook from two weeks ago so far looks to be holding up, if you look at the chart below, silver is still trading inside the 'broad' Falling Wedge, plus over the last two weeks, it hasn't given much of an indication as to which way its price is going to move.
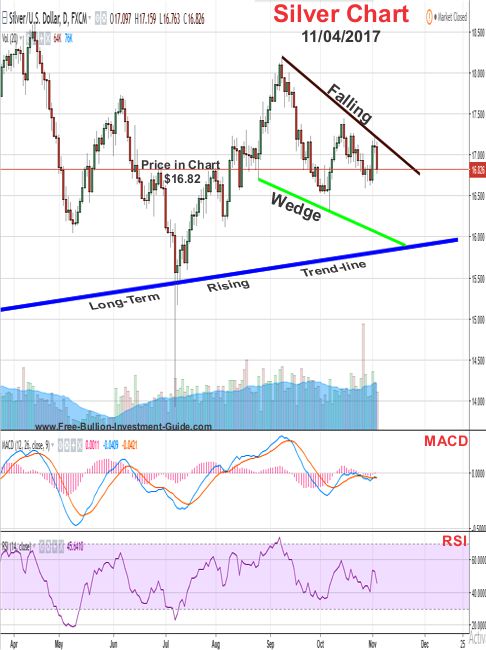
Silver - This Week's Outlook
For the week ahead, silver continues to show very little as to which way it's going to move.
Although it did come close to breaking the upper falling trend-line of the wedge last week, the price did not close the day out above it.
In addition, Silver's MACD and RSI are both giving little indication as to which way the price may move, so we may continue to see the price move sideways, and perhaps that sideways movement may ultimately break the wedge. Time will tell.
Charts provided courtesy of TradingView.com
Silver's Price Resistance &
Support Levels
Silver's Resistance Levels
$17.75
$17.50
Silver's Support Levels
$16.80
$16.50
GOLD
In Review
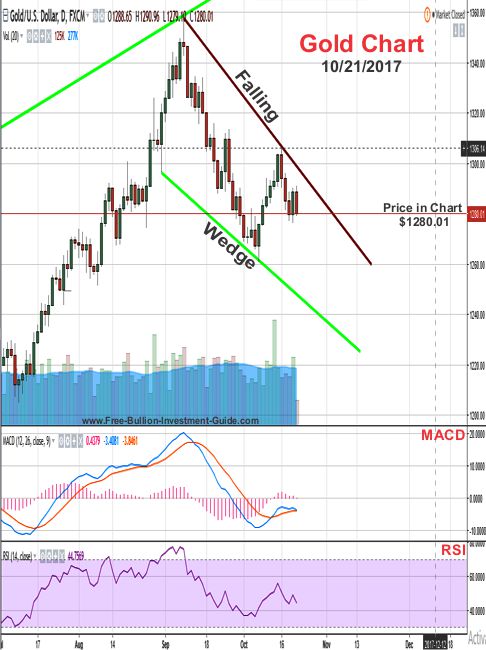
Below is the gold outlook from two weeks ago.
For the week to come, like silver, gold has formed a positive 'Falling Wedge' pattern.
Although the pattern is positive, the pattern is broad so the price of gold has room to trade inside it.
Plus, the MACD and RSI are giving very little indication as to which way it will move, so this week although gold's trading in a positive pattern, we could literally see it move in either way. Time will tell.
In Review - continued
Over the last two weeks, gold moved down, but it is still trading inside the positive 'Falling Wedge' as noted two weeks ago.
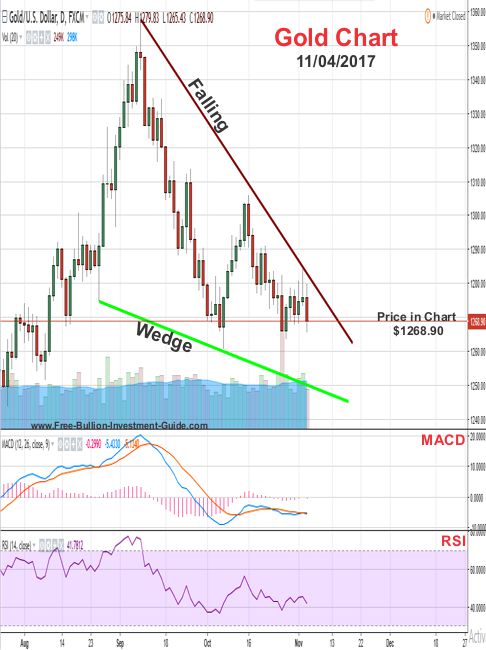
Gold - This Week's Outlook
As for the week ahead, gold's MACD and RSI are looking a little more positive than silver's lower indicators.
To clarify, they don't look positive because they are in positive territory, nor do they look like they are indicating a positive change in price.
They look positive because unlike silver, they've been moving in oversold territory for more than a week and sometimes when price indicators move in the oversold territory for so long, a change in price usually isn't far behind.
So like silver, we may see the price of gold move sideways this week or perhaps it could move up in price, either way, it looks like the upper falling trend-line of the wedge will be tested this week.
Charts provided courtesy of TradingView.com
Gold's Price Resistance and
Support Levels
Gold's Resistance Levels
$1310.00
$1300.00
Gold's Support Levels
$1260.00
$1250.00
Thank You for Your Time.
Have a Great Week.
God Bless, Steve
'Click Here' see all of the prior Blog posts,
Thank You for Your Time!
|
Investment/Information Disclaimer: All content provided by the Free-Bullion-Investment-Guide.com is for informational purposes only. The comments on this blog should not be construed in any manner whatsoever as recommendations to buy or sell any asset(s) or any other financial instrument at any time. The Free-Bullion-Investment-Guide.com is not liable for any losses, injuries, or damages from the display or use of this information. These terms and conditions of use are subject to change at anytime and without notice. |
|
 | |||||
Free Bullion Investment Guide
Search the Guide
| search engine by freefind | advanced |

Daily
Updated
Updated
Numismatic & Bullion Auctions page
3/21/2024
Updated
03/07/2024
Blog Post
Updated
Update
Update
New Page
Mintage Figures
2023
Mintage Figures
Archangel Raphael
~
The Angel of Healing
Help Us Expand our Audience by forwarding our link
www.free-bullion-investment-guide.com.
Thank You!
March's

pages
Bullion Refiner
Bullion Refiner

