The Dollar is Trading
in a Negative Pattern
Despite its Positive News
Precious Metals Review and Outlook from
10/16 thru 10/27/2017
Originally Posted on 10/23/2017 @ 4:03 pm
by Steven Warrenfeltz
Subscribe to this Blog

Hello,
Thank you for visiting the Free-Bullion-Investment-Guide's latest blog post, before we get to the precious metals review and outlook, below are some of last week's Best Bullion Market-Related News articles that were taken from this guide's home page.

Peak Gold Output Is Looming for World’s No. 2 Producer - Bloomberg
10/20: Trump Says He’s Eyeing Taylor, Powell, Yellen for Top Fed Post - Bloomberg
Bubble-nomics - Econimica
Russia’s central bank will buy gold for its reserves on the Moscow Exchange starting Nov. 1 - Reuters
Best of the Week for Gold NanoParticle Cancer Research
Indian, Russian scientists craft gold nanostars to destroy cancer cells - Economic Times
Gold nanomaterial offers cheap way to detect cancer - University of Wollongong Australia
Chemistry Professor Develops Optical Imaging Tool To Target Cancer Cells - Georgia State University

Friday evening (10/20/2017), as I was looking for news articles to post on the homepage, I found article after article about how the market predicts a higher dollar.
The reasoning behind these predictions is being made mostly due to the U.S. Senate's vote to approve the 2018 budget plan, that also includes a massive tax cut.
See these articles:
KITCO WEEKLY OUTLOOK: U.S. Dollar, Stocks To Dominate Gold Prices - Kitco
FOREX-Dollar jumps vs safe havens after U.S. Senate clears way for tax reform - Reuters

Despite all the positive news about the dollar, Technically speaking it is trading in a negative pattern, that I'll cover in the U.S. Dollar section below.
But, Fundamentals always trump Technical analysis (no pun intended) and there is a Huge 800lbs. Fundamental Gorilla that is being overlooked in the markets and in these articles.
Tax Cuts are great for the Market, however, the fact that is being overlooked, is that cutting taxes without spending cuts will hurt the U.S. Dollar.
I'm not a tax cut hater, I love them, and they will do great things for the markets, but the government won't see the added revenue from the economic benefits for a least a few years.
In addition, in all honesty, I've read that there are some spending cuts in the budget bill that the tax cuts are also apart of, however, unless the spending cuts are as big or more than the tax cuts, the inevitable outcome is more debt.
Taxes are the government's largest source of income, it's a simple known fact that debt will become a major issue if you cut a person's, a company's or in this case a government's main source of income without cutting spending.
The other inevitable outcome for the entity is that their money will have less purchasing power because most of it will be going towards servicing its debt.
See these two articles from last week.
GOP Congress Presides Over Highest Spending Since Obama’s Stimulus - cnsnewsU.S. Ran $666 Billion Deficit In Fiscal 2017, Sixth Highest on Record - The Wall Street Journal
The budget hasn't passed yet, which means the dollar will most likely go up in the hype, but unless there is also large spending cuts in the budget, look for the dollar to retreat in price, not rise.
Before we move on, for those who want a real-life example what is most likely to happen to the dollar after the 2018 budget is passed, you just need to look back at the dollar's movement from 2003-2013 after the last tax-cut plan was enacted without deep spending cuts.

Or you can look at what Gold did during the same period.

The last two charts were provided courtesy of Stockcharts.com
In January of 2013, the tax cuts ended. That was also when the gold bull market ended and the dollar bull started.
Review & Outlook
|
All the charts on this blog are Daily Charts unless noted otherwise.
US DOLLAR

In Review
Last week, I didn't write too much about the U.S. Dollar, but below is the commentary and chart from a week ago.
For the week to come, the U.S. Dollar's MACD and RSI are both indicating that the price has more room to fall.
So it looks like this week we should see the negative pattern confirmed, time will tell.

In Review - continued
In the chart below, you can see that last week the dollar didn't move down, instead it mostly moved upward.
U.S. Dollar - This Week's Outlook
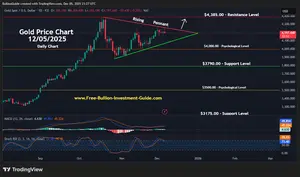
In the chart below, you can see that the negative 'Rising Expanding Wedge' pattern is very broad, and the dollar's been trading inside of it since early September.
It clearly could continue to move inside the pattern and that is expected as it continues to move up on the news of how the tax cuts will help the economy.
It won't be until the details of the 2018 budget deal are passed into law to know how the specifics in the bill will affect the Dollar.
But, as long as the negative pattern is looming over the dollar, its future does not look as bright as some may think.

Charts provided courtesy of TradingView.com
U.S. Dollar's Price Resistance and Support Levels
U.S. Dollar's Resistance Levels
$95.00
$94.00
U.S. Dollar's Support Levels
$93.00
$92.00
SILVER
In Review
Below is silver's commentary and chart outlook from last week.
For the week to come, I didn't point out any new patterns in the chart below because no clear trend-lines have been identified except the bottom long-term trend-line that dates back to December 2015.
However, in the chart below, you'll also notice a un-named 'green' trend-line.
This trend-line could be the 'Neck-line' of a possible 'Inverse Head and Shoulders' pattern or it could simply be a resistance line, more time needs to pass before it can be determined how this trend-line can be identified.
However, ultimately for the week to come, silver's MACD and RSI are showing that its price has more room up to move, plus, last week's consolidation area will become a support level for the price of silver.

In Review - continued

As you can see in the chart below, the dollar didn't rise last week.
Instead, it fell in price, but the consolidation area highlighted in the chart above and below was able to support the price of silver.
Furthermore, last week I mentioned that there are a possible 'Inverse Head and Shoulders' pattern forming on silver's chart and that the green line is a possible neckline
I also stated that it's too early to know what that green trend-line will end up being identified as, but for now, it will simply be a resistance line on the chart and next week it will be red.
Silver - This Week's Outlook
For the week to come, silver's price chart has formed a positive pattern known as a 'Falling Wedge'.
However, silver's MACD and RSI are giving very little indication as to which way the precious metal will move.
Furthermore, silver's 'Falling Wedge' is broad so it may trade inside it before it confirms the positive pattern. Time will tell.

Charts provided courtesy of TradingView.com
Silver's Price Resistance &
Support Levels
Silver's Resistance Levels
$17.75
$17.50
Silver's Support Levels
$16.95
$16.80
GOLD
In Review
Below is the gold outlook from last week.
In the chart below, for the week to come, like silver, no clear patterns have formed.
But, Gold's MACD and RSI are indicating that gold's price has more room to rise this week, some consolidation along the way is always expected.
Lastly, like silver, I've put in the chart below a un-named 'green' trend-line, and like silver, this could either be the Neck-Line of an 'Inverse Head and Shoulders' pattern or it could simply be a resistance trend-line.
However, it's too soon to tell, I've been seeing the 'Inverse H&S' pattern in the charts for over a month now and I thought I'd finally make you aware of it if you haven't already been watching it yourself.

In Review - continued
In the chart below, you can see that the price of gold fell last week, making the majority of my outlook from last week incorrect.
In addition, as I stated in last week's outlook, gold's chart looked to be forming an 'Inverse Head and Shoulders' pattern, but that it was too soon to start to speculate on it. That point of view hasn't changed.
Gold - This Week's Outlook
For the week to come, like silver, gold has formed a positive 'Falling Wedge' pattern.
Although the pattern is positive, the pattern is broad so the price of gold has room to trade inside it.
Plus, the MACD and RSI are giving very little indication as to which way it will move, so this week although gold's trading in a positive pattern, we could literally see it move in either way. Time will tell.

Charts provided courtesy of TradingView.com
Gold's Price Resistance and
Support Levels
Gold's Resistance Levels
$1350.00
$1310.00
Gold's Support Levels
$1280.00
$1250.00
Thank You for Your Time.
Have a Great Week.
God Bless, Steve
'Click Here' see all of the prior Blog posts,
Thank You for Your Time!
|
Investment/Information Disclaimer: All content provided by the Free-Bullion-Investment-Guide.com is for informational purposes only. The comments on this blog should not be construed in any manner whatsoever as recommendations to buy or sell any asset(s) or any other financial instrument at any time. The Free-Bullion-Investment-Guide.com is not liable for any losses, injuries, or damages from the display or use of this information. These terms and conditions of use are subject to change at anytime and without notice. |
|
Support this Guide & Paypal Thank You for Your Support |
|
|
 | |||||

Recent Articles
-
Newsletter of the Free Bullion Investment Guide - April 2026
Apr 05, 26 04:44 PM
 The April 2026 newsletter of the Free Bullion Investment Guide provides the latest updates, fundamental and technical gold and silver market analysis, the best articles from last month, and a list of…
 -
Newsletter of the Free Bullion Investment Guide - February 2026
Feb 07, 26 02:12 PM
 The February 2026 newsletter of the Free Bullion Investment Guide provides the latest updates, fundamental and technical gold and silver market analysis, the best articles from last month, and a list…
 -
Newsletter of the Free Bullion Investment Guide - January 2026
Jan 07, 26 04:07 PM
 The January 2026 newsletter of the Free Bullion Investment Guide provides the latest updates, fundamental and technical gold and silver market analysis, the best articles from last month, and a list o…
 -
Newsletter of the Free Bullion Investment Guide - December 2025
Dec 07, 25 04:35 PM
 The December 2025 newsletter of the Free Bullion Investment Guide provides the latest updates, fundamental and technical gold and silver market analysis, the best articles from last month, and a list…
 -
Newsletter of the Free Bullion Investment Guide - November 2025
Nov 08, 25 01:58 PM
 The November 2025 newsletter of the Free Bullion Investment Guide provides the latest updates, fundamental and technical gold and silver market analysis, the best articles from last month, and a list…

18W LED Security Light (Dusk to Dawn & Motion Sensor) - $32.99
from:
 LED Lighting

) (as of March 11, 2011)")
This website is best viewed on a desktop computer.
Keep this Guide Online
& Paypal
Thank You for
Your Support
with Feedly
Search the Guide
| search engine by freefind | advanced |

Give a lasting gift of the iconic Silver Maple Leaf bullion coin [More]
Free Shipping on Orders over $100 (CDN/USA)
The Sovereign 2026 Gold Bullion Coin in Card

Britian's
Royal Mint

Daily
Newsletter
Mintages & Photos
|

|
Silver Panda |

Mintages
for
2024
Gold, Silver, & Platinum
Austrian Philharmonic Bullion Coins

|
Silver Philharmonics  |
Platinum Philharmonics

Platinum and Palladium Bullion


Mintages
for
2025
Gold & Silver Mexican Libertad
|
Gold Libertads |


Updated Mintages for
American Gold Buffalo
American Gold Eagle
American Silver Eagle
2024 & 2025
Jerusalem of Gold Bullion
Coin photos
(bottom of page)
 Obverse side")


Help Us Expand our Audience by forwarding our link
www.free-bullion-investment-guide.com.
Thank You!
Last Month's

In No Particular Order
April 2026
|
All Articles were Originally Posted on the Homepage Gold Nanoparticle Cancer ResearchSona Nanotech’s Hyperthermia Platform Boosts Immunotherapy Response in Colorectal Cancer Study - Tipranks Sona Nanotech Showcases Cancer Therapy Results At Prestigious Industry Cancer Conferences - Financial Times Development of gold nanostars coated with mesoporous silica for chemo-photothermal therapy - Published Research Paper - Journal of Drug Delivery Science and Technology (Science Direct) |
All Articles were Originally Posted on the Homepage