Homepage / Bullion Investment Basics: Price Inflation
Last Update 12/19/2023
Price Inflation
in the United States
What is Inflation?
Inflation is the devaluation of a currency through the increase in the amount of money circulating in society, resulting in the eventual rise in the price of goods.
How is Inflation Calculated?
As inflation rises, every dollar decreases in value.

If the inflation rate is 2% a year, then an item that sells for $1.00 at the beginning of the year will cost $1.02 by the end of that year.
Inflation often goes unnoticed in doing what it does best: Destroying the Value of a Currency.
The Charts below are a Visualization of how, over the years, "Price Inflation" has affected everyone who lives in the United States in one way or another.
*Important Note: The prices displayed on all of these Charts are calculated with the average price paid in the United States and are not specific to any brand or region of the United States.
Income
Median Income
The first inflation chart is the average increase in the Median Income over the last 87 years.

To some, the chart above may look like progress, but before that thought crosses your mind' take a look at the following charts; they all show the 'Decline in the Purchasing Power of the United States Dollar.'

Sources:
www.census.gov
www.thepeoplehistory.com
Advisor Perspectives - dshort.com
Food
Food Price Inflation
Milk Price Chart

Source:
www.economagic.com
Food Price Inflation
Bread Price Chart
1lb. Loaf of Plain White Bread, in the United States.

Source: econmagic - U.S. city average; White bread
Food Price Inflation
Thanksgiving Dinner Chart

Source: American Farm Bureau Federation Survey
Food Price Inflation
Hershey Bar Price Chart

Source:
Shelter
Home Price Inflation
New Home Price Chart

Source:
www.thepeoplehistory.com
www.census.gov
Transportation
Transportation Price Inflation
New Car Price Chart

Sources:
www.thepeoplehistory.com
Road-Reality 2009-2010 graphic
Edmund's - Report Sheds Light on Vehicle-Shopping Trends - 2013
mlive - Average Price of New Car in 2018
Postage
Postage Price Inflation
First Class Stamp Price Chart

Source:
www.johnstonsarchive - Cost of US First Class Stamp
College Tuition
Education Price Inflation
Public College Chart

Source: National Center for Education Statistics: Table 330 - column 15
Education Price Inflation
Private College Chart

Source: National Center for Education Statistics: Table 330 - column 15
Entertainment
Sports Entertainment Price Inflation
NFL - Super Bowl Ticket Price Chart
For the first three years the Superbowl was called 'The World Championship Game,' in 1970, it was changed to 'SuperBowl.'
The chart below is the average price of a single SuperBowl Ticket.

Source:
Star Tribune - Price of a Superbowl Ticket 1967 - 2018
Sports Entertainment Price Inflation
Baseball Ticket Price Chart

Source:
StatistaEntertainment Price Inflation
Movie Price Chart

Source:
www.boxofficemojo.com
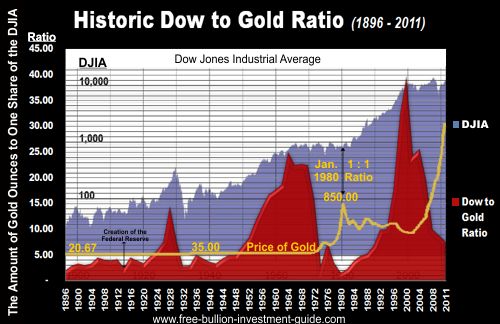
Gold Price Chart
The difference between the 'Price Inflation' charts above and the Gold Price Charts below is...
Gold and other precious metals serve as physical asset insurance that preserves the value of your savings and investments.
Gold (1833 - Present)
20 year - Interactive Gold Chart from Bullion Vault
The U.S. Dollar (1913 - 2019) :
Purchasing Power of the Consumer Dollar
 : Purchasing Power of the Consumer Dollar")
Click this link to see more on how the rate of inflation has robbed the value of money over the past 25 years.
Other pages you may like...
|
|
|


")
")

|
|
|


Price Inflation
For Bullion Market News...
Notice:
The charts, commentary, and information on the Free-Bullion-Investment-Guide.com are in no way an endorsement of how you should invest or divest.
|
Support this Guide & Paypal Thank You for Your Support |
|
|
 | |||||

Recent Articles
-
Newsletter of the Free Bullion Investment Guide - May 2026
May 05, 26 02:25 PM
 The May 2026 newsletter of the Free Bullion Investment Guide provides the latest updates, fundamental and technical gold and silver market analysis, the best articles from last month, and a list of re…
 -
Newsletter of the Free Bullion Investment Guide - April 2026
Apr 05, 26 04:44 PM
 The April 2026 newsletter of the Free Bullion Investment Guide provides the latest updates, fundamental and technical gold and silver market analysis, the best articles from last month, and a list of…
 -
Newsletter of the Free Bullion Investment Guide - March 2026
Mar 04, 26 02:08 PM
 The March 2026 newsletter of the Free Bullion Investment Guide provides the latest updates, fundamental and technical gold and silver market analysis, the best articles from last month, and a list of…
 -
Newsletter of the Free Bullion Investment Guide - February 2026
Feb 07, 26 02:12 PM
 The February 2026 newsletter of the Free Bullion Investment Guide provides the latest updates, fundamental and technical gold and silver market analysis, the best articles from last month, and a list…
 -
Newsletter of the Free Bullion Investment Guide - January 2026
Jan 07, 26 04:07 PM
 The January 2026 newsletter of the Free Bullion Investment Guide provides the latest updates, fundamental and technical gold and silver market analysis, the best articles from last month, and a list o…

18W LED Security Light (Dusk to Dawn & Motion Sensor) - $32.99
from:
 LED Lighting

) (as of March 11, 2011)")
This website is best viewed on a desktop computer.
Keep this Guide Online
& Paypal
Thank You for
Your Support
with Feedly
Search the Guide
| search engine by freefind | advanced |

Give a lasting gift of the iconic Silver Maple Leaf bullion coin [More]
Free Shipping on Orders over $100 (CDN/USA)
The Sovereign 2026 Gold Bullion Coin in Card

Britian's
Royal Mint

Daily
Newsletter
Mintages & Photos
|

|
Silver Panda |

Mintages
for
2024
Gold, Silver, & Platinum
Austrian Philharmonic Bullion Coins

|
Silver Philharmonics  |
Platinum Philharmonics

Platinum and Palladium Bullion


Mintages
for
2025
Gold & Silver Mexican Libertad
|
Gold Libertads |


Updated Mintages for
American Gold Buffalo
American Gold Eagle
American Silver Eagle


Help Us Expand our Audience by forwarding our link
www.free-bullion-investment-guide.com.
Thank You!
Last Month's

In No Particular Order
April 2026
|
All Articles were Originally Posted on the Homepage Gold Nanoparticle Cancer ResearchSona Nanotech’s Hyperthermia Platform Boosts Immunotherapy Response in Colorectal Cancer Study - Tipranks Sona Nanotech Showcases Cancer Therapy Results At Prestigious Industry Cancer Conferences - Financial Times Development of gold nanostars coated with mesoporous silica for chemo-photothermal therapy - Published Research Paper - Journal of Drug Delivery Science and Technology (Science Direct) |
All Articles were Originally Posted on the Homepage

gas prices history


SD Bullion - Customer Reviews - 4.8 stars
ExpressGoldCash - 4.9 star Customer Reviews

%20Ticket%20-%201900%20-%202019)
%20%3A%20Purchasing%20Power%20of%20the%20Consumer%20Dollar)