Homepage / Bullion Investment Ratios: Gold to Silver Ratio

ExpressGoldCash - 4.9 star - Customer Reviews
Last Updated on 01/24/2026
The Gold to Silver Ratio
Interpreting
the Gold to Silver Ratio
|
|
|
The "Gold to Silver Ratio" represents the number of silver ounces it takes to buy one ounce of gold.
The gold-to-silver ratio serves as a barometer to help you decide when to buy or sell gold and silver.
|
A high gold-to-silver ratio means that more silver ounces are needed to purchase one troy ounce of gold. This means that silver is in a buyer's market, and its prices are relatively low compared to gold prices. When the gold-to-silver ratio is low, it suggests that silver prices are high while gold is undervalued, indicating that gold is in a buyer's market as silver prices approach parity with gold. |
|
The Gold to Silver Ratio chart below (Click the Chart to Enlarge) indicates how the ratio moved between 2000 and 2025. It shows three Monthly Averages in the ratio:
It shows three Monthly Averages in the ratio:
- 2000 - 2025 = 68.96 avg. (green line)
- 1970 - 2025 = 60.24 avg. (red line)
- 1900 - 2025 = 52.16 avg (beige line)
Over the last 100 years, the gold-to-silver ratio has mostly been above the median. Common wisdom by those who follow this ratio use the following scenarios to maximize returns in silver and gold.
To maximize returns on gold or silver:
- buy silver when the ratio is 10 or more points above 60
- buy gold when the ratio is near or below the 60
What you do is completely up to you, the average line is there to be act as an aid in judgement, clearly those who bought silver when the ratio was 30 or more above 60 received the greatest return on silver.
")
Note: All the charts, commentary, and information on this page are in no way an incentive from this guide for how you should invest or divest.
Free Shipping on Orders $199+ | 5.0 star Customer Reviews
Gold and Silver Relationship
as Monetary Metals
Gold is primarily a monetary metal, only 10-15% of its market is devoted to industry, in contrast, up to 55% of silver's market is devoted to industry; however, silver's industrial market gives its price a floor, whereas, its monetary properties dictate its price movements that mimic gold.
Silver is one of the oldest forms of money; the words "silver" and "money" are the same in 14 different languages.
Monetary metals are safe havens; they bring certainty in uncertain times. They are a store of savings and wealth.
A monetary metal's primary driver for its price to move higher is uncertainty. In contrast, when there is a lot of certainty in the markets, monetary metals can, in some cases, like in the late 1990s, be worth less than the price to extract them from the ground. (Source: MINING.COM: How big miners are reliving the late 90’s bust: Steve Todoruk - Oct. 16,2014)
This proves that silver's industrial demand doesn't guide silver's price; its safehaven monetary principles do.
In a portfolio, monetary metals serve as a counterweight to what are considered riskier investments like stocks; gold and silver have no counterparty risk and will never be worth zero.
The chart (below) demonstrates that silver's price generally moves in the same direction as gold.
However, silver is more volatile than gold because the size of silver's market is much smaller than many realize.
Silver market is about $95 billion annually (source), whereas gold's market is about $5 trillion annually (source). This significant difference in market size contributes to silver's price being more volatile than gold. When large amounts of capital are added to or removed from the silver market, its prices tend to fluctuate more dramatically than those of gold.
The chart below demonstrates the relationship between silver and gold as monetary metals.

chart provided courtesy of TradingView.com

Silver's Historic Relationship
with Gold
In the late 1100s, a "Silver Rush" took place in Europe after better mining techniques opened newly discovered silver deposits.
The rush of silver in Europe allowed many countries to become more centralized, allowing them to expand their societies.

In the 16th century, the Spanish created a "Silver Standard" economy after they discovered large deposits of silver ore in Central and South America.
Like the Gold Standard, the Silver Standard played a crucial role in international trade for Spain, making their coinage the world's reserve currency for nearly four hundred years.
From the 12th century to the early 18th century, silver traded roughly at or near a 12:1 ratio with gold.
In 1717, to help England through the inflation of the time, Sir Isaac Newton, who was Master of the Royal Mint, introduced a fixed ratio between gold and silver of 15½:1.
Newton moved the Pound Sterling, the silver standard of the time, to the gold standard by setting the bi-metallic relationship between gold and silver coins in favor of gold.
This action by Newton was the first attempt in recorded history to replace the "Silver Standard" with a "Gold Standard."

In 1834, U.S. President Andrew Jackson won re-election on the platform of removing the unpopular central bank of the time, known as the Second Bank of the United States, and signed the Coinage Act of 1834 into law.
The Coinage Act put Congress back in control of the nation's money supply, as is written in the United States Constitution.
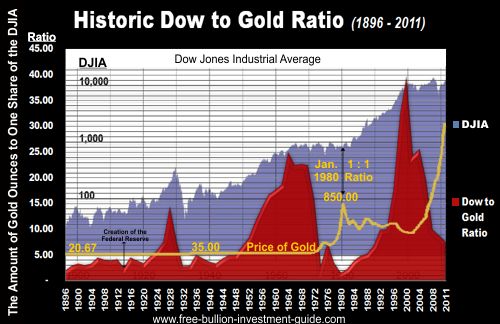
The Coinage Act of 1834 also changed the gold-to-silver ratio by half an ounce to 16:1, valuing gold at $20.67 a troy ounce.
For the next forty years, the United States economy ran on a bi-metallic system; then, in 1873, that all changed.
President Ulysses S. Grant officially ended the "Silver Standard" after he signed the Coinage Act of 1873; the new law removed silver's fixed price to gold.
The United States embraced the Gold Standard and demonetized silver; those who wanted to keep silver monetized labeled the Coinage Act of 1873 the "Crime of 1873."
Silver became a free-floating commodity, sending its ratio with gold to swing up and down, as shown in the chart below and other charts on this page.

Free Shipping on Orders $199+ | 5.0 star Customer Reviews
Note: All the charts, commentary, and information on this page are in no way an incentive from this guide for how you should invest or divest.
Other pages, on this guide, you may like....


Give a lasting gift of the iconic Silver Maple Leaf bullion coin [More] Price: C$114.95
Free Shipping on Orders over $100 (CDN/USA) |
|


BGASC - Customer Reviews - 4.8 stars
Gold to Silver Ratio
For Bullion Market News...
Notice:
The charts, commentary, and information on the Free-Bullion-Investment-Guide.com are in no way an endorsement of how you should invest or divest.
|
Support this Guide & Paypal Thank You for Your Support |
|
|
 | |||||

Recent Articles
-
Newsletter of the Free Bullion Investment Guide - May 2026
May 05, 26 02:25 PM
 The May 2026 newsletter of the Free Bullion Investment Guide provides the latest updates, fundamental and technical gold and silver market analysis, the best articles from last month, and a list of re…
 -
Newsletter of the Free Bullion Investment Guide - April 2026
Apr 05, 26 04:44 PM
 The April 2026 newsletter of the Free Bullion Investment Guide provides the latest updates, fundamental and technical gold and silver market analysis, the best articles from last month, and a list of…
 -
Newsletter of the Free Bullion Investment Guide - March 2026
Mar 04, 26 02:08 PM
 The March 2026 newsletter of the Free Bullion Investment Guide provides the latest updates, fundamental and technical gold and silver market analysis, the best articles from last month, and a list of…
 -
Newsletter of the Free Bullion Investment Guide - February 2026
Feb 07, 26 02:12 PM
 The February 2026 newsletter of the Free Bullion Investment Guide provides the latest updates, fundamental and technical gold and silver market analysis, the best articles from last month, and a list…
 -
Newsletter of the Free Bullion Investment Guide - January 2026
Jan 07, 26 04:07 PM
 The January 2026 newsletter of the Free Bullion Investment Guide provides the latest updates, fundamental and technical gold and silver market analysis, the best articles from last month, and a list o…

18W LED Security Light (Dusk to Dawn & Motion Sensor) - $32.99
from:
 LED Lighting

) (as of March 11, 2011)")
This website is best viewed on a desktop computer.
Keep this Guide Online
& Paypal
Thank You for
Your Support
with Feedly
Search the Guide
| search engine by freefind | advanced |
Give a lasting gift of the iconic Silver Maple Leaf bullion coin [More]
Free Shipping on Orders over $100 (CDN/USA)
The Sovereign 2026 Gold Bullion Coin in Card

Britian's
Royal Mint

Daily
2026 Silver Kookaburra
Photo & Mintage Update

Newsletter
Mintages & Photos
|

|
Silver Panda |

Mintages
for
2024
Gold, Silver, & Platinum
Austrian Philharmonic Bullion Coins

|
Silver Philharmonics  |
Platinum Philharmonics

Platinum and Palladium Bullion


Mintages
for
2025
Gold & Silver Mexican Libertad
|
Gold Libertads |


Updated Mintages for
American Gold Buffalo
American Gold Eagle
American Silver Eagle


Help Us Expand our Audience by forwarding our link
www.free-bullion-investment-guide.com.
Thank You!
Last Month's

In No Particular Order
April 2026
|
All Articles were Originally Posted on the Homepage Gold Nanoparticle Cancer ResearchSona Nanotech’s Hyperthermia Platform Boosts Immunotherapy Response in Colorectal Cancer Study - Tipranks Sona Nanotech Showcases Cancer Therapy Results At Prestigious Industry Cancer Conferences - Financial Times Development of gold nanostars coated with mesoporous silica for chemo-photothermal therapy - Published Research Paper - Journal of Drug Delivery Science and Technology (Science Direct) |
All Articles were Originally Posted on the Homepage