Homepage / Precious Metals Charts: Gold Price Charts
Gold Price Charts
Gold Price Charts (per troy ounce)
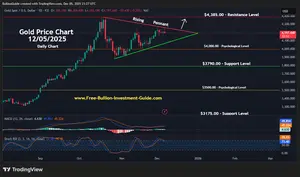
1) Gold Spot Price - Candlestick Interactive Chart
2) Gold Spot Price - Foreign Currency Charts
3) Gold Spot Price - 20-year (High, Low, Close) Interactive Price Chart
4) Gold Technical Analysis - 3 Gauges (Summary, Oscillator, Moving Averages)
Note: All the charts and gauges on this page are measurements of the market for each asset; they are in no way an endorsement of how you should invest or divest.

ExpressGoldCash - 4.9 star - Customer Reviews
Gold Spot Price Chart
- Candlestick -
Gold Price Chart - Interactive Candlestick Chart.
On this chart, you can do your own Technical Analysis by selecting one of the buttons located above and on the left side of the chart.
If you wish to change the Investment Asset, "Click" your Mouse over the Symbol Name "XAUUSD" and click the "÷" to find Investment asset chart you want.
Choose "CFD" heading for a different commodity (ie: copper, oil, silver)
Interactive Charts
Return to the Top of the Page

BGASC - Customer Reviews - 4.8 stars
Gold Spot Price - Daily Charts
- Foreign Currency -
Gold Price
Euro €
Gold Price
Canadian $
Gold Price
Chinese Yuan
Gold Price
Australian $
Gold Price
UK £
Gold Price
Japan ¥
Gold Price
Indian Rupee
Gold Price
Swiss Franc
Gold Price
S. African Rand
Return to the Top of the Page

Gold 20-year
Spot Price Chart
(High, Low, Close)
Technical Analysis Gauges
Note: All the charts and gauges on this page are measurements of the market for each asset; they are in no way an endorsement of how you should invest or divest.
ExpressGoldCash - 4.9 star - Customer Reviews
Precious Metals Price Charts
Other pages you may like...
|
|
|


|
|
|


For Bullion Market News...
Notice:
The charts, commentary, and information on the Free-Bullion-Investment-Guide.com are in no way an endorsement of how you should invest or divest.
|
Support this Guide & Paypal Thank You for Your Support |
|
|
 | |||||

Recent Articles
-
Newsletter of the Free Bullion Investment Guide - April 2026
Apr 05, 26 04:44 PM
 The April 2026 newsletter of the Free Bullion Investment Guide provides the latest updates, fundamental and technical gold and silver market analysis, the best articles from last month, and a list of…
 -
Newsletter of the Free Bullion Investment Guide - February 2026
Feb 07, 26 02:12 PM
 The February 2026 newsletter of the Free Bullion Investment Guide provides the latest updates, fundamental and technical gold and silver market analysis, the best articles from last month, and a list…
 -
Newsletter of the Free Bullion Investment Guide - January 2026
Jan 07, 26 04:07 PM
 The January 2026 newsletter of the Free Bullion Investment Guide provides the latest updates, fundamental and technical gold and silver market analysis, the best articles from last month, and a list o…
 -
Newsletter of the Free Bullion Investment Guide - December 2025
Dec 07, 25 04:35 PM
 The December 2025 newsletter of the Free Bullion Investment Guide provides the latest updates, fundamental and technical gold and silver market analysis, the best articles from last month, and a list…
 -
Newsletter of the Free Bullion Investment Guide - November 2025
Nov 08, 25 01:58 PM
 The November 2025 newsletter of the Free Bullion Investment Guide provides the latest updates, fundamental and technical gold and silver market analysis, the best articles from last month, and a list…

18W LED Security Light (Dusk to Dawn & Motion Sensor) - $32.99
from:
 LED Lighting

) (as of March 11, 2011)")
This website is best viewed on a desktop computer.
Keep this Guide Online
& Paypal
Thank You for
Your Support
with Feedly
Search the Guide
| search engine by freefind | advanced |

Give a lasting gift of the iconic Silver Maple Leaf bullion coin [More]
Free Shipping on Orders over $100 (CDN/USA)
The Sovereign 2026 Gold Bullion Coin in Card

Britian's
Royal Mint

Daily
Newsletter
Platinum and Palladium Bullion


Mintages
for
2025
Gold & Silver Mexican Libertad
|
Gold Libertads |


Updated Mintages for
American Gold Buffalo
American Gold Eagle
American Silver Eagle
2024 & 2025
Jerusalem of Gold Bullion
Coin photos
(bottom of page)
 Obverse side")
 Obverse side")
Chinese Gold Coin Group Co.
& Chinese Bullion


Help Us Expand our Audience by forwarding our link
www.free-bullion-investment-guide.com.
Thank You!
Last Month's

In No Particular Order
March 2026
|
US Dollar Demand Soars: Dedollarization Was a Fabrication of the Bull Market - Daniel Lacalle Video: (04:51) WisdomTree CEO Is Going All In on Gold - Jonathan Steinberg, founder and CEO of WisdomTree, tells Barron’s Andy Serwer how gold and metals can be a strong alternative to the dollar and Bitcoin - BARRON'S Are Central Banks Selling Gold? - Gold holdings of Turkey's central bank are down a lot, but Turkey is an outlier in EM - Robin J. Brooks (Substack) Advisors want to bask in gold's warm glow, says Jan van Eck - Investment News (.pdf) Report: Powertrain shifts spark PGM optimism - Metals Focus American Gold Rushes: North Carolina (1799–1849) vs. California (1848–1898) - America’s resource extraction history hinges on two gold rushes with practically paradoxical origins - MINING VISUALS If The World Is On Fire, Why Is Gold Getting Cheaper? - Trefis Banks seize on precious metals trading boom - International Finance Review (IFR) Video Short: FINDING FAKE GOLD BULLION (HAVE YOUR BULLION CHECKED) - Happy Jewelers (YouTube) Gold Update : When the Dollar Wears the Crown Even Gold Steps Aside - The explanation is not that gold has lost its appeal. It simply means the market is still hoarding cash before deciding how to protect purchasing power - The Dark Side of the Boom Report: Beyond “Dr. Copper”: Copper’s Strategic Shift - Sprott What is the IRS loophole for gold? - The IRS loophole could help you save substantially on the taxes tied to your gold assets - CBS News (msn) Bargain Collector: Five-Ounce Silver Quarters, Really? - Numismatic News Report: Silver: The Forgotten Metal That Built Civilizations — 5,000 Years & The $100+ Reckoning - From Mesopotamian shekels to the $100+ supercycle: the complete, unvarnished story of the most undervalued metal on Earth - Capital Street FX Platinum is back. So why are its miners shunning growth? - mining_mx Gold CFDs Vs Silver CFDs (Contract for Difference): Which Metal Is Safer For A Small Account Scalper? - EBC Financial Group (.pdf) Charts: India Monthly Chartbook - March 2026 - Metals Focus More PGM potential for South Africa as Palladium Center returns with major new insight - MINING WEEKLY Item of the Week: Low Mintage Makes 1928 Peace Dollar a Tough Find - With a mintage under 400,000, the 1928 Peace dollar stands as the series’ lowest-production issue—though its true scarcity comes with the complexities of silver dollar history. - Numismatic News RANKED: Top 10 gold mining companies of 2025 - MINING.COM Info~Graphic: Mapped: Top Marginal Income Tax Rates by State in 2026 - Visual Capitalist |
|
All Articles were Originally Posted on the Homepage Gold Nanoparticle Cancer ResearchThe Role of Gold in Technology: 5 High-Tech Uses - Securities.io Synthesis Strategies, Therapeutic Roles, and Clinical Progress of Gold Nanoparticles in Biomedical Engineering - Nano Select Optimizing gold nanoparticles for better medical imaging, drug delivery, and cancer therapy - PHYS.org (msn) One-hour saliva test spots biomarker linked to several cancers - Medical Express (msn) Korean researchers unveil rapid diagnostic test for pancreatic cancer - Korea Joongang Daily |
All Articles were Originally Posted on the Homepage
