ExpressGoldCash - 4.9 star - Customer Reviews
A Positive Sign has Formed in Silver and Gold’s Charts
Despite the Unknown
Review and Outlook for Silver, Gold and the U.S. Dollar
Originally Posted on 12/04/2017 @ 6:29 pm
by Steven Warrenfeltz
Subscribe to this Blog
Hello,
Thank you for visiting the Free-Bullion-Investment-Guide's latest blog post, before we get to the precious metals review and outlook, below are some of last week's Best Bullion Market-Related News articles that were taken from this guide's home page.

CHARTS: A Look at NYSE Margin Debt and the Market - Advisor Perspectives
2018 1oz Australian Lunar bullion coins sold out - The Perth Mint Blog
The Growth of Income Inequality in America - Viable Opposition
BRICS countries mulling formation of single gold trade system - TASS
Salvator Fraudium's Bubble in Everything - Bullion Vault
VIDEO: Ray Dalio On Gold: Buffett Is Making A Big Mistake (September 2012) - Value Walk
Best of the Week for Gold NanoParticle Cancer Research
Gold Nanoparticle Cancer Research News - #3
- The Latest News on Gold Nanoparticle Cancer Research, this issue includes how GNPs are Helping Chemo and Radiation Therapy Work Better, and New Innovations in the Early Detection of Cancer using GNPs
Photo above provided courtesy of Ksenia Kudelkina at unsplash.com
Despite all the unknowns that are ahead for gold and silver a positive sign (or pattern) has formed in their charts, what that pattern is, is shown to you below this brief introduction.
But, the unknown in gold and silver's future could be any of the following:
- The Federal Reserve - The Federal Reserve is expected to raise interest rates on December 13th by another quarter of a percent (0.25). Many in the market believe that this expected rate hike has already been priced into the metals, but maybe it isn't.
- The Tax Cut bill passing before the end of the year. The market expects the cuts to hurt the precious metals because of the economic boom that is expected to come with them. But if there aren't big spending cuts in the bill, gold and silver shouldn't be hurt much at all by the tax cuts.
- North Korea - Nobody really knows what the dictator of that country will do. But as long as he continues to play a fools game, the markets will look to gold and silver as a safe haven.
Other political and market issues could also affect the precious metals markets in the near future, but the outlook on many of these issues are foggy, at best. So time will be the ultimate judge as to how the markets move as we pass through the unknown.
Review & Outlook
|
All the charts on this blog are Daily Charts unless noted otherwise.
US DOLLAR
In Review
Two weeks ago, I wrote the following about the U.S. Dollar and posted the chart below.
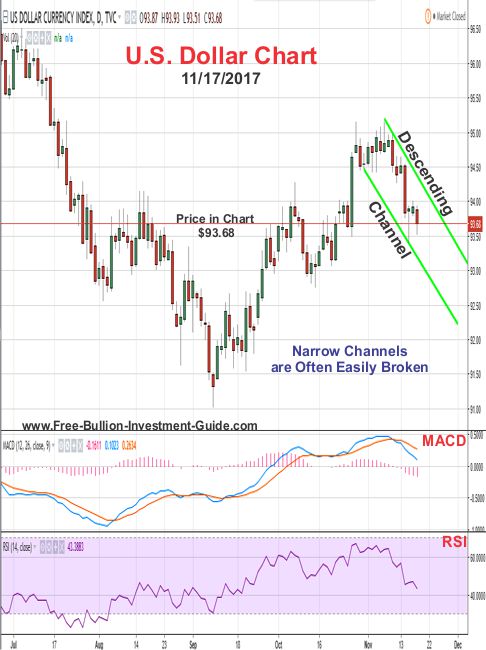
A new pattern has been recognized in the Dollar's price chart, a Descending Channel.
The descending channel that the dollar is trading in is very narrow and will undoubtedly be broken sometime in the near future.
However, in the week to come, the Dollar's MACD (lower indicator) looks like it is signaling a fall in the dollar's price.
But, one way to read the MACD is that the greater the separation between the MACD's signal lines the greater a price change is in the future.
So we may see the channel break (edit) to the upside this week, however, the dollar's RSI is moving in a neutral zone, so the price may just bounce around inside the descending channel this week. Time will tell.
In Review - continued
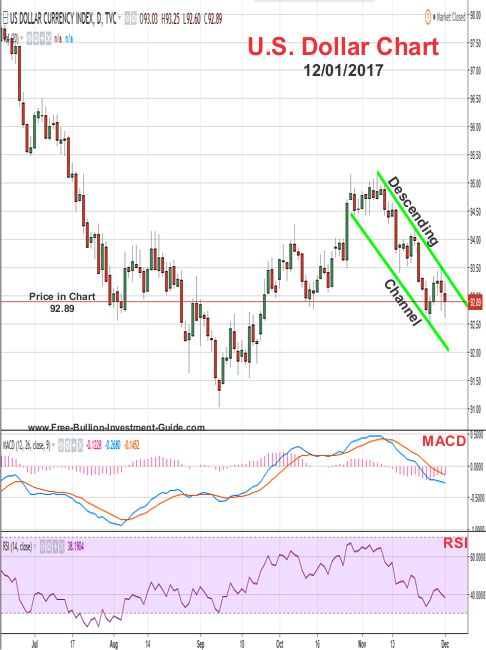
As you can see in the chart below, the U.S. Dollar did not break the Descending Channel, instead, it fell in price and bounced around inside the channel.
U.S. Dollar - This Week's Outlook
For the week to come, it's hard to say what the U.S. Dollar will do as long as it continues to trade inside the 'Descending Channel.'
However, it is giving the indication that it may be done with falling in price, at least in the near term.
I'm stating this because the Dollar's MACD's bar chart has already started to change directions and its signal lines are also starting to come closer together indicating a possible positive change in direction.
But, the U.S. Dollar's RSI and the Candlestick Price Chart are giving mixed signals.
So the Dollar looks to be playing a time game, it could change directions this week and break the upper falling trend-line of the channel or it could continue to trade inside it, time will tell.
Charts provided courtesy of TradingView.com
U.S. Dollar's Price Resistance and Support Levels
U.S. Dollar's Resistance Levels
$94.00
$93.50
U.S. Dollar's Support Levels
$92.00
$91.00
SILVER
In Review
Below is silver's commentary and chart outlook from 2 weeks ago.
 Palladium's Broad Ascending Channel
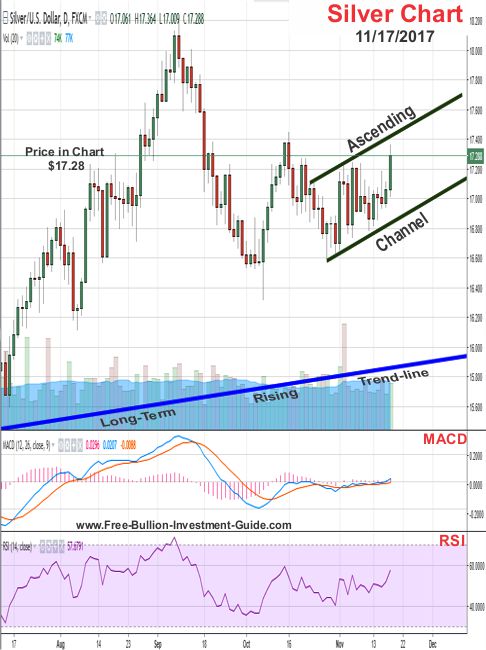
In silver's outlook chart below, like the dollar, it has formed a channel, but in silver's case, it has formed an Ascending Channel.
Silver's channel is a bit broader than the dollar's channel, but it is still narrow.
Typically, a broader channel offers more insight into what you can expect in an assets future price.
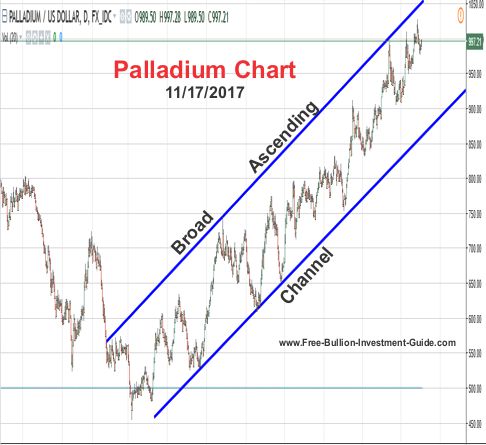
For instance, Palladium (right) has been trading inside a broad ascending channel since December of 2015.
As for the week to come, silver's MACD and RSI (lower indicators) are offering very little insight into which direction silver will move, so silver is expected to simply trade inside the channel this week.
Or silver may break the channel if fundamentals move the precious metals, narrow channels are very hard to judge and the current events in the news seem to be in limbo, so we'll just have to wait on time to see which way it will move.
In Review - continued
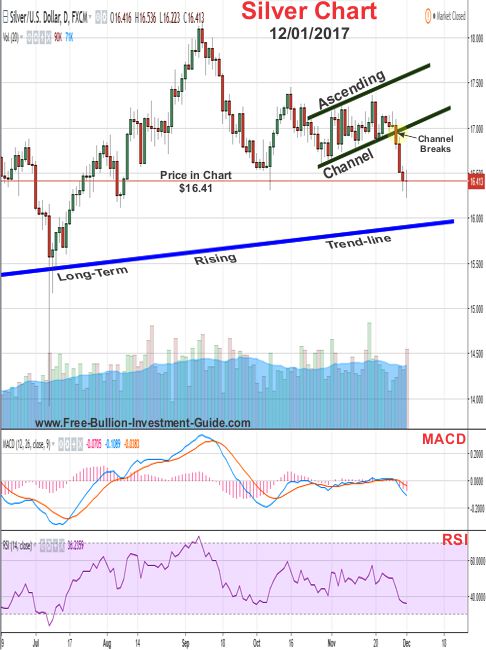
In the review chart below, you can see that silver moved a little in the channel then it fell through it early last week.
As I mentioned above, it usually very hard to judge which way an asset will move when it's inside a narrow channel.
Silver - This Week's Outlook
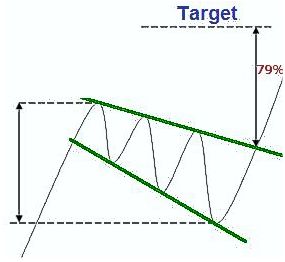
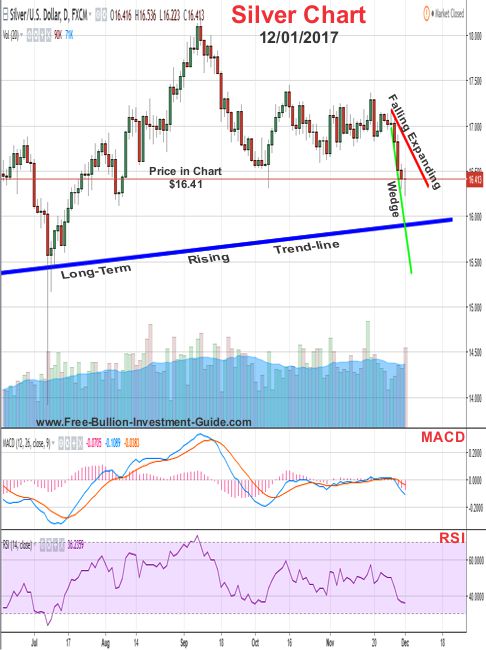
For silver's outlook, its chart has formed a steep Falling Expanding Wedge.
Because of the pattern's steepness, the price of silver could have a little further to fall, but its lower indicators are showing that the fall could be coming to an end.
Charts provided courtesy of TradingView.com
Silver's Price Resistance &
Support Levels
Silver's Resistance Levels
$17.00
$16.80
Silver's Support Levels
$16.30
$16.10
GOLD
In Review
Below is the gold outlook from two weeks ago.
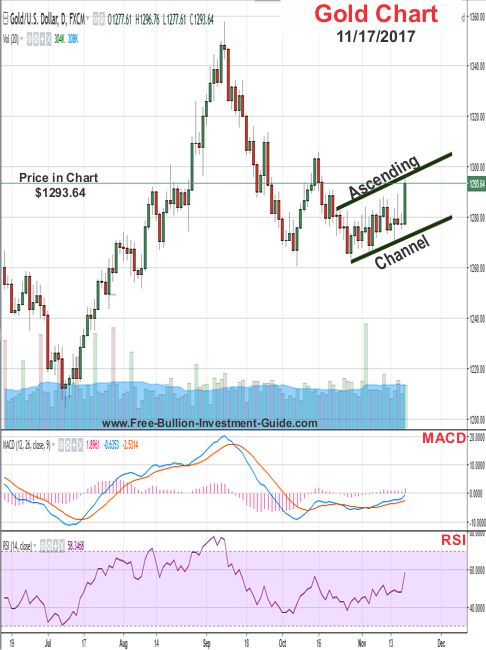
For the week to come, like silver, an ascending channel was also found in gold's chart.
Gold's channel is narrower than the one found on silver's chart, so its a little more fragile and is expected to break in one direction or the other sometime in the near future.
But as for now, there is no overwhelming signal as to which direction the price of gold will move, so time will tell what it does.
In Review - continued
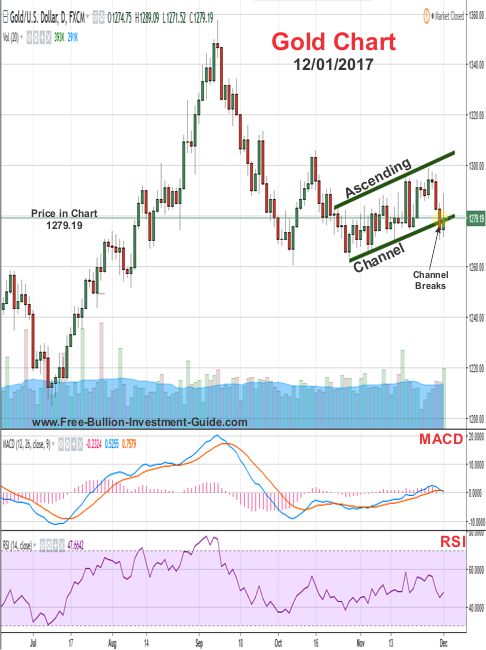
From what was written two weeks ago, almost the complete opposite happened.
Gold traded inside its narrow channel, but it wasn't more fragile than silver's channel, in fact, it was much more stable, and by looking at the chart below you can see that gold didn't break its channel till late last week.
Gold - This Week's Outlook
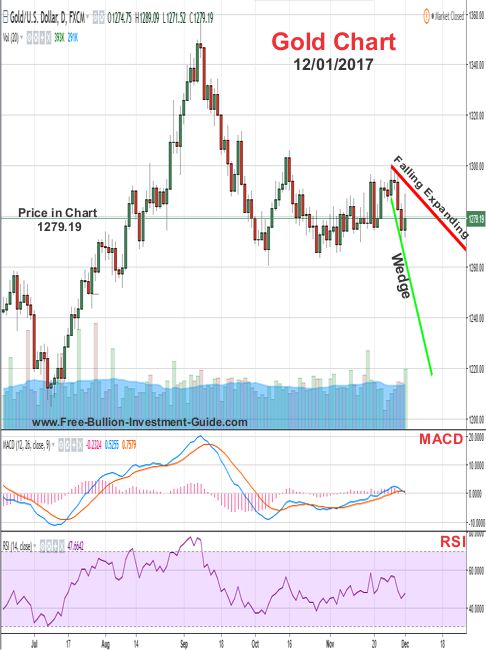
In the chart below, gold, like silver, has created a positive pattern known as a 'Falling Expanding Wedge.'
For the week to come, gold's MACD and RSI are moving in neutral zones, so there giving almost no indication as to which way gold will move, and because of the broadness of gold's 'Falling Expanding Wedge' it could literally move up or down this week.
However, the pattern is a positive sign in gold's chart, and it is expected to break the pattern sometime in the near future.
Charts provided courtesy of TradingView.com
Gold's Price Resistance and
Support Levels
Gold's Resistance Levels
$1310.00
$1300.00
Gold's Support Levels
$1260.00
$1250.00
Thank You for Your Time.
Have a Great Week and God Bless,
Steve
'Click Here' see all of the prior Blog posts,
Thank You for Your Time!
|
Investment/Information Disclaimer: All content provided by the Free-Bullion-Investment-Guide.com is for informational purposes only. The comments on this blog should not be construed in any manner whatsoever as recommendations to buy or sell any asset(s) or any other financial instrument at any time. The Free-Bullion-Investment-Guide.com is not liable for any losses, injuries, or damages from the display or use of this information. These terms and conditions of use are subject to change at anytime and without notice. |
|
Support this Guide & Paypal Thank You for Your Support |
|
|
 | |||||
This website is best viewed on a desktop computer.
Keep this Guide Online
& Paypal
Thank You for
Your Support
with Feedly
Search the Guide
| search engine by freefind | advanced |
Premium Canadian Bullion
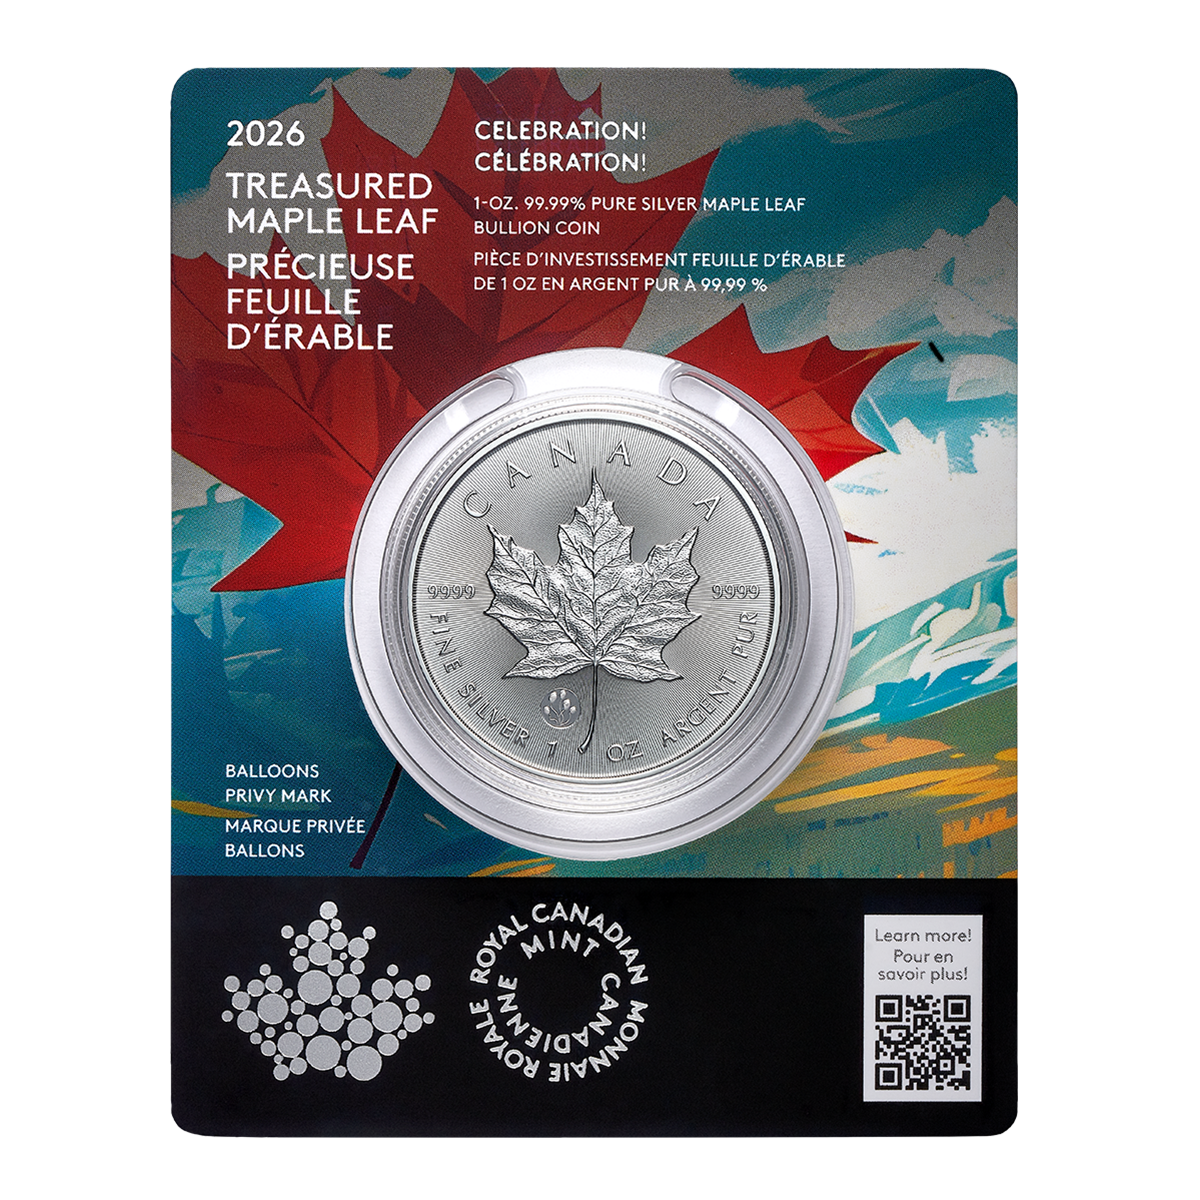
Give a lasting gift of the iconic Silver Maple Leaf bullion coin [More]
Free Shipping on Orders over $100 (CDN/USA)
or
From the U.K. Royal Mint


Daily
Newsletter
Updated Mintages for
American Gold Buffalo
American Gold Eagle
American Silver Eagle
2024 & 2025
Jerusalem of Gold Bullion
Coin photos
(bottom of page)
Mintages
for
2024
Gold & Silver Mexican Libertad
|
Gold Libertads |
Chinese Gold Coin Group Co.
& Chinese Bullion
Help Us Expand our Audience by forwarding our link
www.free-bullion-investment-guide.com.
Thank You!
Last Month's

In No Particular Order
January 2026
All Articles were Originally Posted on the Homepage
