Free Shipping on Orders $199+
Gold,
Silver, and the U.S. Dollar
Review & Outlook
for the Rest of 2016
Originally Posted on 12/19/2016 @4:29am
I hope you have been well since the last blog post, before I move on I wanted to Thank you for every visit you have made to this website and I hope you will continue to come back in the future.
I also wanted to let you know that the next two weekends 12/25/2016 & 01/01/2017, I do Not intend to be making any new blog posts.
The next intended post will be on (01/08/2017) – the best way to know when a new blog entry has been posted is to subscribe to the RSS feed here: or in the upper left of this website.
Gold & Silver - Bull or Bear
In the minds of many market traders, Gold and Silver are still in a bear market, however, as long as Gold and Silver finish 2016 above their lows for the year, it will be a positive signal for the future of the precious metals in the market’s psyche.

Gold’s 2016 low was $1060.50, and Silver’s was $13.72, both lows were made in January of 2016, so far it looks like they should stay above this level, in addition, the end of the year trade should have light volume.
Although, Gold and Silver may come close to these levels as traders sell their losing assets to offset their Capital Gain taxes for the year.
Time will tell if the bull or bear market will rule for gold and silver in 2016.
GOLD
Last week, gold continued to drop as the stock market continued to rise. Also, the Federal Reserve raised interest rates which didn’t help gold.
But as many of you know, who have read the posts from this guide, the markets have based this stock rally on Trump’s rhetoric and their expectations of what will come from that rhetoric; not on actions.
This is why this rally will fall apart next year or sooner; this is explained at length in the Trump’s QE post.
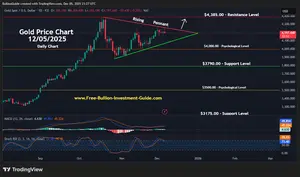
In the chart below, Gold’s ‘falling expanding wedge’ continues to grow wider, and its MACD and RSI (bottom indicators) continue to trade on the floor. All of these signals are bullish for the precious metal.
I also point out in gold’s chart, the absolute last rising trend-line that could be drawn from gold’s bottom price which happened late in 2015; there is one in silver’s chart too.
To be honest, the rising trend-line in gold’s chart is weaker than the one in silver's chart (below), my point being that gold’s rising trend-line was drawn using its chart’s highs and lows or shadows, and silver’s rising trend-line was drawn using its chart’s closes and openings.
These are all positives signs for gold in early 2017, but, it needs to stay above the year’s low of $1060.50 to end the year on a positive note.

Charts provided courtesy of TradingView.com
Gold's Price Resistance &
Support Levels
Gold's Resistance Level
$1225.00
$1200.00
$1180.00
Gold's Support Levels
$1120.00
$1100.00
$1060.50
SILVER
Last week, silver continued to trade inside its falling expanding wedge.
The same reasons for gold’s fall in price can be blamed for silver’s fall in price which were caused by the Fed’s hiking interest rates, and the stock markets continued euphoric rise.
In the chart below, I’ve indicated Silver's rising trend-line and its 2016 low of $13.72, which it will need to stay above to have a positive year and to give the indication that silver’s bear market has been broken.

Charts provided courtesy of TradingView.com
Silver's Price Resistance and
Support Levels
Silver's Resistance Level
$17.10
$16.85
$16.45
Silver's Support Level
$15.85
$15.65
$15.15
US DOLLAR
The biggest reason the U.S. Dollar was up for the week is the same reason gold and silver was down; the Federal Reserve raised Interest Rates.
(continued…)

Charts provided courtesy of TradingView.com
Usually, a rising dollar hurts the stock market because a large portion of the U.S. economy is based on selling goods abroad and when the dollar is up, it makes our exports more expensive in foreign markets; this is another reason why the stock market’s euphoric rise is overblown.
In the chart above, the U.S. dollar has broken above the rising expanding wedge, which isn’t a good sign, as seen in the chart below from the Pattern Gallery.

There is also a possible head and shoulders top forming in the U.S. Dollar’s MACD & RSI (bottom indicators), however, they haven’t fully developed yet, so we’ll just have to let time show how it plays out.
U.S. Dollar's Price Resistance and Support Levels
U.S. Dollar's Resistance Level
$103.50
U.S. Dollar's Support Level
$101.00
$100.20
$99.75
Music
This week I couldn’t get away from Christmas music, then I heard the Christmas version of Pachelbel's Canon in D, so I posted the Non-Christmas, original version because it works well for Christmas & New Years.
I hope you have a Merry Christmas & Happy New Year!
Stay Safe,
Steve
Thank You for Visiting the Free Bullion Investment Guide
This
Guide Gives a Portion of Every Sale to St. Jude Children's Research
Hospital, Please Help Us Give to those who are Battling Cancer
by Supporting our Affiliates
(Every Advertisement on the Guide is from one of our Affiliates)
'Click Here' see all of the prior Blog posts,
Thank You for Your Time!
|
Support this Guide & Paypal Thank You for Your Support |
|
|
 | |||||

Recent Articles
-
Newsletter of the Free Bullion Investment Guide - February 2026
Feb 07, 26 04:05 PM
 The February 2026 newsletter of the Free Bullion Investment Guide provides the latest updates, fundamental and technical gold and silver market analysis, the best articles from last month, and a list…
 -
Newsletter of the Free Bullion Investment Guide - December 2025
Dec 07, 25 02:24 PM
 The December 2025 newsletter of the Free Bullion Investment Guide provides the latest updates, fundamental and technical gold and silver market analysis, the best articles from last month, and a list…
 -
Newsletter of the Free Bullion Investment Guide - November 2025
Nov 08, 25 01:52 PM
 The November 2025 newsletter of the Free Bullion Investment Guide provides the latest updates, fundamental and technical gold and silver market analysis, the best articles from last month, and a list…
 -
Premium Bullion - 1 oz Silver Majestic Polar Bear Coin
May 18, 25 04:17 PM
 The Premium Bullion - 1oz Silver Majestic Polar Bear coins are specially made for collectors and investors alike; they are made of 99.99% pure silver and have a limited mintage; it is in an assay card…
 -
Latest Update (3/14/25) from the Free Bullion Investment Guide
Mar 14, 25 11:23 PM
Free Bullion Investment Guide's Latest Updates: Mexican Gold and Silver Libertad - 2024 Mintage Figures & more...

18W LED Security Light (Dusk to Dawn & Motion Sensor) - $32.99
from:
 LED Lighting


This website is best viewed on a desktop computer.
Keep this Guide Online
& Paypal
Thank You for
Your Support
with Feedly
Search the Guide
| search engine by freefind | advanced |
Premium Canadian Bullion

Give a lasting gift of the iconic Silver Maple Leaf bullion coin [More]
Free Shipping on Orders over $100 (CDN/USA)
or
From the U.K. Royal Mint


Daily
Newsletter
Updated Mintages for
American Gold Buffalo
American Gold Eagle
American Silver Eagle

2024 & 2025
Jerusalem of Gold Bullion
Coin photos
(bottom of page)
 Obverse side")
 Obverse side")
Mintages
for
2024
Gold & Silver Mexican Libertad
|
Gold Libertads |


Chinese Gold Coin Group Co.
& Chinese Bullion


Help Us Expand our Audience by forwarding our link
www.free-bullion-investment-guide.com.
Thank You!
Last Month's

In No Particular Order
January 2026
All Articles were Originally Posted on the Homepage