Silver and Gold's,
Ups and Downs
Review and Outlook for the U.S. Dollar, Silver, and Gold
Originally Posted on 6/17/2018 @ 5:03 pm EDT
by Steven Warrenfeltz
Subscribe to this Blog

Hello,
Thank you for visiting the Free-Bullion-Investment-Guide, every visit you make is greatly appreciated.
Before we get to this Review & Outlook, below are some of the Best Bullion Market-Related News articles that were taken from this guide's home page, over the last few weeks.

Info-Graphic: Visualizing the Longest Bull Markets of the Modern Era - Visual Capitalist
The History And Rising Power of Central Banks - The Gold Telegraph
Inflation: An X-Ray View of the Components - Advisor Perspectives
VIDEO: Fed Chair Jerome Powell Holds Press Conference - June 13, 2018 - CNBC
Texas Gold Investors Just Got Their Own Fort Knox - Forbes
Best of the Week for
Gold NanoParticle Cancer Research
Destroying Tumors with Gold Nanoparticles - The Conversation
Russian Scientists Develop Express Test to Identify Cancer - Sputnik News

Review & Outlook
|
All the charts on this blog are Daily Charts unless noted otherwise.
US DOLLAR
In Review
Last week, the following outlook was posted for the U.S. Dollar.
In the U.S. Dollar's outlook chart below, you can see that there are now two wedges identified.
First, the large negative 'Rising Expanding Wedge' has been in its trading chart for more than a month, and now there's a smaller positive 'Falling Expanding Wedge' that has been identified.
For the U.S. Dollar's Outlook, both wedges are very close to being confirmed, as to which one will be confirmed first, is a 'toss-up.'
Why?
Well, first off, if the summit between President Trump and North Korea's leader Kim Jong Un goes well on June 12th, then this should help push up the dollar, breaking the positive 'Falling Expanding Wedge' first.
However, if it doesn't go well, then we'll most likely see the dollar fall, breaking the negative 'Rising Expanding Wedge' first.
A lot is riding on this summit, but beyond that, the Federal Reserve meets on June 12-13th, and because of the jobs report, the FOMC is expected to raise rates another .25% this week, which will also be a negative on the dollar.
So, the outcomes of these factors will mostly dictate how the U.S. Dollar moves; meaning, the technical patterns exist, but, fundamentals are having more influence over the dollar's price moves.

U.S. Dollar - In Review - continued
In the 1st review chart below, you can see that the positive 'Falling Expanding Wedge' pattern was confirmed as it seemed that the summit with North Korea went well.
The U.S. Dollar didn't go up much until later in the week, but its initial move up, in the early part of last week, was enough to help it break the wedge.
Review Chart #1


U.S. Dollar - In Review - continued
In the 2nd review chart below, you can see that the negative 'Rising Expanding Wedge' is still intact.
The price of the U.S. Dollar slightly dipped below the bottom trend-line of the wedge, but because the price did not close or open a 'day of trading' below the line, the pattern not been broken, yet.
Review Chart #2

U.S. Dollar - Outlook
In the U.S. Dollar's outlook chart below, the long-standing 'Rising Expanding Wedge' is the only pattern that I've been able to identify.
As to when the pattern will be confirmed just isn't known right now and can't be predicted.
The 'Trade War' does seem to be heating up, but right now those headlines seem to be helping the dollar, not hurting it.
It's doubtful that, that outcome will last very long, but time will tell how long it will be until the 'Trade War' starts to hurt the dollar.
As for the U.S. Dollar's outlook, it looks like its price will consolidate this week after it shot up in price on Thursday, plus, the $95.00 price level looks to be holding the dollar's price down below it.
The 'Rising Expanding Wedge' is still expected to be broken, it just a matter of time before it does.

Charts provided courtesy of TradingView.com
U.S. Dollar's Price Resistance and Support Levels
U.S. Dollar's Resistance Levels
$95.00
U.S. Dollar's Support Levels
$93.00
$92.00
$91.00
SILVER
In Review
Last week, the following outlook was posted for Silver.
In silver's outlook chart below, you can see that two patterns have been identified in silver's charts.
First off, even though the 'Falling Wedge' was confirmed last week, it is still relevant because it can still be drawn in the silver chart.
However, it looks like the price of silver is peaking, for now, so we may see silver fall in the early part of this week, at least until the FOMC meeting, and in doing so it may break and confirm the new negative 'Rising Wedge' that was is now in its chart.
But, as always, time will tell what happens.

Silver - In Review - continued
In the first review chart below, you can see that my statement in last week's outlook was incorrect for the price of silver:
" it looks like the price of silver is peaking"
The price of silver wasn't peaking, so it didn't fall in price, instead, it rose and confirmed the 'Falling Wedge' in last week's outlook.
Review Chart #1

Silver - In Review - continued
Furthermore, in Silver's 2nd review chart below, you can see that because its price hadn't peaked, yet, it broke through the top trend-line of the negative 'Rising Wedge' pattern, denying its expected outcome.
Review Chart #2

Silver - Outlook
In silver's outlook chart below, the precious metal's chart has formed negative 'Rising Expanding Wedge' pattern.
Just by looking at the chart below you can see that silver's price has had its share of 'ups and downs,' gold's chart doesn't look too much different.
This year, the price of silver (and gold) have often given silver investor's a sliver of hope by slowly climbing in price, then have those hopes dashed when the price drops like a stone, in a day or more.
Fact is, silver hasn't moved much overall in price, it's mostly moved sideways in 2018.
Silver may break below the 'rising expanding wedge' this week, but its likely to do it in another short downward movement, much like its other recent downward movements.

Charts provided courtesy of TradingView.com
Silver's Price Resistance &
Support Levels
Silver's Resistance Levels
$17.50
$17.00
Silver's Support Levels
$16.40
$16.00

GOLD
In Review
Last week, the following chart and commentary was posted for gold's outlook.
As you can see in gold's outlook chart below, it looks as the title says 'Same Pattern, Different Week.'
The positive 'Falling Wedge' can still be drawn, so its still relevant, plus the Bull Flag is still in gold's chart, but at the time being it's nowhere near being confirmed.
For the week to come, it depends on how well the Summit between President Trump and Kim Jong Un goes and on how the FOMC votes this week on interest rates will have a great influence on how gold moves.
Like the U.S. dollar, fundamentals outweigh technical analysis this week, time will tell what happens.

In Review - continued
In Gold's review chart below, you can see that good vibes that came out of the gold summit helped gold in its sideways movement in the early part of last week.
Then the FOMC's quarter of a percent (.25%) helped gold break above the 'Falling Wedge' confirming it.
The fall helped gold's price stay above the bottom trend-line of the 'Bull Flag,' but, you'll see in gold's outlook chart below, it is waning.

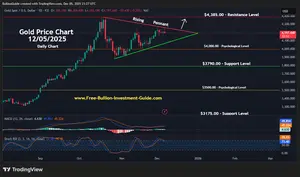
Gold - Outlook
In gold's outlook chart below, I've put the 'Bull Flag' in dotted lines because the pattern looks like it may be on its last leg, but it can be drawn, so it's still relevant.
Plus, I've studied the gold chart long enough and moved the trend-lines to show another Large Positive pattern is lurking behind the 'Bull Flag,' if it is denied, but I'll address that depending on how gold moves in the future.
For now, gold's outlook chart is showing another positive 'Falling Wedge' pattern, as to how soon this one will be broken is anyone's guess.
Perhaps, if the speculators in gold's market buyback, this week, the long positions they sold off on Friday, we'll see the 'Falling Wedge' confirmed sooner, rather than later.
Time will tell.

Charts provided courtesy of TradingView.com
Gold's Price Resistance and
Support Levels
Gold's Resistance Levels
$1310.00
$1300.00
Gold's Support Levels
$1280.00
$1240.00
Thank You for Your Time.
Have a Great Week and God Bless,
Steve
'Click Here' see all of the prior Blog posts,
Thank You for Your Time!
|
Investment/Information Disclaimer: All content provided by the Free-Bullion-Investment-Guide.com is for informational purposes only. The comments on this blog should not be construed in any manner whatsoever as recommendations to buy or sell any asset(s) or any other financial instrument at any time. The Free-Bullion-Investment-Guide.com is not liable for any losses, injuries, or damages from the display or use of this information. These terms and conditions of use are subject to change at anytime and without notice. |
Return from this Guide's Latest Blog Post
|
Support this Guide & Paypal Thank You for Your Support |
|
|
 | |||||

Recent Articles
-
Newsletter of the Free Bullion Investment Guide - April 2026
Apr 05, 26 04:44 PM
 The April 2026 newsletter of the Free Bullion Investment Guide provides the latest updates, fundamental and technical gold and silver market analysis, the best articles from last month, and a list of…
 -
Newsletter of the Free Bullion Investment Guide - February 2026
Feb 07, 26 02:12 PM
 The February 2026 newsletter of the Free Bullion Investment Guide provides the latest updates, fundamental and technical gold and silver market analysis, the best articles from last month, and a list…
 -
Newsletter of the Free Bullion Investment Guide - January 2026
Jan 07, 26 04:07 PM
 The January 2026 newsletter of the Free Bullion Investment Guide provides the latest updates, fundamental and technical gold and silver market analysis, the best articles from last month, and a list o…
 -
Newsletter of the Free Bullion Investment Guide - December 2025
Dec 07, 25 04:35 PM
 The December 2025 newsletter of the Free Bullion Investment Guide provides the latest updates, fundamental and technical gold and silver market analysis, the best articles from last month, and a list…
 -
Newsletter of the Free Bullion Investment Guide - November 2025
Nov 08, 25 01:58 PM
 The November 2025 newsletter of the Free Bullion Investment Guide provides the latest updates, fundamental and technical gold and silver market analysis, the best articles from last month, and a list…

18W LED Security Light (Dusk to Dawn & Motion Sensor) - $32.99
from:
 LED Lighting

) (as of March 11, 2011)")
This website is best viewed on a desktop computer.
Keep this Guide Online
& Paypal
Thank You for
Your Support
with Feedly
Search the Guide
| search engine by freefind | advanced |

Give a lasting gift of the iconic Silver Maple Leaf bullion coin [More]
Free Shipping on Orders over $100 (CDN/USA)
The Sovereign 2026 Gold Bullion Coin in Card

Britian's
Royal Mint

Daily
Newsletter
Mintages & Photos
|

|
Silver Panda |

Mintages
for
2024
Gold, Silver, & Platinum
Austrian Philharmonic Bullion Coins

|
Silver Philharmonics  |
Platinum Philharmonics

Platinum and Palladium Bullion


Mintages
for
2025
Gold & Silver Mexican Libertad
|
Gold Libertads |


Updated Mintages for
American Gold Buffalo
American Gold Eagle
American Silver Eagle
2024 & 2025
Jerusalem of Gold Bullion
Coin photos
(bottom of page)
 Obverse side")


Help Us Expand our Audience by forwarding our link
www.free-bullion-investment-guide.com.
Thank You!
Last Month's

In No Particular Order
April 2026
|
All Articles were Originally Posted on the Homepage Gold Nanoparticle Cancer ResearchSona Nanotech’s Hyperthermia Platform Boosts Immunotherapy Response in Colorectal Cancer Study - Tipranks Sona Nanotech Showcases Cancer Therapy Results At Prestigious Industry Cancer Conferences - Financial Times Development of gold nanostars coated with mesoporous silica for chemo-photothermal therapy - Published Research Paper - Journal of Drug Delivery Science and Technology (Science Direct) |
All Articles were Originally Posted on the Homepage