
The Dollar Breaks a
Critical Support Level
Review and Outlook for the U.S. Dollar, Silver, and Gold
Originally Posted on 2/18/2018 @ 4:48 pm
Re-posted on 2/20/2018 @ 11:20 am
by Steven Warrenfeltz
Subscribe to this Blog

Hello,
Thank you for visiting the Free-Bullion-Investment-Guide's latest blog post, before we get to the precious metals review and outlook, below are some of the Best Bullion Market-Related News articles that were taken from this guide's home page, over the past few weeks.

Why Continuing Down This Path Leaves America in a No Win Scenario - Econimica
Inflation's Real Threat to the Economy - NewsMax
Why the Dow's Historic 1,175-Point Plunge Isn't That Impressive - The Motley Fool
Add Stock Buybacks to the Causes of the Market Downturn - Bloomberg
INFLATIONARY: Budget Deal: Bipartisanship Wins, Taxpayers Lose - CATO Institute
Gold Fireworks On The Horizon - The Felder Report
Royal Canadian Mint develops system aimed at fixing ‘white spots’ - Coin World
COIN FINDS: Rolls yield 40 percent-silver Kennedys - Numismatic News
Best of the Week for
Gold NanoParticle Cancer Research
Technique produces powerful DNA wire biosensors - KTH Royal Institute of Technology
The Nano Approach of Medicines - BioSpectrum

What was the U.S. Dollar's Critical Support Level?
The $91.00 price level.
The price support level has been in existence since January 2nd, 2015 when the dollar was consistently hitting new highs.
Then the dollar traded well above the level for more than two years before it tested the level last September.

But the news over the last several weeks has proven to be too much for the dollar, below are some of the news events that have helped drive the dollar below the $91.00 price level.
01/10/2018: "China Weighs Slowing or Halting Purchases of U.S. Treasuries " - Bloomberg
01/24/2018: Dollar tanks the most in 10 months after Treasury secretary says a weak dollar is good for trade - CNBC
02/07/2018: Budget Deal: Bipartisanship Wins, Taxpayers Lose - CATO Institute
02/15/2018: US inflation surprise lights fire under gold price - MINING
The U.S. Dollar fell through the $91.00 price level on January 15, 2018, and although I wrote about my expectations for the dollar's rebound in my last blog post titled: Waiting on the Inevitable, the following was written in the dollar's outlook section two weeks ago:
|
To be honest, I'll be surprised if it rebounds above the upper trend-line of the 'Falling Expanding Wedge' (as it should) simply because of the damage that has been done to the dollar's technical support levels. |
The $91.00 price level isn't the only price level that's been broken over the last several weeks, however, the fact that it was tested last September helped to confirm the level as a critical support level for the U.S. Dollar.
But now that the level has been broken, it has turned into a strong resistance level for the dollar.
The U.S. Dollar's next critical support level sits at the $87.00 price level.
Review & Outlook
|
All the charts on this blog are Daily Charts unless noted otherwise.
US DOLLAR
In Review - 2 weeks ago
Two weeks ago, I wrote the following outlook for the U.S. Dollar and posted the chart below.
The dollar is still expected to rebound, it's been beaten down and is trading deep in oversold territory, so a rebound is still expected.
To be honest, I'll be surprised if it rebounds above the upper trend-line of the 'Falling Expanding Wedge' (as it should) simply because of the damage that has been done to the dollar's technical support levels.
However, the pattern is still the most dominant pattern in the U.S. Dollar's chart, so until a new pattern appears a rebound in the dollar's price is still expected.


In Review continued
As you can see in the chart below, the dollar did rebound, but it could not find the strength to close above the $90.40 price level.
In addition, the Falling Expanding Wedge is still intact, but it could be fading away.

U.S. Dollar - Outlook
In the outlook chart below, the 'Falling Expanding Wedge' is still intact, but, I have faded its labeling and dotted its trend-lines because the positive pattern may not play-out as expected, but that scenario is doubtful.
The dollar should confirm or deny the pattern sometime in the future, the question is; When?
But now, a new 'Falling Expanding Wedge' has formed in the dollar's chart.
The new positive wedge pattern is steep and narrow, so barring any unexpected news, the dollar should confirm it sometime in the near future.
However, the dollar's MACD and RSI are giving very little indication as to which way the dollar will move, so perhaps the dollar will break the new pattern soon, or it may continue its fall inside this new pattern like it did the older one, time will tell.

Charts provided courtesy of TradingView.com
U.S. Dollar's Price Resistance and Support Levels
U.S. Dollar's Resistance Levels
$91.00
$90.50
U.S. Dollar's Support Levels
$88.00
$87.00
SILVER
In Review
Two weeks ago, the outlook below was posted for silver and the chart below.
In silver's outlook chart below, you can see that a new and larger 'Falling Wedge' has formed in its price chart.
This is a positive pattern, but because of the broadness of the wedge, the price of silver is expected to trade inside it before it breaks above the upper trend-line.
The question now is: When will it break the upper trend-line of the positive wedge?
That I can't tell you, time will tell.

In Review - continued
Late last week, the price of silver closed above the 'Falling Wedge' confirming the positive pattern, before it fell back below it.

Silver - Outlook
For the week to come, silver has formed a Rising Expanding Wedge.
As the chart suggests, silver's price could confirm the negative wedge pattern very soon, or we could see the price of silver bounce around inside the pattern before it confirms it.
Either way, as the negative pattern suggests, a dip in silver's price should happen sometime in its short-term trade.

Charts provided courtesy of TradingView.com
Silver's Price Resistance &
Support Levels
Silver's Resistance Levels
$17.50
$17.00
Silver's Support Levels
$16.15
$16.00
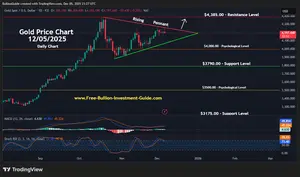
GOLD
In Review
Below, is what was written in the gold outlook from two weeks ago and its corresponding gold chart is below it.
In the gold outlook chart below, gold has formed a positive 'Falling Wedge' pattern.'
The pattern is very broad, so gold clearly has some room to trade inside it, however it could break above it in the near future.
But, gold's MACD and RSI are not giving this indication, instead they are showing that the price of gold will likely pullback more in price and trade inside the wedge before it confirms it by breaking the Falling Wedge's upper trend-line.

In Review - continued
As mentioned in the outlook from two weeks ago (above), the price of gold did trade inside the 'Falling Wedge' before confirming the positive pattern late last week.

Gold - Outlook

Like silver, gold has also formed a 'Rising Expanding Wedge,' it's a little broader than silver's wedge, so it isn't expected to confirm it as soon as silver is expected to confirm its negative wedge.
In addition, much like the dollar's MACD and RSI, gold's lower indicators are offering very little indication as to which way the price of gold will move in the near future.
So, for the next week or two, we should see gold's price move inside the negative wedge, before it confirms it.

Charts provided courtesy of TradingView.com
Gold's Price Resistance and
Support Levels
Gold's Resistance Levels
$1380.00
$1365.00
Gold's Support Levels
$1325.00
$1300.00
Thank You for Your Time.
Have a Great Week and God Bless,
Steve
'Click Here' see all of the prior Blog posts,
Thank You for Your Time!
|
Investment/Information Disclaimer: All content provided by the Free-Bullion-Investment-Guide.com is for informational purposes only. The comments on this blog should not be construed in any manner whatsoever as recommendations to buy or sell any asset(s) or any other financial instrument at any time. The Free-Bullion-Investment-Guide.com is not liable for any losses, injuries, or damages from the display or use of this information. These terms and conditions of use are subject to change at anytime and without notice. |
Return from this Guide's Latest Blog Post
|
Support this Guide & Paypal Thank You for Your Support |
|
|
 | |||||

Recent Articles
-
Newsletter of the Free Bullion Investment Guide - February 2026
Feb 07, 26 04:05 PM
 The February 2026 newsletter of the Free Bullion Investment Guide provides the latest updates, fundamental and technical gold and silver market analysis, the best articles from last month, and a list…
 -
Newsletter of the Free Bullion Investment Guide - December 2025
Dec 07, 25 02:24 PM
 The December 2025 newsletter of the Free Bullion Investment Guide provides the latest updates, fundamental and technical gold and silver market analysis, the best articles from last month, and a list…
 -
Newsletter of the Free Bullion Investment Guide - November 2025
Nov 08, 25 01:52 PM
 The November 2025 newsletter of the Free Bullion Investment Guide provides the latest updates, fundamental and technical gold and silver market analysis, the best articles from last month, and a list…
 -
Premium Bullion - 1 oz Silver Majestic Polar Bear Coin
May 18, 25 04:17 PM
 The Premium Bullion - 1oz Silver Majestic Polar Bear coins are specially made for collectors and investors alike; they are made of 99.99% pure silver and have a limited mintage; it is in an assay card…
 -
Latest Update (3/14/25) from the Free Bullion Investment Guide
Mar 14, 25 11:23 PM
Free Bullion Investment Guide's Latest Updates: Mexican Gold and Silver Libertad - 2024 Mintage Figures & more...

18W LED Security Light (Dusk to Dawn & Motion Sensor) - $32.99
from:
 LED Lighting

 (as of March 11, 2011)")
This website is best viewed on a desktop computer.
Keep this Guide Online
& Paypal
Thank You for
Your Support
with Feedly
Search the Guide
| search engine by freefind | advanced |
Premium Canadian Bullion

Give a lasting gift of the iconic Silver Maple Leaf bullion coin [More]
Free Shipping on Orders over $100 (CDN/USA)
or
From the U.K. Royal Mint


Daily
Newsletter
Updated Mintages for
American Gold Buffalo
American Gold Eagle
American Silver Eagle

2024 & 2025
Jerusalem of Gold Bullion
Coin photos
(bottom of page)
 Obverse side")
 Obverse side")
Mintages
for
2024
Gold & Silver Mexican Libertad
|
Gold Libertads |


Chinese Gold Coin Group Co.
& Chinese Bullion


Help Us Expand our Audience by forwarding our link
www.free-bullion-investment-guide.com.
Thank You!
Last Month's

In No Particular Order
February 2026
All Articles were Originally Posted on the Homepage