Which Way Will
Gold and Silver Move?
in their short-term trade
Precious Metals Review and Outlook from
8/04 thru 8/18/2017
Originally Posted on 08/14/2017 @8:09 am
Last Edited on 08/14/2017 @11:09 am
by Steven Warrenfeltz
Subscribe to this Blog

Hello,
Thank you for visiting the Free-Bullion-Investment-Guide's latest blog post, I hope that you and your family have been Enjoying the Summer!
It's been two weeks since I posted, so before we get to this week's post below are some of the Best Bullion Market-Related News articles that were taken from this guide's homepage.

Gold Demand Trends Q2 2017 - WGC
U.S. Mint will start selling palladium American Eagle bullion coins in September - Coin World
VIDEO : Rick Santelli Interviews the Fmr. IMF Chief Economist, Kenneth Rogoff and Author of the "Curse of Cash" (A glimpse into a banker's point of view in monetary policy) - CNBC
PMANA requests House Committee on Ways and Means to bring fairness to the taxation of precious-metal coins and bullion - Mint News Blog
RAY DALIO: Risks are rising, and everybody should put 5% to 10% of their assets in gold - Business Insider
The Fed Remains on Course – To Trouble - Cobden Centre
VIDEO : National Alliance Securities' Andy Brenner & CNBC's Rick Santelli discuss central bank policy & European economic reform. - CNBC
This Is the First U.S. Coin, Says Numismatic Scholar - Gainesville Coins
Best of the Week for Gold NanoParticle Cancer Research
GOLD NANOPARTICLE : CANCER RESEARCH : Gold nanoparticles could be used to treat cancer, scientists say - The Independent

'Question Mark' graphic courtesy of Pixabay.com
Which way will gold and silver go this week?
That’s a question many have offered their thoughts on, but nobody really knows.
Why?
Because fundamentally as long as North Korea continues to threaten the United States and its Allies with a missile strike of some kind, there will be investor’s looking to buy gold and silver as a safe haven.
However, after studying the gold and silver charts over the last two weeks, technically speaking the price charts are showing that a pullback is coming.
So, if Kim Jong-Un does the unthinkable and attacks one of our allies or us, then you can expect gold and silver to move higher, but if tensions ease and the war rhetoric, then you can expect one or more of the technical patterns in the gold and silver charts (below) to be confirmed.
I haven’t posted a blog post in two weeks, mostly because the technical patterns in my last post had not been confirmed or denied yet, plus, nothing new had formed in the charts, so it seemed, to me at least, to be redundant to waste your time with more of the same.
However, things have changed, a little, but little enough to post, so let's first review what was posted two weeks ago then we will move on to what the technical patterns in are saying in the charts for the week ahead.
This week’s Precious Metals Review and Outlook includes Gold, Silver, US Dollar and an update on the GDX.
GOLD
In Review
Below is the commentary and chart from two weeks ago.

In the chart below, a 'Rising Expanding Wedge' has been identified in gold’s chart.
As you can see in the small example chart, to the right, a rising expanding wedge is a negative pattern.
However, Gold’s MACD and RSI are indicating that perhaps gold may try to hold this level or try to move higher.
But, there’s a lot of resistance between the $1280 to $1300 price levels, so if gold does move up it's doubtful it will push above this level at this time.
Plus, the 'Rising Expanding Wedge' is telling us a transition will happen sometime in the near future for gold, so unless something fundamentally changes, it seems pretty likely that by the end of this week we will be looking at a lower price than we see today.

Gold - This Week's Outlook
As you can see in the chart below, everything that was posted two weeks ago is still playing itself out.
Gold is still trading inside the 'Rising Expanding Wedge' and it is now trading inside the resistance zone between $1280-$1300, but it has also formed another negative 'Rising Expanding Wedge' pattern.
So, if fundamentals change, meaning that if tensions between the United States and North Korea ease, then you can expect gold’s price to be correcting sometime in the near future.

Charts provided courtesy of TradingView.com
Gold's Price Resistance and
Support Levels
Gold's Resistance Levels
$1300.00
$1290.00
Gold's Support Levels
$1260.00
$1240.00
SILVER
In Review
Below is the silver commentary and chart from two weeks ago.
For the week to come, silver’s MACD and RSI are indicating that it may move a little higher, but like gold, it too has formed a negative ‘Rising Expanding Wedge,’ so a change in direction or transition is expected for silver in the near future.

By looking at the chart below you can see that on 8/02/2017, silver confirmed the 'Rising Expanding Wedge' in the chart above.

Silver - This Week's Outlook
Now that silver has confirmed the 'Rising Expanding Wedge' from two weeks ago, it has now created a new one.
In the chart below, you can see that the new Rising Expanding Wedge is still mostly moving upwards, the MACD and RSI are giving mixed messages.
The MACD says 'silver may have more room to move up,' while the RSI is saying 'things may change sooner than you think.'
But, actuality says 'Fundamentals currently hold all the cards' so it matters if the tensions between North Korea and the United States increase or decrease.
So, if tensions decrease, the rise in the price of silver will subside and technical patterns are showing us to expect a pullback.

charts provided courtesy of TradingView.com
Silver's Price Resistance &
Support Levels
Silver's Resistance Levels
$17.75
$17.20
Silver's Support Levels
$16.50
$16.10
US DOLLAR
In Review
Below is the U.S. Dollar's commentary and chart from two weeks ago.
The opposite of what we’ve seen in gold and silver’s chart has now been identified in the U.S. Dollar chart, below.
A ‘Falling Expanding Wedge’ has been identified in the U.S. Dollar chart and it is a positive indicator, so sometime in the near future we should see a rise in the U.S. Dollar.
Plus, as the chart shows it is expected to rise up to the $94.50 to $95.00 price level to break the upper resistance trend-line of the ‘expanding falling wedge.’

Over the last two weeks nothing much has changed with the U.S. Dollar.
It is still trading inside the 'Falling Expanding Wedge,' its moved up a little, but it hasn't moved up very much.
In addition, it certainly hasn't come close to reaching the upper trend-line of the 'Falling Expanding Wedge,' that I mentioned in the last post.
U.S. Dollar - This Week's Outlook
In the chart below, we can see that the U.S. Dollar is basically trading sideways inside the Falling Expanding Wedge.
But it is still expected to confirm the pattern, so sometime in the near future, we should see the dollar rise breaking the upper trend-line of the 'Falling Expanding Wedge, confirm it.
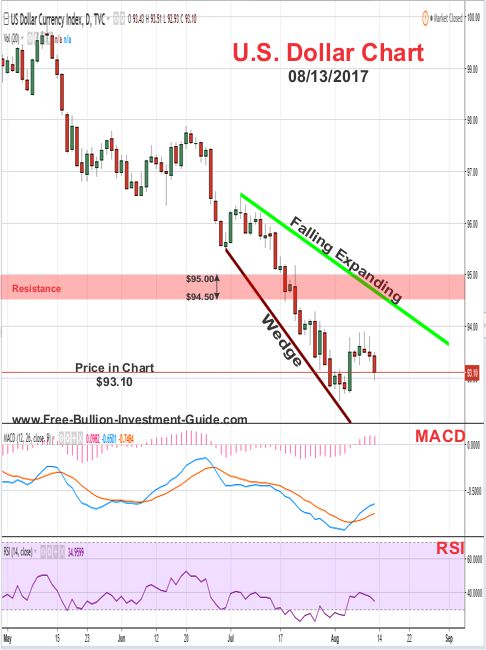
Charts provided courtesy of TradingView.com
U.S. Dollar's Price Resistance and Support Levels
U.S. Dollar's Resistance Levels
$95.00
$94.50
U.S. Dollar's Support Levels
$92.70
$92.00
GDX - Gold Miners ETF -
Review & Update
Several weeks ago, I reviewed the GDX ETF chart, below is the chart I posted.

Once in a while, I review other technical analyst's technical analysis, but whether or not I agree or disagree, I rarely post contradictions.
This weekend I was reading this post 'here' on 321gold.com and when I came to the GDX chart in the article, I looked at my chart and found some differences.
This link will take you to the GDX chart in the post 'here.'
Below, is an updated view of the my chart above.
(continued...)
Trading View GDX Chart

After I looked over the chart in the article again, I wanted to be completely fair, the author of the post used StockCharts.com's charts (not TradingView.com) and the chart is dated from mid-December 2016 - August 13, 2017, below is a StockCharts.com comparison.
I'm posting this update to show you that from my experience, the GDX hasn't broken the 'Falling Wedge' yet, although because of the nature of the falling wedge, it is expected to do so sometime in the future.
So lastly, we'll see what the price of the GDX does this week, and I'll update you next week on what happens.
Stock Charts GDX Chart

Charts provided courtesy of TradingView.com
Thank You for Your Time.
Have a Great Week.
God Bless, Steve
'Click Here' see all of the prior Blog posts,
Thank You for Your Time!
Investment/Information Disclaimer:
All content provided by the Free-Bullion-Investment-Guide.com is for informational purposes only. The comments on this blog should not be construed in any manner whatsoever as recommendations to buy or sell any asset(s) or any other financial instrument at any time. The Free-Bullion-Investment-Guide.com is not liable for any losses, injuries, or damages from the display or use of this information. These terms and conditions of use are subject to change at anytime and without notice.
|
Support this Guide & Paypal Thank You for Your Support |
|
|
 | |||||

Recent Articles
-
Newsletter of the Free Bullion Investment Guide - April 2026
Apr 05, 26 04:44 PM
 The April 2026 newsletter of the Free Bullion Investment Guide provides the latest updates, fundamental and technical gold and silver market analysis, the best articles from last month, and a list of…
 -
Newsletter of the Free Bullion Investment Guide - February 2026
Feb 07, 26 02:12 PM
 The February 2026 newsletter of the Free Bullion Investment Guide provides the latest updates, fundamental and technical gold and silver market analysis, the best articles from last month, and a list…
 -
Newsletter of the Free Bullion Investment Guide - January 2026
Jan 07, 26 04:07 PM
 The January 2026 newsletter of the Free Bullion Investment Guide provides the latest updates, fundamental and technical gold and silver market analysis, the best articles from last month, and a list o…
 -
Newsletter of the Free Bullion Investment Guide - December 2025
Dec 07, 25 04:35 PM
 The December 2025 newsletter of the Free Bullion Investment Guide provides the latest updates, fundamental and technical gold and silver market analysis, the best articles from last month, and a list…
 -
Newsletter of the Free Bullion Investment Guide - November 2025
Nov 08, 25 01:58 PM
 The November 2025 newsletter of the Free Bullion Investment Guide provides the latest updates, fundamental and technical gold and silver market analysis, the best articles from last month, and a list…

18W LED Security Light (Dusk to Dawn & Motion Sensor) - $32.99
from:
 LED Lighting

) (as of March 11, 2011)")
This website is best viewed on a desktop computer.
Keep this Guide Online
& Paypal
Thank You for
Your Support
with Feedly
Search the Guide
| search engine by freefind | advanced |

Give a lasting gift of the iconic Silver Maple Leaf bullion coin [More]
Free Shipping on Orders over $100 (CDN/USA)
The Sovereign 2026 Gold Bullion Coin in Card

Britian's
Royal Mint

Daily
Newsletter
Mintages & Photos
|

|
Silver Panda |

Mintages
for
2024
Gold, Silver, & Platinum
Austrian Philharmonic Bullion Coins

|
Silver Philharmonics  |
Platinum Philharmonics

Platinum and Palladium Bullion


Mintages
for
2025
Gold & Silver Mexican Libertad
|
Gold Libertads |


Updated Mintages for
American Gold Buffalo
American Gold Eagle
American Silver Eagle
2024 & 2025
Jerusalem of Gold Bullion
Coin photos
(bottom of page)
 Obverse side")


Help Us Expand our Audience by forwarding our link
www.free-bullion-investment-guide.com.
Thank You!
Last Month's

In No Particular Order
April 2026
|
All Articles were Originally Posted on the Homepage Gold Nanoparticle Cancer ResearchSona Nanotech’s Hyperthermia Platform Boosts Immunotherapy Response in Colorectal Cancer Study - Tipranks Sona Nanotech Showcases Cancer Therapy Results At Prestigious Industry Cancer Conferences - Financial Times Development of gold nanostars coated with mesoporous silica for chemo-photothermal therapy - Published Research Paper - Journal of Drug Delivery Science and Technology (Science Direct) |
All Articles were Originally Posted on the Homepage