Yellen's Bluff
Part 2:
Consumer Credit
Consumer Credit is showing troubling signs of stress; how did this happen and what is the Federal Reserve's role?
Originally Posted on 7/15/2017 @3:38pm
By Steven Warrenfeltz
Subscribe to this Weekly Blog post
Intro:
My uncle Paul was an investor and a WWII B-24 navigator; he gave his sons one of the best pieces of advice that everyone should use in life and investing: "Keep Your Eyes on the Horizon."
The last Yellen’s Bluff blog post was about the oil industry and how its implosion could cause Yellen’s Bluff to peak, this post is about Consumer Credit.
Yellen’s Bluff is a series of blog posts that will explain what market catalyst could halt the Federal Reserve’s Interest Rate hikes and bring them back down to the zero level or lower.
Every Federal Reserve Chairman has created an Interest Rate Bluff, some more than others, but as long as Janet Yellen is the Federal Reserve President this series will be called 'Yellen’s Bluff.'
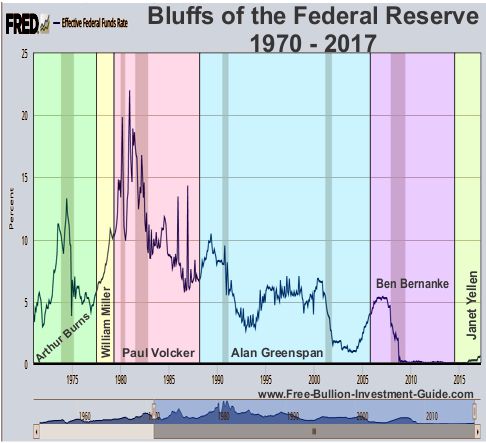
But, Janet Yellen’s term ends on February 3rd, 2018, so if the economy doesn’t implode before then, she could ‘Luck-Out’ and hand-off the economic mess that her and Ben Bernanke have created to some other poor soul that the President nominates who'll take the blame for it.
Or she could be re-appointed, but that's very doubtful.
What is Consumer Credit?
Consumer Credit involves these areas of the credit market: Student Debt, Credit Cards, Auto Loans, Home Equity and other forms of personal loans.
Investopedia explains Consumer Credit offers the definition below:
Consumer credit is the portion of credit consumers use to buy non-investment services consumed or goods that depreciate quickly. This includes automobiles, education costs, recreational vehicles (RVs), boat and trailer loans, but it does not include debts obtained to purchase margin on investment accounts or real estate.
Source: Investopedia.com
Consumer Credit in the News
Choosing 'Consumer Credit' for this 'Yellen's Bluff' post was not my first choice, but shortly after I posted 'Part I,' I kept finding articles in the news about the 'Alarming Increase of Consumer Credit.'
So I thought I'd look deeper into the subject; below are a few of the articles that I read:
Your debts are hurting you, finance counselor says - The Wichita Examiner
Subprime Auto Loans Crushed Worse than in 2009, Auto Industry Bleeds, Knock-on Effects Commence - Wolf Street
As Americans take on more debt, some pockets of concern - The Sentinel
In every case, the articles above got their information from this New York Federal Reserve Report released in May of 2017:
'Quarterly Report on Household Debt and Credit'
Sources: .PDF & Online (Note: Online version will be revised after August 15th 2017)
Key Facts the Fed's Report
One of the most common themes in these articles is that Consumer Debt has exceeded 2008 levels and now stands at 12.73 trillion
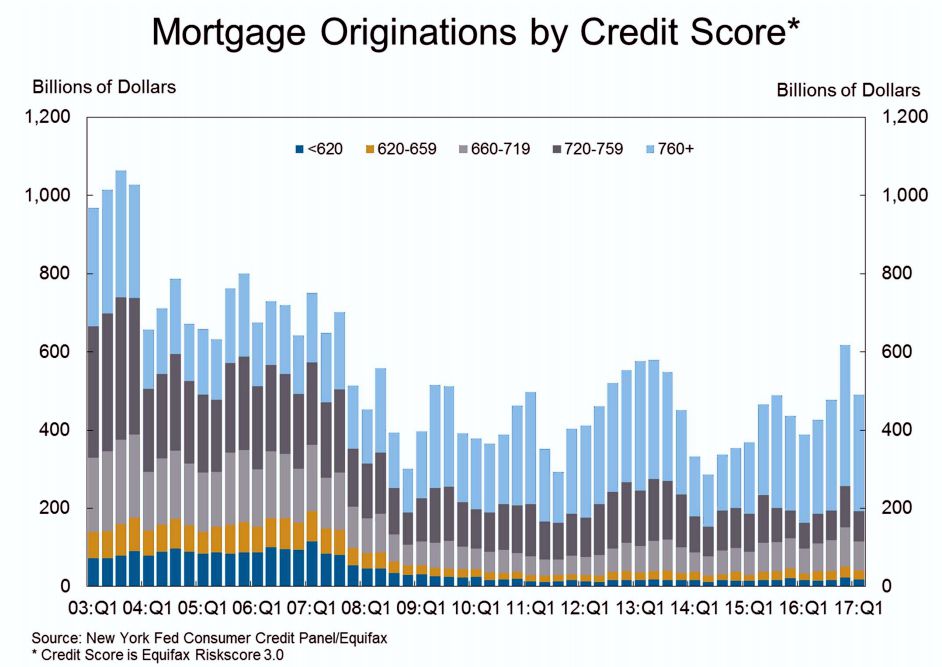
This is true, but the biggest problem in 2008 was the amount of subprime mortgage debt in relation to the other forms of debt.
As you can see in the chart below, the subprime mortgage market doesn’t seem to have the same underlying issues that it did in 2008.
This isn’t to say that it can’t become a problem, or that there aren't some serious issues with other sectors of the real estate markets, most notably the commercial real estate market.
The commercial real estate market is in the process of a long and painful transition as the consumer moves away from traditional retail markets and moves more toward shopping on the internet.
Its issues are more oriented to a changing market, not so much with higher interest rates, although it will be affected by them.
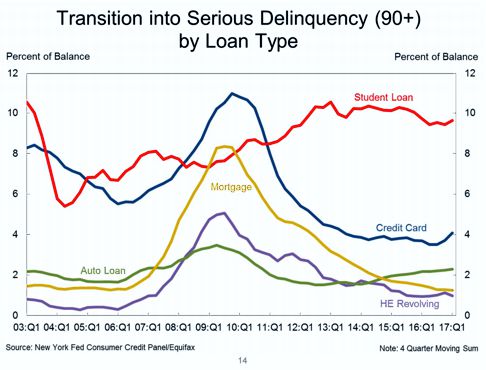
However, Student Loans, Auto Loans, and Credit Card debt are showing signs that there's going to be trouble on the horizon, below is a chart from the Federal Reserve’s Quarterly Report that shows a rise in delinquencies among these three sectors.
It’s commonly known that when delinquency rates start rising, trouble isn’t far away because it's evidence that the consumer's finances are getting stretched.
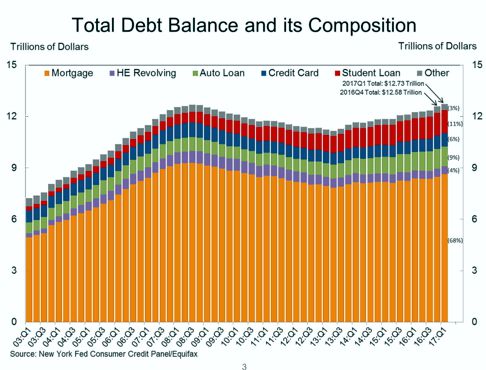
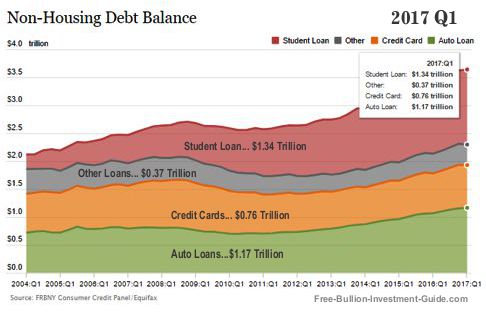
In the chart below, you can see that outside of housing debt, student loans have the highest debt burden on the economy, followed by Auto Loans and Credit Card debt.
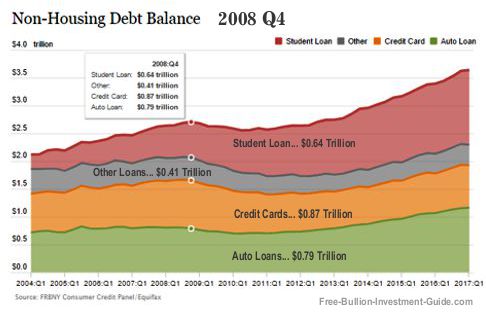
The disturbing factor about the numbers in the chart above is how they compare to the Credit Crisis of 2008, the last time the debt markets reached high levels.
Student Debt has doubled, Auto Loan debt is up over 30% from 2008, and Credit Card debt is closing in on its all-time high of $870 billion, and it is expected to surpass it.
Why is Consumer Debt Increasing?
Wage Growth or Lack Thereof
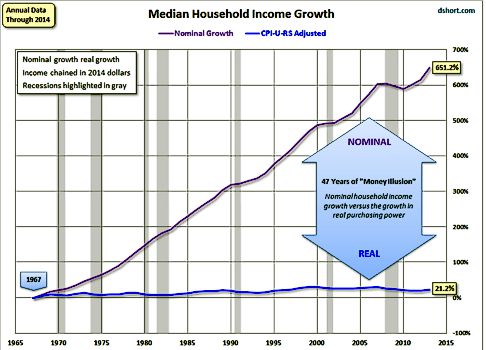
The Wage Growth of the average American Household has not kept up to nominal growth and the chart below shows you this.
The chart gives you a glimpse into the deception of growth for the American workforce. It shows that since 1967, the nominal growth of the Median American Household should have been up to 651%.
But, after adjusting for inflation, that 651% nominal growth shows that our purchasing power has actually only grown by 21% in the last 50-years.
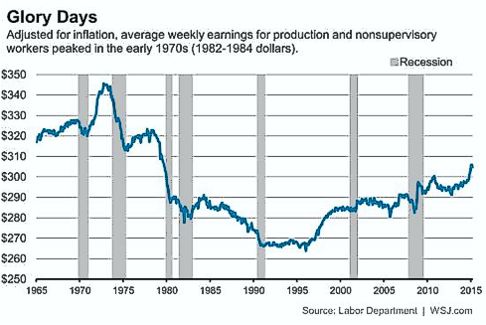
The Wall Street Journal created the next chart from the Labor Department’s information, in it, you can see that inflation-adjusted wages were higher in 1972 than they are today.
Note: most of the charts in this section were created 2015, however, as you can see, two years doesn't make that much of a difference.
The two charts above show you how inflation has eroded the consumer purchasing power.
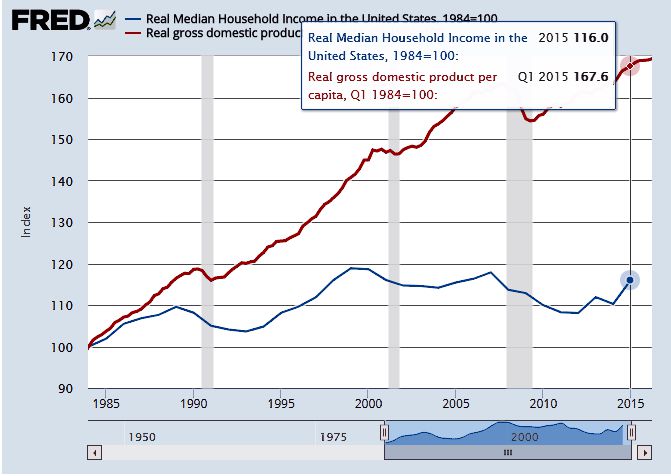
The next chart below is from the Federal Reserve, the data that they used only goes back to 1984, however, like the first chart above it offers another view of how the United State's GDP (Gross Domestic Product) has advanced in comparison to the Median Household Income.
Clearly, a pattern is showing, industry has been increasing in productivity, while the wages of the more productive individual have not.
And as industry adjusts their prices to compensate for inflation, the individual has to find new ways to keep up with higher prices, usually by getting a second job or by using credit.
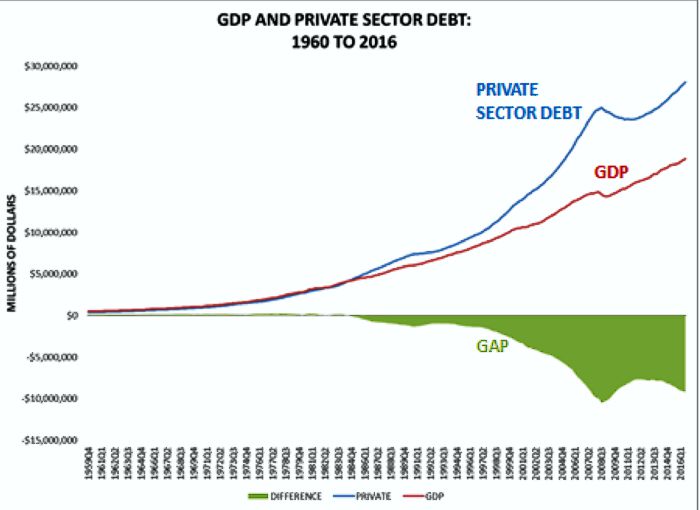
The next chart below is a reversal of the last chart, it offers you another point of view into how wages have not kept up with growth and its consequence, debt.
In this economy debt is inevitable and in an environment of higher interest rates the added burden on the consumer will make it harder for them to pay off debt.
The Fed and the Consumer
The Federal Reserve is in a cycle of raising interest rates, they raise rates for several reasons which include:
- To restrain inflation
- To draw liquidity out of the market
- To slow or cool down areas of the economy
- To give them room to lower rates (this reason has nothing to do with their original charter mostly because the Federal Funds rate has never been this low.)
It's common knowledge that 70% of the American Economy is supported by consumer spending.
Every time the Fed hikes interest rates, it adds pressure on the American Consumer.
The members of the FOMC (Federal Open Market Committee) are academics and understand the financial side for raising rates.
But, they don’t understand how the constant rise in interest rates hurt the average individual.
This is why it will be a shock to them when higher interest
rates crush the consumer in unforeseen ways, just like they were shocked in 2008 when the last
credit/debt financial bubble burst.
What Higher Interest Rates do to the Consumer:
- Higher Minimum payments on Credit cards, Student Loans, and other adjustable rate loans
- Higher financing rates to buy a car (new or used)
- Less money for everyday items (ex: gas, food, clothing, etc.)
- Cut back on leisure or luxury items; (ex: eating out, movies, vacations, gifts, etc.)
Adjustable Rate Loans
The chart below is the exact same chart taken from above, but when you look at it this time, pay a little more attention to the types of loans that have rising rates of delinquency.
Auto Loans have been making a constant move up, which isn't good, but auto loans are rarely given on an adjustable rate basis.
The areas of the chart below that should give us a more concern are student loans and credit card debt delinquencies.
Delinquency rates for these forms of credit are clearly on an uptick.
The underlying reason behind the rise in delinquency rates is that these forms of credit are given to individuals on an adjustable rate, meaning that as the federal fund's rate increases, so do the rates on these loans.
Note: this isn't the case for all student loans, it was up to the individual when they took out the loan whether or not to open a fixed rate or adjustable loan.
Adjustable rate loans were one of the biggest factors that crushed the housing market in 2008.
Here are a few studies about the Financial Crisis of 2008 that explain how Adjustable Rate Mortgages (ARM) Loans were one of the biggest causes behind the crash.
PDF : The Rise in Mortgage Defaults - Federal Reserve
PDF : Subprime Mortgage Crisis - Department of Statistics and Operations Research
The Subprime Mortgage Market Collapse: A Primer on the Causes and Possible Solutions - The Heritage Foundation
Adjustable Rate Mortgages were put under heavy regulation after 2008's financial crash, sadly its only after a crisis when individuals see how destructive this form of credit can be.
Keep your Eyes on the Horizon
The Federal Reserve's next report on House Hold debt will come out on August 15th, 2017 - here.
In it and in the future, you will want to pay attention to the delinquency rates of consumer loans, and the amount of debt that is growing in the system.
The problems with consumer credit aren't going to go away and they will only get worse as rates rise.
So, as you can see, it's only a matter of time before 'Yellen's Bluff' will peak, question is; What will be its downfall?
Thank You for Your Time!
www.free-bullion-investment-guide.com
|
Support this Guide & Paypal Thank You for Your Support |
|
|
 | |||||
This website is best viewed on a desktop computer.
Keep this Guide Online
& Paypal
Thank You for
Your Support
with Feedly
Search the Guide
| search engine by freefind | advanced |
Premium Canadian Bullion
Give a lasting gift of the iconic Silver Maple Leaf bullion coin [More]
Free Shipping on Orders over $100 (CDN/USA)
or
From the U.K. Royal Mint


Daily
Newsletter
Updated Mintages for
American Gold Buffalo
American Gold Eagle
American Silver Eagle
2024 & 2025
Jerusalem of Gold Bullion
Coin photos
(bottom of page)
Mintages
for
2024
Gold & Silver Mexican Libertad
|
Gold Libertads |
Chinese Gold Coin Group Co.
& Chinese Bullion
Help Us Expand our Audience by forwarding our link
www.free-bullion-investment-guide.com.
Thank You!
Last Month's

In No Particular Order
January 2026
All Articles were Originally Posted on the Homepage
