Homepage / Archived News or Quarterly News / 3rd Quarter 2012
3rd Quarter - 2012
Charts, Bullion News & Commentary
This page provides a comprehensive overview of gold, silver, platinum, and palladium during the quarter.
For each of the precious metals, you'll find charts. Below the charts, you will find Bullion News Headlines from the 3rd Quarter of 2012. Every news link was originally posted on this guide's homepage.
The charts below are provided courtesy
Gold Price Charts - 3rd qtr. 2012
Gold Price Chart (Jul. 1st, 2011 - Sept. 30th, 2012)

Bullion News
Gold Price Summary
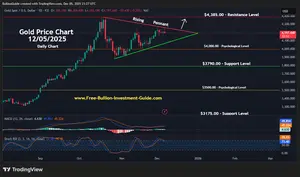
In the third quarter of 2012, gold's price chart displayed three golden crosses, indicating a strong bullish signal for gold.
The first golden cross occurred in late July when the 10-day moving average rose above the 50-day moving average. The second golden cross happened when the
10-day moving
crossed above the 200-day moving average.
The third golden cross, not pointed out in the chart (below), happened when the 50MA crossed above the 200MA; this was another bullish signal in Gold's price chart.
Gold's price chart showed clear signs that more buyers were in the market than sellers, the volume of buyers was high, and the RSI (Relative Strength Index) and the MACD (Moving Average Convergence-Divergence) were both in positive territory.
However, near the end of the quarter, the MACD, RSI, and trading volume were all topping out, and the volume of sellers in the market had started to overtake those of buyers. All of these were indications that some consolidation was in order after the rise in gold's price.
Gold Price Chart (Jul. 1st, 2012 - Sept. 30th, 2012)

Gold Price Chart (Oct. 1st, 2010 - Sept. 30th, 2012)

Bullion News

4.7 star - Customer Reviews
Silver Price Chart - 3rd qtr. 2012
Silver Price Chart (Jul. 1st, 2011 - Sept. 30th, 2012)

Bullion News
Silver Price Summary
Silver's quarterly spot price chart closely resembles gold's chart for the third quarter of 2012.
Silver, like gold, experienced three Golden Crosses in the third quarter of 2012. The first Golden Cross for silver occurred in the second week of August, which was later than the one noted in gold’s chart. This event signaled that a bottom had been reached and that a new upward trend had begun in the spot price.
Near the end of the quarter, the spot price of silver seemed to have peaked at around $35.00 per troy ounce. However, when the 50-day moving average crossed above the 200-day moving average, creating another golden cross, it signaled a positive trend.
Silver's spot price at this time was looking for further positive movement, but with the RSI and MACD topping out and breaking down, the future price of silver was in question.
Silver Price Chart (Jul. 1st, 2012 - Sept. 30th, 2012)

Silver Price Chart (Oct. 1st, 2010 - Sept. 30th, 2012)

Bullion News

Platinum Price Chart - 3rd qtr. 2012
Platinum Price Chart (Jul. 1st, 2011 - Sept. 30th, 2012)

Bullion News
Platinum Price Summary
Similar to Gold and Silver, Platinum's spot price experienced two Golden Crosses in the third quarter of 2012. After undergoing consolidation for much of the previous quarter and the first half of this quarter, buyers were eager to purchase Platinum at a discounted price.
Silver, platinum, and palladium are all industrial metals that also serve as commodities for savings and investment. Due to these shared characteristics, their price charts often show similarities.
In Platinum's 3rd quarter chart, the increase in price and investment volume are both positive signs for the next quarter.
Platinum Price Chart (Jul. 1st, 2012 - Sept. 30th, 2012)

Platinum Price Chart (Oct. 1st, 2010 - Sept. 30th, 2012)

Bullion News

Palladium Price Chart - 3rd qtr. 2012
Palladium Price Chart (Jul. 1st, 2011 - Sept. 30th, 2012)

Bullion News
Palladium Price Summary
Palladium's spot price chart for the third quarter of 2012 shares many characteristics with the previous three quarterly charts of precious metals.
Palladium's price chart has two golden crosses, and both the RSI and MACD were showing positive signs of price movement. However, late in this quarter, Palladium's spot price shows signs of being overbought.
Palladium Price Chart (Jul. 1st, 2012 - Sept. 30th, 2012)

Bullion News
Palladium Price Chart (Oct. 1st, 2010 - Sept. 30th, 2012)

The charts above are provided by the courtesy of
3rd Quarter - 2012
Bullion News & Commentary
The Quarterly News starts with the end of the quarter articles, first.
Please be aware that not all of the links below are working; they have been retained because the headlines provide information on the state of the markets at the time.
09/30/12 - Bullion News
MINING – Gold set to rise on inclusion as Tier 1 banking asset
TimesUnion – Unfavorable tax treatment for gold
CoinNews – Gold, Silver Surge in Quarter, Sept. Sales of US Bullion Coins Swell
Charleston Voice – Are You Ready to Join the Nickel Hoarders?
The State Journal Register – Line of creditors long in Parsons/THR bankruptcy
09/29/12 - Bullion News
MoneyNews – Dallas Fed's Fisher: US 'Drowning in Unemployment'
Political Metals – Gold All Time High in Euro, Franc, Peso, Rupee, Rupiah, Real & Rand
Reuters – U.S. gold coins on track for weakest September sales in five years
Trader Dan – Gold Still Stuck near $1785 - $1800
VIDEO (08:37) : CNBC – (06:30) Kramer "Bullion is #1"
The New American – The Fed is Playing With Fire
Orlando Sentinel – Analysis: Gold favors slow burn over surge post-Fed easing
CoinNews – US Mint Tweaks Its Website
Motley Fool – Is Warren Buffett Wrong About Gold?
Wall St. Cheat Sheet – Gold Logs Best Quarter Since 2010, Silver Outperforms Everything in Q3
09/28/12 - Bullion News
Ahead of the Herd – What Does Gold Have Going For It?
CHARTs : Inside Futures – Gold Shines into Quarter-End
Market Anthropology – Pavlov's QE Dogs
Perth Mint Bullion – Video: 2013 Kangaroo Gold Bullion Coin Series
Gold Versus Paper – Silver and the Myth of Diminishing Returns From QE
247 Bull – Death Knells for the US Dollar: Part II
ZeroHedge – Euro And Swiss Franc Fall To New Record Lows Against Gold
Bullion Street – Peru holds 120,000 tons of Silver underground

Affiliate Ad
09/27/12 - Bullion News
Profit Confidential – Steak Houses Struggle as Big Spenders Start to Feel the Pinch
XINHUANEWS (China) – U.S. QE3 signals deepening credit crisis: Dagong
Dollar Collapse – Tom Cloud: Silver is the Hot Thing Now
CoinNews – US Mint Sales: Sets, Covers Overshadow Collector Gold and Silver Coins
VIDEO (25:45) : Max Keiser – Keiser Report: Boom & Bust Vicious Cycle - Interviews Detlev Schlichter of Paper Money Collapse
Business Week – Hedge Funds Bullish on Silver as Hoard Nears Record: Commodities
Canada Free Press – Welcome to Bernankeville, the City of Jokernomics
VIDEO (01:12) : Bloomberg – Federal Reserve Bank of Philadelphia President Charles Plosser: QE Risks May Be Much Higher Than Benefits
San Fransisco Chronicle – Why Are People Hoarding Coins?
VIDEO (04:56) : CNBC – Fed's Inflation Nation Looms
09/26/12 - Bullion News
Profit Confidential – Dow Theory Flashes Sell Signal
SafeHaven – Global Currency Wars in Full Escalation
MineWeb – US election years, QE and a few "oh oh" moments for gold
Business Insider – BofA Makes The Case For $3,000 Gold
The Wall Street Journal – Silver Appears Set to Continue Its Upward Move
The Real Asset – The Hayekian currency
247 Bull – A brief history of money & banking: Part I
ZeroHedge – Presenting Warren Buffett's "Gold Cube"
USA Watchdog – Gold is a Currency
Silver Doctors – Chart of the Day: Federal Minimum Wage in Gold
Perth Mint Bullion – How Tiny Particles Of Gold Get Transformed Into Solid Gold Bars
GoldSilver – Golden Cross Signals Gold Gains, Silver Surge Ahead
CoinWeek – Spectrum’s A-Mark Precious Metals, Inc. Announces New Line of Sunshine Branded Bullion Products
Wealth Wire – Chinese Company Marketing FAKE Gold!
Business Week – A Lost Decade for Savers
Bloomberg – South African Strikes Halt 39% of Nation’s Gold Output
Financial Sense – The Currency Experiment Has Failed
The Daily Bell – Bernanke and Money Printing Have Got to Go
09/25/12 - Bullion News
Moneda De Plata Para Mexico – Reflections on the effects of War as compared to the effects of Fiat Money by Hugo Salinas Price
Wealth Daily – Junk Gold and Silver - Talking to a SHTF Survivor
Silver Doctors – SILVER EAGLE SALES JUMP 1 MILLION OVER THE WEEKEND
Numismaster – Tungsten-Filled 10-Ounce Gold Bars Raise Questions
LA Times – Use commemorative coins to pay down deficit, lawmakers suggest
VIDEO (01:27) : Wyatt Research – Where the Fed Money Really Goes
Financial Sense – What If the Fed Has It All Wrong?
Investment Rarities – TRANSPARENCY by Ted Butler
NewsMax – Deutsche Bank: Gold Might Not Be Overvalued Until $2,960
AUDIO : FSN - Ranting Andy Hoffman – COMEX Short Position… Silver Under $35 Or Bust
Bullion Street - Colombia drug lords turns to Gold
JS MineSet - In the News Today
The Telegraph - Financial regulators need to consider breaking up big banks to make the global economy safer
Wall St. Cheat Sheet - Fundamental and Technical Indicators Glitter for Gold
VIDEO (27:50) : Capital Account - Jim Grant offers his Observations on QE to Infinity and the Great Levitation!
09/24/12 - Bullion News
Casey Research - The #1 Reason Inflation Will Win
Ricochet - Milton Friedman Schools Hugo Chavez
Wyatt Research - What’s REALLY Moving Gold
International Man - Manipulation of the Gold Price
VIDEO (06:44) : CNBC - Silver to Gold Ratio
FX Empire - Gold Fundamental Analysis September 25, 2012 Forecast
SafeHaven - Interest Rates Are Prices
Profit Confidential - First Time Since 2009: Earnings Growth for S&P 500 Companies Turns Negative
GoldMoney - Spanish crisis hurting commodities (again)
Resource Investor - How to Store Silver at Home
Silver Coins Today - 2012-P Hawaii Volcanoes 5 Ounce Silver Uncirculated Coin Available
09/23/12 - Bullion News
VIDEO (10:38) : Financial Markets - The Solution - Part 2
TECHNICAL ANALYSIS : VIDEO (11:56) : The Running Of the Bulls Special QE3 Gold Report 9.23.2012
ZeroHedge - Gold Counterfeiting Goes Viral: 10 Tungsten-Filled Gold Bars Are Discovered In Manhattan
American Thinker - QE Forever
ETF Daily - If You Like QE3 But The Stock Market Makes You Nervous; Buy Gold
09/22/12 - Bullion News
CoinNews - Gold Gains 0.3% on Week, Silver Dips 2 Cents, US Silver Coins Explode
International Man - What You Should Think about Before Traveling With Precious Metals
VIDEO (04:13) : Wall Street Journal - What Do Central Banks Know That We Don't?
The Market Oracle - Gold-Silver Ratio Declining As U.S. Dollar Collapses
VIDEO (01:34) : Bloomberg - What Does Infinite Central Bank Buying Look Like?
VIDEO (28:04) : Capital Account - David Stockman on Federal Reserve Arrogance and Monetary Mission Creep!
Commodity Online - Copper market could face supply challenges in Q4 2012: Deutsche Bank
ZeroHedge - Gold And Silver Trump US Equities In Q3 And Year-To-Date
09/21/12 - Bullion News
VIDEO (04:54) : U.S. Global Investors - Interview with Frank Holmes on Bloomberg’s Taking Stock: Gold to Hit $2,000? $7,000? $40,000?
CHART : World of WallStreet - Strange "Gap" in Gold Chart..."Gold: I've Never Seen A Gap Like This Before"
VIDEO (03:08) : CNBC - Dalio: 'Gold' is the New 'Cash'...says Buffets making a "Big Mistake" in Gold
Jesse's Café Américain - Update on the Gold 'Shadow Chart' - Review of the 'Cup and Handle' Formation
ZEAL - New Silver Upleg
Gold and Silver Blog - Platinum Has Soared 17% Since Early August – What Now?
GoldSeek - I Have an IRA. How Can I Invest in Gold and Silver?
VIDEO (06:59) : CNBC - Why Fed's Easing Makes Santelli Uneasy
AdvisorOne - PIMCO’s El-Erian: Fed Wants Inflation Now, Will Clean Up ‘Mess’ Later
Bloomberg - Gold Seen Luring Wealthy as Central Bankers Expand Stimulus
Enterprising Investor - Poll: What Do You Think Will Be the Most Likely Impact of QE3?
VIDEO 04:00) : 3news - Gold a building block for investment - New Zealand Mint
Inside Futures - Silver Futures Analysis With Key Levels and Price Targets
GoldSilver - “How High Can Gold Go?” "There Is No Telling" James Grant Tells CNBC
VIDEO : Mish's Blog - Davidowitz on QE and the Economy: "Bernanke is Certifiably Nuts"
Ahead of the Herd - Poverty’s Roll Call
Gold Alert - “No Linkage” Between QE3 and Job Growth
CHARTS : Market Anthropology - Legends of the Fall
VIDEO (28:05) : Capital Account - John Mauldin and Jim Rickards discuss the Looming Debt Crisis and the Fiscal Abyss!
09/20/12 - Bullion News
Wealth Wire - 10 Quotes From Financial Experts About The Effect That QE3 Will Have On Gold And Silver
CoinNews - US Mint Sales: Numismatic Coins Solid, Bullion Eagles Superb
VIDEO (04:36) : Arabian Money - Gold bulls taking centre stage as BOA forecasts $2,400 an ounce
VIDEO (25:47) : Keiser Report: World Flash Clash Center, Max Keiser Interview's "Currency Wars" author Jim Rickards
Daily Wealth - Silver Is Up 25% Since August – What to Do Now
ZeroHedge - Deutsche Bank: Gold Is Money
CoinWeek - What If Only 3% of Adults Wanted To Purchase Physical Gold And Silver?
Perth Mint Bullion - How Much Gold Does China Have?
GoldScents - MARKETS ARE WAITING FOR THE OIL CYCLE TO BOTTOM
Article & VIDEO (01:18) : CNBC - ‘Golden Cross’ May Signal Big Gold Gains Ahead
VIDEO (11:56) : USA Watchdog - Peter Schiff-Dollar Vulnerable to a Massive Collapse, Buy Gold and Silver
09/19/12 - Bullion News
Article & VIDEO (01:36) : Silver Doctors - TUNGSTEN FILLED 10OZ PAMP SUISSE GOLD BAR DISCOVERED IN MANHATTAN
CoinNews - Gold Gains Marginally, Silver Dips 13 Cents, US Gold Coins Spurred
VIDEO (05:11) : Bloomberg - Are Central Banks' Throwing Everything at Markets?
Financial Sense - The Trouble With Printing Money by Chris Martenson
Article & VIDEO (01:36) : ZeroHedge - South African Violence Returns As All Miners Demand Pay Hike
VIDEO (05:30) : Capital Account - Word of the Day: Exchange-Traded Fund (ETF) (explains the ETF - GLD in detail)
VIDEO (03:19) : Yahoo (BreakOut) – It’s Time to Go for Gold
Wyatt Research – The Definitive Hyperinflation List
PDF : Hera Research – Neil Barofsky: Another Financial Crisis All But Inevitable
AUDIO : FSN – Andy Hoffman – Infinite QE No One Gets What They Want
AUDIO (33:23) : McAlvany Commentary – QE to Infinity
Profit Confidential – Didn’t Get into Gold Early Enough? This Other Metal’s Your Second Chance
Xinhuanet – London offers to push yuan's globalization
CoinNews – Premiums Decline for US Mint Silver Coins as Melt Values Riser
VIDEO (25:50) : Casey Research – Legalized Plunder
Ricochet – Dr. Thomas Sowell discusses his new essay "Trickle Down Theory" and "Tax Cuts for the Rich"
09/18/12 - Bullion News
VIDEO (04:56) : Learn Liberty – Should We End the Fed (Link to the Video above)
321gold – He Who Hesitates Is Lost
Casey Research – When Money Dies...
Advisor Perspectives – Weekly Gasoline Update: Eleventh Week of Price Increases
VIDEO (11:57) : Got Gold Report – Kevin Warsh about the Fed
Money Management – The value of gold in an investment portfolio
The Daily Reckoning – The World’s #1 Money Printer
VIDEO (05:30) : Arabian Money – Why gold could hit ‘$2,000 relatively quickly’ as the Chinese and ECB follow Fed devaluation
Business Insider – How 9 Countries Completely Lost Control Of Inflation
Market Watch – Why QE3 makes retirees queasy
The Street – The Fraud of Negative Gold/Silver Lease Rates: Opinion
VIDEO (23:50) & Transcript : Silver Doctors – DAVID MORGAN: SILVER MOVING TOWARDS PAR WITH GOLD!
09/17/12 - Bullion News
CoinNews – Gold Dips from 7-Month High, US Silver Coins Rally
U.S. Global Investors – All Signs Pointing to Gold by Frank Holmes
VIDEO (14:37) : USA Watchdog – Jeff Berwick-0% Interest Rates Until the System Dies
Fast Markets – Gold pauses after heady QE3 rally, platinum slips as Anglo prepares restart
Casey Research – Where Will QE3 Take Us?
AUDIO : FSN - Gary Wagner – Markets Have Changed: Gold $2200 Soon
Summary & VIDEO (10:34) : Silver Doctors - Fiat Currencies – The Good, The Bad, and The Ugly: Dollar’s End Game is HERE!
Las Vegas Sun - Gold worth $7 million found in house after Nevada man dies
Commodity Online - ‘China’s Silver buying interest advances’
Forbes - A Ponzi Schemer Parts With His Silver
09/16/12 - Bullion News
The Daily Bell - David Morgan on the Value of Silver in an Upcoming Inflationary Depression
CHARTS - TECHNICAL ANALYSIS : World of WallStreet - Is Gold Overbought And The Two Month Outlook
The Globe and Mail - Copper/Gold Ratio: Stimulus Fever Skews Key Market Indicator
Jesse's Café Américain - Purchasing Power Of Various Currencies and Gold
The Economist - The global debt clock
09/15/12 - Bullion News
CoinNews - Gold Prices Add 1.9% on Week as Silver Gains 2.9%, US Gold Coins Soar
Business Insider - Ben Wins, Who Loses...The Fed Is Committed To Making Food And Gas Even More Expensive
VIDEO (05:59) : CNBC - Peter Schiff - "First the Fed Gave Us Operation Twist, Now they Got The Operation Screw"
Wealth Daily - Silver Goes Ballistic
VIDEO (02:24) : Yahoo (BreakOut) - America Is Facing a Lost Generation: Jim Rogers
Paper Money Collapse - Stimulus, to infinity and beyond
Daily Wealth - A big move in gold is coming...
VIDEO (54:25) : Chris Martenson Interviews - Janet Tavakoli: Understanding Derivatives and Their Risks
GoldScents - THE NEXT RECESSION WILL BE TRIGGERED BY OIL
09/14/12 - Bullion News
Deviant Investor - Gold is TOO Expensive! I Can’t Buy Now. WRONG!
VIDEO (28:01) : Capital Account - Deficit Spending and the "Coercion-Backed Greenback" with Edward Harrison
VIDEO (08:22) : Bloomberg - Faber: Fed Policy Will 'Destroy the World'
Motley Fool - Ride This QE3 Rocket to $2,000 Gold and $50 Silver
MineWeb - Watch platinum as it closes the gap on gold
VIDEO (02:46) : U.S. Global Investor - Frank Holmes on CNBC Asia Squawk Box: Lack of Fiscal Discipline May Drive Gold Higher
Enterprising Investor - Why the Current Account Deficit Helps Explain the Economics of QE3
Financial Sense - “Unlimited QE3” Quick Analysis
VIDEO (11:33) : Andrew Schectman on How to Avoid Gold Scams & How a COMEX Default will Change the Bullion Industry
CNBC - US Credit Rating Cut by Egan-Jones...Again
ZeroHedge - Inflation Expectations Suggest 5% Inflation Is In The Cards
Dollar Collapse - The Long Wave Versus the Printing Press: Central Banks Go All-In
Kitco - US Gold Production Rose 8% In June - USGS
Perth Mint Bullion - Platinum: History Of A Metal On The Move
Summary & VIDEO (06:44) : Silver Doctors - Bart Chilton Sends Warning Letter to Printer in Chief Bernanke
Ahead of the Herd - Bankers, Bankers, Bankers
09/13/12 - Bullion News
U.S. Global Investors - When You Should Stop Buying Gold by Frank Holmes
VIDEO (27:50) : Capital Account - Marc Faber on Hedging the Bernanke Put and QE3 with Gold, Land and Equities!
Trader Dan - The Fed and the ECB determine to Destroy the Middle Class
VIDEO (51:36) : Press Conference with Chairman of the FOMC, Ben S. Bernanke
Arabian Money - German court sharply restricts what the ECB can do to save the eurozone
Rick Ackerman - The Fed’s Wizard Behind the Curtain
Eric De Groot - Fed Pulls Trigger, to Buy Mortgages in Effort to Lower Rates
Inside Futures - Gold & Silver futures show fresh buy signals
VIDEO (08:30) : Bloomberg - David Stockman on Fed Policy, U.S. Budget Deficit
CoinWeek - The More Gold And Silver Prices Are Suppressed, The Higher They Will Rebound
The Daily Bell - James Grant Calls for a Gold Standard
09/12/12 - Bullion News
Article & VIDEO (67:05) : Business Insider - Hedge Fund Manager RAY DALIO: There's No Sensible Reason To Not Own Gold
Financial Sense - Fiat Money Is Immoral
Perth Mint Bullion - Sales Update: On Course For Sell Out At The Mint
247 Bull - Fed prepares to print $780 billion a year in open-ended stimulus
VIDEO (25:49) : "The Federal Reserve Is a Cartel" - G. Edward Griffin
POLL : Rasmussen Reports - 58% Lack Confidence in Fed To Keep Inflation Under Control, Interest Rates Down
Fast Markets - Technical Analysis - Dollar Index - Looking weak
Bullion Street - Platinum eyes sharp gains on supply concerns
VIDEO (17:04) : USA Watchdog - Hyperinflation is Virtually Assured – John Williams
Bullion Bulls Canada - German Court Caves-In To Euro-Zone Hyperinflation
CoinWeek - The World’s Most Popular Gold Coin
09/11/12 - Bullion News
247 Bull - The Single Best Reason to Own Gold
Seeking Alpha - Gold Bullion Vs. Gold Miners: The Truth Behind The Valuation Gap
CoinNews - 2012 Hawaii Volcanoes 5 Oz Silver Bullion Coin Sales Begin
SilverSeek - Silver Bars or Coins? What to Buy?
Wealth Daily - Gold and Silver Continue to Rock and Roll
Real Clear Politics - An Economic 'Plan'? by Thomas Sowell
International Man - Interview with former President Thomas Jefferson on Liberty
The Real Asset - Spaniards trust in gold over euro
Market Anthropology - Pavlov's QE Dog - Silver
First Coast News - Lake City police: Man arrested for selling stolen rare coins
Business Insider - The Complete History of the $20 Bill
Perth Mint Bullion - Will We Run Out Of Gold And Silver?
MoneyNews - Moody's Threatens to Cut US' AAA Rating if Federal Budget Deal Isn’t Reached
ZeroHedge - US August Budget Deficit Soars To $192 Billion, $1.17 Trillion In Fiscal 2012
Wealth Wire - The New California Gold Rush
The Royal Mint - The history of UK Bullion Coins – Sovereign and Britannia
The Gold Report - Is $1,740 Gold a Blip or a Trend? Notes from the Casey Research Summit
09/10/12 - Bullion News
Profit Confidential - Corporate Insiders Dumping Stocks at Alarming Pace
The Real Asset - What sparked your interest in gold?
Casey Research - Gold, the Dollar, and the Euro – The Bottom Line
VIDEO (14:27) : USA Watchdog - Greg Mannarino-You Are Going To See Inflation You Are Not Going To Believe
Seeking Alpha - Gold And Silver Surge On Anticipation Of More Central Bank Money Printing
VIDEO (04:13) : CNBC - Jim Rogers: Policy Makers Saying 'Same Old Garbage'
ZeroHedge - Gold In Euros Touches New Record High At EUR 1,360 Per Ounce
VIDEO (02:00) : Interview with Silver Guru David Morgan - Weak Jobs Number JOLTS Gold & Silver HIGHER
VIDEO (09:56) : Financial Sense - David Stockman: U.S. Faces Permanent Fiscal Cliff
Economic Noise - Bob Woodward Inadvertently Confirms The Coming Economic Apocalypse
The Acting Man - Credit Markets – Benign Reaction to the ECB’s Plans, But Dire Fundamentals Remain
VIDEO (02:36) : CNBC – Jim Rogers: They Teach You to Print Money at MIT
Gold and Silver Blog - Gold and Debt – What Would Benjamin Franklin Have Said?
CoinWeek - The Coin Analyst: The MS70 Debate Revisited
VIDEO (05:07) : U.S. Global Investors - Frank Holmes Talks Gold and Commodities on CNBC Asia Squawk Box
09/08/12 - Bullion News
CoinNews - Gold Jumps 3.1% on Week as Silver Soars 7.1%, US Bullion Coins Solid
examiner - Markets, Huge gains on gold, silver copper and metal prices
Silver Coins Today - Melt Values of American Silver Coins and Sets Surge
Business Insider - Merkel Is Getting Ready To Cave On Greece
ZeroHedge - 99 Years Of Keynesian-Monetarist "Winning"
Market Watch - How to follow the money in rare-coin collecting; Beware the pitfalls and pitches investors and hobbyists face
Science Daily - In Quest of the Cosmic Origins of Silver: Silver and Gold Materialized in Different Stellar Explosions
VIDEO (25:43) : Max Keiser - Keiser Report: Euthanized Economy
09/07/12 - Bullion News
VIDEO (06:44) : Bloomberg - Pimco's El-Erian Says Fed QE3 Likely This Year
Market Watch - Silver steals the spotlight from gold
CNBC - Silver Bulls Dig for the Mother Lode
VIDEO (04:18) : Commodities Guru Jim Rogers talks live from APEC Summit in Russia
azizonomics - Junkie Recovery
The Gold Report - Mike Niehuser's Gold Investing Lessons from Banking School
Money Show - Central Bankers Can't Save Us Now
Arabian Money - Gold and silver prices jump as bad jobs data puts QE3 back on the agenda for next week
Business Week - Argentines feeling trapped by currency controls
Market Watch - All that’s gold, glitters
09/06/12 - Bullion News
Silver Coins Today - 2012 Silver Coins Lead Sales, 2011 Un-circulated Silver Eagle Tops 300K
AUDIO (26:25) : GoldMoney - Mike Krieger on why gold and silver prices are headed much higher
CHART : Fast Markets – Technical Analysis - Silver - From strength to strength
Fox Business – Premature Celebration? Euro’s Hopes Hinge on German High Court
AUDIO : FSN – Andy Hoffman – Quadruple Bottoms… It’s All Good For Gold And Silver
Advisor One – Gold Up on ECB Hopes
Daily Mail – Family told ten rare Double Eagle gold coins worth $80 million obtained in 'uncertain circumstances' belong to the U.S. not them
VIDEO (11:18) : Bloomberg – Pimco's Gross: I'm Leaning Toward Gold Over Bonds
Bullion Street – Turkey gets back ancient Troy Gold
GoldSilver – Mike Maloney in Horrible Car Crash with Tesla
09/05/12 - Bullion News
Silver Investing News – Are We Running Out of Silver - "Is Future Silver Supply at Risk?"
VIDEO (28:05) : Capital Account – GATA's Bill Murphy on the JP Morgan Silver Shortage and the next Bullion Bank Run!
Bullion Street – PNG Warns Consumers about "Tribute Gold Coins" Advertised on TV
Stockhouse – Two things your broker doesn't know about Silver
AUDIO (35:22) : McAlvany Commentary – Bernanke in the Land of Oz
GoldSeek – Is Central Bank Buying Just a Driving Force Behind Gold or Much More?! – Part II?
Investor Place – Tracking GLD to gauge Gold's next move
AUDIO (10:42) : Talk Digital Network – Keeping Investment Risks Under Control
CMI Gold and Silver – Is gold getting ready to push towards a new all time high?
KPTV – What Happens When You Store Your Gold & Silver Coins in the Garage
09/04/12 - Bullion News
Silver Coins Today – American Silver Eagle Bullion Coins Rebound in August 2012 Sales
Trader Dan – Gold Hits $1700, Eases off a Bit
MineWeb – Gold could hit $1850 sometime in Q4 - GFMS
AUDIO : Sprott Money – John Embry: Interview with CFRAs John Budden
VIDEO (07:34) : Silver Doctors – Ned Naylor-Leyland: € Gold Break-Out an Indication Major Rally Has Begun
Gold Made Simple – Gold price about to re-enter its long-term trading range
Paper Money Collapse – U.S. Republicans introduce gold standard debate – mainstream media go mental
VIDEO (00:59) : Bloomberg – This Is What Going to the Gold Standard Looks Like
CoinWeek – Gold And Silver—I Told You So!
My Budget 360 – Student Debt Crisis at Tipping Point
Inflation Data – The Biggest Commodity: The College Degree and Academic Inflation
VIDEO (20:44) : Peter Schiff – Bernanke, Jackson Hole, Politics, QE, Debt, and Gold
Casey Research – What to Do When – Not If – Inflation Gets Out of Hand
321gold – Gold Makes Resistance Key Support
AUDIO : Sprott Money – Eric Sprott: Interview with CFRAs John Budden
Washington Times – Federal debt tops $16 trillion, Treasury Dept. says
Rasmussen Reports – Rasmussen Employment Index Falls to Ten Month Low
Reuters – South Africa police fire teargas as mine unrest spreads
09/03/12 - Bullion News
TECHNICAL ANALYSIS : GoldScents – HAS QE3 ALREADY BEGUN? GOLD & COMMODITIES MAY BE SAYING YES.
The Telegraph – Federal Reserve has already started QE3, says investor Jim Rogers
ZeroHedge – First Platinum, Now Gold: As South African Miners Strike Spreads, Thousands Of Ounces Remain In The Ground
VIDEO(s) : Perth Mint Bullion – 2013 Kookaburra, Lunar Bullion Coin Releases Available Today
MineWeb – Silver gives you more - at least potentially
The Independent – Lawyer 'helped in £730,000 scam' over school to buy gold
SafeHaven – The Gold Price and the Exponential Growth of Our Problems
Bloomberg – Gold Wagers on Rally Jump to Five-Month High on Stimulus
09/01/12 - Bullion News
CoinNews – Gold Surges 4.5% in August, Silver Soars 12.6%, Bullion Coins Rally
TECHNICAL ANALYSIS : Inside Futures – Gold & Silver show fresh buy signals
Washington Post – Ben Bernanke should return the Fed to its golden roots
VIDEO (02:28) : Bloomberg – This IS Your S&P 500…On Inflation (S&P / Gold Ratio w/ Jim Rickards)
azizonomics – The Shape of 40 Years of Inflation
Business Week – Euro-Area Unemployment at Record 11.3%, Inflation Quickens
Ludwig von Mises Institute – The Theory of Money
Bloomberg – Bernanke Defends Bond Purchases in Signal of More Fed Easing
08/31/12 - Bullion News
The Golden Truth – The Action in Metals Today
The Daily Caller – Bernanke: QE3 possible, cost-benefit approach to be taken
CoinNews – 2013 Year of the Snake Gold Bullion Coins from Perth Mint of Australia
PDF : U.S. Global Investors – Gold; First Mover Advantage by Frank Holmes
ZeroHedge – Friday Humor: Gold Is A Barbeque Relish
VIDEO (08:35) : USA Watchdog – Ron Hera-We’re at 2008 crash levels
NuWire Investor – Platinum Investment’s Powerful Draw
MineWeb – SA mine unrest widens, contagion fears rise
24/7 Bull – Governments have it backwards. It’s lowering taxes that increases revenue not raising them
Casey Research – Goodbye, US Debt Ceiling, We Barely Knew Ya
My Budget 360 – When the Financial Clock Strikes Zero - Half of Americans Die Broke
VIDEO (04:55) : Yahoo (BreakOut) – Americans Will Demand a Return to the Gold Standard, Predicts Peter Schiff
The Prospector Site – #1 REASON SILVER & GOLD WILL GO HIGHER
Investor Place – Gold vs. Silver: Which Is the All-Time Champ?
Perth Mint Bullion – Can My Wife/Partner/Father/Mother Sign For My Bullion If I’m Not In When It Is Delivered?
08/30/12 - Bullion News
Money News – Ahead of Bernanke Speech, Fed's Plosser Notes Risk of More Easing
CoinNews – US Mint Sales: Demand Rises for Collector and Bullion Gold Coins
Sovereign Man – Some clear thinking on the debt
Bullion Vault – Dr Copper's China Diagnosis
VIDEO (04:23) : Bloomberg – Walker: Dollar Outlook Hinges on Bernanke Speech
POLL : Rasmussen Reports – Just 16% See A Better Future for Today's Children
24/7 Bull – From boom to bust: How credit shaped the past & how it will shape the future
Reuters – U.S. states' debt tops $4 trillion-report
The Gold Report – Will Expert David Morgan Call the Bottom on the Metals Market Again?
08/29/12 - Bullion News
PDF : U.S. Global Investors – Love Trade Cools as Central Banks' Gold Demand Heats Up! by Frank Holmes
AUDIO (44:00) : McAlvany Commentary - Bill King : Trader's perspective A crucial conversation
MineWeb – The current state of platinum's supply demand balance - CPM Group
Fast Markets – Technical Analysis - Gold - Still consolidating recent gains but holding up well overall
Real Clear Politics – A Rational Discussion of the Federal Budget by Thomas Sowell
Daily Wealth – The Two Things Your Broker Doesn't Know About Silver
VIDEO (04:47) : Market Watch – "Helicopter Ben is Back" - Editorial board member Mary Kissel on Ben Bernanke's letter to Darrell Issa
Business Insider – China Could Soon Announce That Their Gold Reserves Have Doubled
MineWeb – Gold, China and the commodities super cycle - Jim Rogers
Investors Chronicle – Gold: to have and to hold
Money Morning – Is Gold Still “The Next Greatest Trade Ever”?
VIDEO (05:21) : Got Gold Report - Rick Rule – Artificial Liquidity Propping up Markets
Gold Investing News - Gold in an Election Year
08/28/12 - Bullion News
The Golden Truth - The US is in Much Worse Shape than Europe
Sprott Asset Management - NIRP: The Financial System’s Death Knell?
Seeking Alpha - 1 Oz Gold Valued By U.S. Currency In Circulation And Outstanding Debt
Numismaster - Watch Out: Premium Can Disappear
Casey Research - Your Window to Buy Below $1,700 Is Closing
ZeroHedge - QE3 Mechanism Is Broken
Liberty Blitz Krieg - 28,000 “Cash For Gold” Outlets in Italy as Serfs are Forced to Sell
SafeHaven - The Gold Standard Gets Another Look by Peter Schiff
VIDEO (03:35) : JS Mindset - Louise Yamada Predicts Gold's Future
08/27/12 - Bullion News
Paper Money Collapse - More QE is on the way – The central banks are digging themselves a deeper hole
U.S. Global Investors - Gold: First Mover Advantage by Frank Holmes
VIDEO (02:30) : CNBC - Santelli's Rant on More Quantitative Easing
VIDEO (03:48) : Perth Mint Bullion - Perth Mint Unveils 2013 Australian Bullion Coin Program
The Globe and Mail - Gold short positions fall to lowest level since May Add to ...
The Gold Report - Eric Sprott Cautions Investors to Fear the Financial System
VIDEO (04:35) : Forbes - Steve Forbes discusses "Freedom Manifesto: Why Free Markets Are Moral And Big Government Isn't"
Reuters - Dallas Fed President Fisher commissions paper to bolster easy money opposition
Calculated Risk - Cleveland's Fed President Pianalto discusses Benefits and Costs of QE3
OPB - Thieves Take Scrap Metal From Eugene Students' Fundraiser
MineWeb - Jeff Nichols: ‘No gold bug - just super bullish'
Ludwig von Mises Institute - Keynesianism vs. the Gold-Coin Standard
AUDIO (12:34) : Ellis Martin Report INTERVIEW with David Morgan: 30 and UP
08/25/12 - Bullion News
TECHNICAL ANALYSIS : SafeHaven - Hedgers & Speculators - "Contrary Gold Futures"
AUDIO (23:21) : TFMetals Report - Turd Ferguson Interviews David McAlvany of McAlvany Financial Group
24/7 Bull - Investment strategy: Getting wealthy vs. staying wealthy
VIDEO (25:44) : Max Keiser - Keiser Report - Debt Bomb
Commodity Online - PGMs likely to benefit further from South African output issues: HSBC
AUDIO (08:34) : Interview with David Morgan - SILVER Update, I called the BOTTOM, watch for RESISTANCE at $32
Silver Vigilante - CNBC & Rasmussen Polls - Americans favor return to the Gold Standard
Reuters - Turkey raises gold reserves by 18 pct in July-IMF
VIDEO (03:05) : Peter Schiff 2012 - Silly Blond and her Charts, has never bought Gold
08/24/12 - Bullion News
AUDIO (20:38) : GoldSeek Radio's Chris Waltzek talks to Silver Guru DAVID MORGAN
Reuters - Bernanke says Fed has scope to provide more stimulus
SafeHaven - Gold and the $600 Billion Question
Summary & VIDEO (11:47) : ETF Daily - Peter Schiff: Major Development In Metals; “The Time To Buy Cheap Will Soon Be Gone”
321gold - Fractal Gold Report
Business Week - Brink’s to Open One of Largest Bullion Vaults as ETPs Climb
Wyatt Research - Alert: Silver on the Move
ZeroHedge - Guest Post: A Gold Standard: Easier Said Than Done
Bullion Street - Investor exhaustion hit China Gold demand
VIDEO (04:15) : Wealth Wire - Jim Rogers Isn't Going to Argue With Thousands of Years of Stupidity
The Gold Report - Doug Casey Predicts Day of Economic Reckoning Is Near
CNBC - 'A Lot of Reason' for More Easing, Says Fed's Evans
MoneyNews - Analysts: Why No More Easing Would Be a Good Thing
Business Insider - Okay, Folks, Let's Put Aside Politics And Talk About Taxes... [CHARTS]
08/23/12 - Bullion News
CoinNews - US Mint Sales Figures: Proof Silver Coins Jump
Sovereign Man - Why you always want physical EVERYTHING…
Perth Mint Bullion - Six Trading Days Left To Secure Dragon Bullion Coins
Smart Money - What Fed Action Would Mean for the Dollar
Mish's Blog - Trends in Interest Rates on National Debt Suggest Currency Crisis is Coming
ZeroHedge - Gold And Silver Surge Above 200DMA
CoinWeek - The Coin Analyst: Precious Metal Bull Run Likely to Continue
Trader Dan's Market Views - Silver Tacks on the "30" Handle
Daily Reckoning - The United States and Argentina: Lost Like Tokyo
VIDEO (52:04) : Casey Research - Interview with Doug Casey and his Ten Tips on Speculation and Life
08/22/12 - Bullion News
Alphaville - FOMC minutes
MineWeb - U.S. silver output plunges between January and May-U.S.G.S.
VIDEO (46:48) : Marc Faber's forecasts for the global economy
ETF Daily - Why A Gold Supply Crisis Looms?
Golden Truth - Gold (and silver) Is Getting Ready For Big Move
AUDIO (61:47) : Voice America - Interview with Chris Powell of Chris Powell of the Gold Anti Trust Action Committee (GATA)
Merk Funds - Gold: Escape from Slavery
VIDEO (03:12) : CNBC - Gold Regains its Glitter
GoldSeek - Financial Alchemy and Fraud in Gold
MineWeb - Serious issues afflicting the Platinum Industry as a whole - RBPlat CEO
AUDIO (20:34) : Talk Digital Network - Lack Of US Fiscal Policy Damaging
Fox Business - Pimco Adds to Gold Holdings on Inflation Concerns
Inflation Data - Inflation Definitions
CoinWeek - LIBOR Scandal Investigation Sparking Higher Gold And Silver Prices
Wealth Wire - Rothschild, Paulson and Soros All Betting on Coming Financial Disaster
VIDEO (17:05) : USA Watchdog - Nick Barisheff – $10,000 Gold within 5 Years
New York Times - Inflation Should Be Feared
Bloomberg - Many on FOMC Favored Easing Soon if No Pickup in Growth
08/21/12 - Bullion News
CoinNews - 2012 Acadia National Park 5 Oz Silver Coins Enjoying Stronger Sales
VIDEO (25:54) : Silver Doctors - Ned Naylor-Leyland: Gold & Silver Parmanent Backwardation Omen of Total Meltdown
321gold - Gold's Little Brother Is Talking
Gold Made Simple - Gold price itching to break higher as silver price touches $29
Article & VIDEO (01:29:27) : CMI Gold and Silver - So many fallacies. So little time.
Market Watch - Are gold cycles turning up with easy money?
Arabian Money - S&P 500 ready for 10% correction and bad 2013 says Marc Faber
The Globe and Mail - Skeptics show flaws in the Fed model
American Thinker - Funding Failure
Wealth Wire - Is China Preparing a Gold Standard?
ZeroHedge - Gold Breaks To Three Month Highs
PDF : Investors Digest - John Embry "Gold Increasingly Likely to be in Short Supply"
VIDEO (12:39) : Silver Guru - David Morgan INTERVIEWED on The Keiser Report
SilverGold Bull - Precious metals “break-out”: is this the Real Deal?
Bloomberg - How Volcker Launched His Attack on Inflation
08/20/12 - Bullion News
CoinNews - Gold Starts Week Higher, Silver Rallies 2.1%, US Coins Surge
SafeHaven - Long-Term Technical Outlook for Gold and Silver
Gold Versus Paper - Trade of the Year - Gold Versus Paper
MineWeb - Central bank gold buying and the importance of investment demand - says WGC's Marcus Grubb
GoldSeek - Gold and Silver Shine on Weaker U.S. Dollar
Money Morning - Why Investors Are Hoarding Silver
Trader Dan's Market Views - Stealth Mode Rally in Silver Maybe not so Stealthy Anymore
ZeroHedge - Silver Jumps To Two Month Highs As Oil Reverts
VIDEO (11:51) : Casey Research - This Banker Is Buying Gold
Ludwig von Mises Institute - Hyperinflation Is Not Inevitable (Default Is)
Seeking Alpha - Silver May Be A 'Poor Mans Gold' But It Could Still Make You Rich If You Invest Now
US Global Investors - Love Trade Cools as Central Banks’ Gold Demand Heats Up by Frank Holmes
08/18/12 - Bullion News
Casey Research - Big Changes Ahead: Gold Just Became Money Again
VIDEO (15:08) : TECHNICAL ANALYSIS : Strategy is Everything: Chart This! w/ Gary Wagner
Taipei Times - Platinum price spikes on deadly strike in S Africa
The Golden Truth - Friday Chart Porn
CoinWeek - Gold’s performance reflects continued challenging economic climate
ZeroHedge - US Treasury Admits It Conducted A Circular Ponzi Scheme For Years
Virtual Economic Conditions - Precious Metals IRA Gaining Momentum on Gloomy Economic Conditions
08/17/12 - Bullion News
Ahead of the Herd - The "Fear" Trade
AUDIO : FSN - Mark Faber – Financial Survival Is About Diversification And Personal Survival
The Globe and Mail - Silver showing signs of a breakout Add to ...
Silver Coins Today - 2013 Pronghorn Antelope Silver Bullion Coin Fifth in Canadian Wildlife Series
Gold Alert - “The US dollar must be devalued in order to shrink the destructive power of debt”
The Source (WSJ) - Gold’s Volatile Mood
SafeHaven - In A Paper System, All Assets Are Backed by the Treasury Bond
CoinWeek - Newly Emphasized Gold And Silver Price Suppression Tactic Unleashed
MoneyNews - Moody's: Risks of California Muni Bankruptcies Rising
CoinNews - 2012 .99999 Gold Maple Leaf Bullion Coin Marks Anniversary
ZeroHedge - “Gold Ponzi Schemes” Revealed - Physical Gold Favored Over Derivatives
Total Investor - Silver Quietly Sneaking Higher
Truth in Gold - Gold Not Money? CME Clearing Europe To Accept Gold As Collateral
Perth Mint Bullion - World Gold Council: Gold Demand Trends Second Quarter 2012
08/16/12 - Bullion News
Financial Sense - How to Introduce a Gold Standard
VIDEO (02:20) : The Street - Gold Prices Surge on Dollar Weakness
321gold - The Gold Price for the Next 16 Years
Gold Made Simple - Gold price drifts higher as Poland shows the importance of physical deliverable gold
Article & VIDEO (11:41) : Wealth Wire - Silver Hoarding: Investor Holdings Spike to Record
VIDEO (05:29) : Arabian Money - Gold heading past $2,000, silver to new high, says Swiss Asia Capital
POLL : Rasmussen Reports - 37% Are Confident in Fed To Keep Inflation Under Control
Street Talk Live - Gold, Dollar & Rates Say No QE
Daily Reckoning - Dogged by Nixon’s Dollar
Gold Silver Worlds - Gold price of $10,000: Is it possible or not?
Bullion Vault - What Determines the Gold Price?
Minyanville - Three Alternative Currencies Gaining Traction
ZeroHedge - Guest Post: What To Do When Every Market Is Manipulated
08/15/12 - Bullion News
AUDIO (07:55) : David Morgan Interviews Patrick MontesDeOca from the CMT Group - Part 1
AUDIO (08:39) : David Morgan Interviews Patrick MontesDeOca - Part 2 Answering Listener Questions
SilverSeek - If you have to own one precious metal buy silver not gold
International Man - After the Storm (Part 1 of 2)
Market Watch - When will the euro collapse? It’s already dead
Bullion Vault - Rats Don't Eat Gold Bullion
VIDEO (03:22) : CNBC - Paulson & Co. Increases Stake in SPDR Gold
ZeroHedge - Aaaand It's Gone: This Is Why You Always Demand Physical
Business Insider - George Soros Called Gold The 'Ultimate Bubble' Just Two Years Ago

Affiliate Ad
08/14/12 - Bullion News
Numismaster - Fake Round Can Cause Real Problem
VIDEO (28:03) : Capital Account - Neil Barofsky on the On-Going Bailout of Wall Street and the lack Criminal Prosecutions
Market Watch - Dollar up after solid U.S. data
Silver Investing News - Silver Manipulation: Closure Ahead?
Mish's Blog - Germany 6% Current Account Surplus a "Threat to the Continent" Says EU Commission; Solution is Gold Coupled With Eurozone Breakup
GoldSeek - Five Reasons Why The Government Is Destroying The Dollar
US Global Investors - Which Way Will the Pendulum Swing for Gold?
VIDEO (03:25) : Fox Business - Faber: Too Much Government is U.S. Economy's Biggest Problem
CoinWeek - Quiet Gold Market Needs Big Bang
The Real Asset - What does debt really mean for the economy?
08/13/12 - Bullion News
Washington Times - Inflation: Lies, Damned Lies, and Statistics
Inflation Data - What Is Fiat Currency?
Eric De Groot - Buy When Dumb Money Sells Silver and Vice Versa
GoldSeek - Ron Paul; Legalize Competing Currencies
Rick Ackerman - Treading Water on a Sea of Funny Money
VIDEO (11:56) : Jesse's Café Américain - How Andrew Jackson Killed the Second Bank of the United States
Wealth Wire - Peter Schiff Opens Gold Bank
Mish's Blog - Percentage Growth in Government Jobs vs. Private Jobs vs. Population Growth; Facts and Consequences
CNBC - Problems Riddle Moves to Collect Credit Card Debt
Scotsman - Comment: More golden moments to come for investors
Acting Man - Gold, Silver and Gold Stocks
CHARTS : TECHNICAL ANALYSIS : GoldScents - BULLS STILL IN CONTROL, BUT TIME IS RUNNING OUT
Bullion Vault - Keynesians vs Gold Bullion
08/11/12 - Bullion News
Coin News - Gold, Silver Notch Weekly Gains, Eagle Silver Coins Improve
Fast Markets - Technical Analysis - Gold - Still struggling
Gold Alert - “The Fed is the epicenter of the financial disaster”
Gold and Silver Blog - Platinum Perspectives – Time To Buy Or Will The Bears Win?
Sprott Management - The Solution…is the Problem, Part II
Wealth Daily - Constitution, What Constitution?
Bullion Street - Bullion market marking time until US Fed symposium
VIDEO (28:03) : Capital Account - Gerald Celente on Eurozone Reckoning Day and dropped charges for Goldman Sachs!
08/10/12 - Bullion News
AUDIO : FSN - David Morgan – It’s Beginning To Look Like The Precious Metals Bull Market Lives On
Seeking Alpha - Silver Net Short Positions Rising: Prepare Yourself For A Coming Silver Bull Market
ZeroHedge - Cash Out Of Gold And Send Kids To College?
Resource Investor - The Dumb Money Hates Silver, It’s Time to Go Long
MineWeb - Platinum: gold ratio falls further
VIDEO (04:38) & Article : Yahoo Finance - U.S. Government Debt Grows $10 Million a Minute: David Walker
Profit Confidential - Think Housing Is Safe Again? This Will Change Your Mind
Summary & VIDEO (05:08) : Future Money Trends - Bernanke Says Student Loans Won't Cause Crisis
Whiskey and Gunpowder - The “New” Migration To Gold And Silver
08/09/12 - Bullion News
GoldSeek - Gold and silver are still the ultimate reserve currency
The Sovereign Man - Why dost thou whet thy knife so earnestly?
The Gold Report - There Is More to Gold than Mere Capital Appreciation: John Hathaway
SilverSeek - The CFTC Silver Investigation by Ted Butler
Money Show - Peter Schiff; Has Fed Action Helped or Hurt the US?
Mish's Blog - Camden NJ, Population 77,344 Fires Entire Police Force, 270 Officers; Why Cities are Going Bankrupt
ZeroHedge - Gold, Silver, Corn, And Brent Are Best Performers On The 5-Year Anniversary Of The Great Financial Crisis
Whiskey and Gunpowder - Got Physical Gold?
Hinde Capital - Gold Poised for Upside Breakout of Current Range
Truth In Gold - CFTC’s Chilton the Only One Positive on Action
Perth Mint Bullion - Then, As Now, Silver's Course Dangerous To Predict
Commodity Online - Gold remains range bound, but sentiment to swing in its favor: UBS
NBC News - You've just won a gold medal! So why are you trying to eat it?
08/08/12 - Bullion News
Wealth Daily - Silver Backwardation Explained...(Silver Is About to Rocket Higher, Silver Is Now in Backwardation)
VIDEO (17:36) : USA Watchdog - Charles Biderman-What else is there besides gold?
Casey Research - Could Gold Be Tripped Up by a Coming Deflation? - Interview with Jim Puplava
CoinNews - Gold, Silver and Other Precious Metals Log Modest Changes
Fast Markets - Technical Analysis - Gold/Silver Ratio - Paused, or about to stall
Seeking Alpha - Gold Outlook Still Bullish And Ripening For Melt Up
Howe Street - Doug Casey - Governments Are Out of Control
The Prospector Site - THREE PREDICTIONS SOON TO SEND GOLD HIGHER
My Budget 360 - US Dollar Already Went Off a Fiscal Cliff
CMI Gold and Silver - Boston Fed Head calls for “open-ended” quantitative easing
Free Gold Money Report - The Fiat Currency Bubble seals the euro’s fate by James Turk
News Track India - Jewellery trade thrives in Rajasthan despite rising bullion prices
VIDEO (27:51) : Capital Account - GATA's Chris Powell on the Silver Manipulation Probe & the Fed Gold Audit!
08/07/12 - Bullion News
Daily Finance - CFTC Commissioner Bart Chilton Comments on the Silver Investigation
Summary & VIDEO (08:39) : ZeroHedge - Putting A Face To Einstein's Definition Of Insanity
MineWeb - Gold will hit new highs in 2013 and beyond - Blanchard
azizonomics - Gold, Price Stability & Credit Bubbles
Libertarian News - People Now Pay In More To Social Security Than They Take In Payouts
Article & VIDEO (04:46) : Yahoo Finance - US Needs The Devaluation of the Dollar
SafeHaven - Money Printing Doesn't Create Jobs by Michael Pento
Mining - Mexico’s record gold production takes it closer to new bullion superpower status
The Golden Truth - To Be Or Not To Be, Is The Silver Market Truly Free?
Bullion Street - SGE to set up new Gold bullion platform to help investors
08/06/12 - Bullion News
Casey Research - Is a Strong Dollar Trouble for Gold?
Iacono Research - Gold Investors: Patience is the Most Important Commodity
Bullion Street - CFTC to end Silver price manipulation probe
VIDEO (11:22) : USA Watchdog - One-on-One with Silver Guru - Eric Sprott
The Real Asset - The week ahead – further data will make gold shine
VIDEO (01:30) : Arabian Money - How gold and silver prices are joined at the hip
VIDEO (35:41) : Physical Gold: antidote against the ongoing global debt crisis (summary)
VIDEO (88:18) : Physical Gold: antidote against the ongoing global debt crisis (full unedited version)
MineWeb - If hyperinflation ahead gold to $10,000 - if deflation, $2,000 - Taylor
VIDEO (02:03) : Wyatt Research - The Only Thing to Fear
Business Insider - Unregulated Government Lending Is Completely Out Of Control
Fox News - Does audit show Federal Reserve Bank sitting on $21 billion in gold?
08/05/12 - Bullion News
The Daily Bell - Ranting Andy on 'Gold as Money' and What to Do Now to Protect Yourself Before It's Too Late
Dubai Chronicle - Silver Price Actions Consolidation Pattern
ZeroHedge - On This Day In 2016
Daily Wealth - A 20% Gain in Just Three Months – Trading This Hated Metal
Gold Alert - $1,900 Gold by Year-End, Says HSBC
VIDEO (05:00) : Yahoo (BreakOut) - Election or Not, QE3 Is Coming in September: Economist
Commodity Online - Platinum-Gold ratio falls to lowest levels since 1985: Barclays
The Source (WSJ) - Tough Week for Copper
08/03/12 - Bullion News
The Street - Gold Climbs as Unemployment Rate Rises
GoldMoney - Turd Ferguson and Alasdair Macleod on the end of the Great Keynesian Experiment
CNBC - Gold to Rally Above $1,900 by End 2012: HSBC
Money Talk News - 15 Ways to Keep Your Home Safe When You’re Gone
CoinWeek - The Coin Analyst: America the Beautiful Five-Ounce Silver Coin Sales in 2012
LA Times - What's in your vault? Uncle Sam audits its stash of gold at the New York Fed
MineWeb - Sprott Physical Silver Trust offer underwriters take up additional units
Smart Money - Markets Guru Arnott: Inflation Will Triple
08/02/12 - Bullion News
CoinNews - Gold Slips Below $1600, Silver Under $27, US Bullion Coins Up
Action Institute - The Prospects of More QE for Economic Stimulus: A Lesson from History
GoldSeek - Gold and silver facing an exceptionally volatile autumn?
AUDIO (19:23) : FSN - Mickey Fulp’s Masterful Monthly Market Review
Mish's Blog - San Bernardino Files Chapter 9 Bankruptcy Petition; Pension and Medical Liabilities Impossible to Meet; Major Wave of Municipal Bankruptcies Has Begun
AUDIO (10:00) : Talk Digital Network - Low Spirits in Precious Metals
Forbes - Deadly Gold Scam Used Cyber-Currency
Silver Gold Bull - The Tortoise and the Hare
forUm - National Bank of Ukraine to expand its range of bullion coins
SafeHaven - Priced For Collapse
08/01/12 - Bullion News
Bullion Vault - 30% Gold Investment "Needed to Defend Your Portfolio"
VIDEO (28:02) : Capital Account - Mike Maloney tells Ben Bernanke to "Quit and Close the Federal Reserve!"
321gold - Challenging the Paradigms of Investing
NewsMax - Fed Says Economy May Need Help But Keeps Policy on Hold
Market Watch - Silver set to rally amid forced reflation
ETF Daily - Gold Prices: Why Have Gold Bugs Been So Wrong?
Gold and Silver Blog - Gold Bullion Coin Sales Plunge 50% In July, Silver Sales Off 20%
VIDEO (02:09) : CNBC - Fear, Greed & Gold
Wealth Wire - Warning for Gold Coin Buyers
VIDEO (02:50) : Wyatt Research - The Corn Conspiracy
Dollar Collapse - Welcome to the Currency War, Part 3: US Corporate Profits Plunge
Arabian Money - The cult of inflation has just begun says Bill Gross
ZeroHedge - What The US Government Spends Its Money On
Summary & VIDEO (05:37) : CMI Gold and Silver - The federal budget cannot be balanced
CoinWeek - GATA Files New Freedom Of Information Act Document Requests
07/31/12 - Bullion News
The Tennessean - We need Milton Friedman's wisdom today by Thomas Sowell
VIDEO (29:01) : Milton Friedman on Hayek's "Road to Serfdom" 1994 Interview 1 of 2
VIDEO (29:19) : Milton Friedman on Hayek's "Road to Serfdom" 1994 Interview 2 of 2
CoinNews - 2012 Acadia National Park 5 Oz Silver Bullion Coin Sales Begin
MineWeb - The bottom is probably in for silver - says Silver Guru David Morgan
The Real Asset - Saving the terminally ill
Merk Funds - Gold at ECB: Accident or Strategy?
Bullion Vault - Gold Prices "Could Be Under Pressure" from Central Bank Meetings, Fed "Can Sit Tight" But Draghi "Must Put Money Where Mouth Is
ETF Daily - Investing In Silver: States Support Move To Metals As U.S. Dollar Weakens
Numismaster - Scandal to Push Gold Coins Higher?
Casey Research - Interview with Jim Puplava; Deflation? Don't Count On It…
Rasmussen Reports - Rasmussen Employment Index; Employment Index Slips to 2012 Low
Wealth Daily - Gold Will Fly on QE3
ZeroHedge - The Fed On Gold Price Manipulation
Gold and Silver Blog - 75% Of Americans Believe The Fed Should Be Audited – Why It Won’t Happen
Royal Mint Blog - The Olympic and Paralympic victory medals – the facts behind the medals
Rick Ackerman - Stocks Galloped Higher in 1929, Too
SafeHaven - Mr. Bernanke Has To Know!
Truth In Gold - Most Accurate Gold Forecasters Split
Profit Confidential - U.S GDP Growth Falls 25%; What Happens Next
Libertarian News - The Insanity of Spending as a Measure of Growth
07/30/12 - Bullion News
Wall St Cheat Sheet - Gold and Silver Lessons from Pawn Stars
Article & VIDEO (13:53) : MoneyNews - Eric Sprott: US In a Recession, and Stimulus Policies Won't Help
Market Watch - Is gold getting ready for take-off?
Financial Sense - What Keeps the Free Market Free?
VIDEO (10:40) : USA Watchdog - One-on-One With Rick Ackerman
VIDEO (11:22) : Future Money Trends - Challenging the Deflation Godfather, Robert Prechter Interview
ZeroHedge - The World’s Gold Is Moving From West To East
Bullion Street - Vietnam to ban 'Gold in and Gold out'
dshort - Real GDP Per Capita: Another Perspective on the Economy
07/28/12 - Bullion News
CoinNews - Gold, Silver, and Eagle Bullion Coins Rebound for Week
Financial Sense - Technician Louise Yamada: It’s A Very Difficult Market-You Don’t Want To Be Short
Liberty Blitz Krieg - My Response to a Gold Hater
Arabian Money - Why the gold bears have got it completely wrong
VIDEO (28:03) : Doug Casey on Crisis Investing, Political Risk, and a Benign Anarchy!
07/27/12 - Bullion News
CNBC - Are Fiat Currencies Headed for a Collapse?
Wealth Wire - What "Disaster Economics" Means for Your Investments
Dollar Vigilante - Auditing The Fed is Like Auditing a Mafia Counterfeiting Operation
VIDEO (25:46) : Max Keiser - Keiser Report: Jellyfish Rat-Heart Robot Bankers
VIDEO (33:29) : John Williams of Shadowstats.com Interview: The Next Crash Will Be A Lot Worse!
INFO-GRAPHIC : Visual Capitalist - Global Gold Mines and Deposits Ranking 2012
ZeroHedge - In Q2 America Added $2.33 In Debt For Every $1.00 In GDP
Gold and Silver Blog - Would Auditing The Fed Send Gold Higher?
VIDEO (28:04) : Capital Account - From Natural Resources to Currency Wars w/Rick Rule & Jim Rickards
Ahead of the Herd - A Food Report
07/26/12 - Bullion News
AUDIO (12:32) : FSN - David Morgan On The Road Again – Upcoming CFTC Silver Report A Non-Event
USA Watchdog - Mainstream Media Recovery Hoax
Wyatt Research - Five Unbelievable Facts about the Spanish Debt Crisis
Bullion Street - Silver to significantly outperform Gold in few years
CoinWeek - Huge Physical Gold Shortage Looms
VIDEO (04:22) : Fox Business - U.S Economy: More Money, More Problems?
07/25/12 - Bullion News
CoinNews - Gold Jumps Above $1600, Silver Eagle Coins Top 19M
The Motley Fool - Unlike Big Banks and Bigger Governments, Gold Doesn't Lie
VIDEO (07:01) : CNBC - Gold Could Hit $2,100 By Year End
Perth Mint Bullion - Expect Investment Coin Shortages Should Mass Market Demand Emerge
VIDEO (02:04) : Bloomberg - Where is Gold Going? Ask the Euro
AUDIO (59:38) : Stansberry Radio - The Coming of the World Depression - Interview with Eric Sprott
VIDEO (02:43) : Wyatt Research - The Secret Financial War
Bloomberg - Former Citigroup CEO Weill Says Banks Should Be Broken Up
MineWeb - Standard Bank's Marc Ground looks at the state of the South African platinum sector, the outlook for prices and the likelihood of further mine closures
AUDIO (01:46:49) : Interview and Lecture by G. Edward Griffin - Author of The Creature From Jekyll Island
Sovereign Man - Why do we need a central bank?
Huffington Post - Olympic Gold Medal Worth $650 Melted Down
VIDEO (28:05) : Capital Account - Marc Faber on a Global Crash, the U.S. Treasury Bubble and China's Slowdown
07/24/12 - Bullion News
CoinNews - Gold, Silver Down; American Gold Eagle Coins Rise
Hard Assets Investor - Less Volatile Gold Poised To Benefit As Eurozone Crisis Reaches Critical Stage
Barron's - Coming: The End of Fiat Money
Wyatt Research - One Major Mainstream News Outlet That Doesn’t Understand Gold
MineWeb - How will gold and silver prices perform in a shrinking, debt-distressed world?
Seeking Alpha - Gold Prices On Hold As U.S. Dollar Strengthens
Wealth Wire - Gold Continues to Move Towards the Financial System
POLL : Rasmussen Reports - 45% Fear Federal Government Will Do Too Much To Help Economy
The Daily Gold - Anatomy of Future Gold & Silver Bubble
BullionVault - Policymakers "Recognizing New Financial Uses" for Gold Bullion
Market Oracle - Defining “Intrinsic Value” in Gold and Silver Investing
Total Investor - 5 Straight Years of $1 Trillion Deficits!
ZeroHedge - On Gold And The US Debt Trap?
Casey Research - China, Metals, and Your Money
CNBC - In Euro Zone, Debt Pressure Tightens Grip
CMI Gold & Silver - Gold for Grabs
07/23/12 - Bullion News
SilverSeek - The War on Silver by Ted Butler
VIDEO (01:31) : CNBC - Gold Finishes Off Lows
Coin Update - Release Dates for 2012 America the Beautiful Five Ounce Silver Bullion Coins
The Real Asset - The calm before the storm
Commodity Online - Swiss Palladium exports hit new high for 2012: HSBC
Profit Confidential - Fourth California Bankruptcy Comes Knocking
Investment Rarities - WHISTLING PAST THE GRAVEYARD
SilverSeek - China Precious Metals Strategy
Mish's Blog - Full Spanish Bailout Coming Up; New Record High Yields on Spanish Bonds; Misguided Faith in Can-Kicking
07/22/12 - Bullion News
Eric De Groot - The Boat of Irresponsibility Has Many Passengers
Dollar Collapse - Still Think That Money Market Fund Is “Cash”?
The Golden Truth - Weekly Chart Porn - Uber-Bullish Silver Signals
Financial Sense - Safely Stashing Cash in a Near-Zero Rate, High-Risk Environment
IBTimes - Lear Capital: Silver’s Best Kept Secrets
Market Watch - Copper fares better than gold and silver
Paper Money Collapse - Happy interventionists: The economists’ attack on your property
07/21/12 - Bullion News
AUDIO (13:50) : Ellis Martin Report with David Morgan--Silver: Are you in? Sprott and the Chinese are!
azizonomics - Why is the Fed Not Printing Like Crazy?
Oregon Live - In times of low returns, are investors more gullible?
The Prospector Site - FLASH MOBS SOON TO FIND SILVER & GOLD
Wall St. Cheat Sheet - SILVER: A Metal of Sunken Treasure and Champions
07/20/12 - Bullion News
VIDEO 28:51) : Future Money Trends - Doug Casey Interview: Governments are Igniting Bubbles
VIDEO 28:02) : Capital Account - Charles Ferguson on the Financial Landscape after 2008's "Inside Job"
ZeroHedge – Friday Humor: Keynesianism For Kretins
SafeHaven – Why Won't Fine Art Collapse?
The Market Oracle – Silver Price Undervalued
Perth Mint Bullion – Making A Gold Nugget From Electronic Waste
Seeking Alpha – Is It Time To Buy Silver? (Part 2)
Business Insider – GEITHNER: 'I Have Been The Most F------ Transparent Secretary Of The Treasury In This Country's Entire F------ History'
07/19/12 - Bullion News
CoinNews – Gold, Silver Snap 3-Day Losing Streak, US Silver Coins Rise
Daily Reckoning – Has Bernanke and the Fed Discovered a New Invention in Wealth Creation?
VIDEO (12:09) : USA Watchdog - Ron Hera – The End of Cheap Everything
Numismaster - Bullion Buyers See Red?
AUDIO (10:09) : Exclusive Interview with David Smith (Senior Research Analyst for The Morgan Report)
MineWeb - The biggest misconception in gold and other factors driving the metal
Investor Place - Gold Is Under Seige From QE3 Speculation
Seeking Alpha - Time To Buy Silver? Part 1
Commodity Online - Weak EU vehicle demand may keep pressure on Platinum
TF Metals Report - I Hope You're Ready. I am.
VIDEO (04:27) : Yahoo (BreakOut) - Is QE3 The Easy Way Out? Not So Much
CBC News - WWII shipwreck yields $38M worth of silver, so far
07/18/12 - Bullion News
Sprott Money - Ask The Expert – Eric Sprott – Sprott Money (VIDEO Links - Parts I thru IV)
CoinWeek - We Don’t Need Inflation Of The Money Supply
American Thinker - Fed Action. Helping or Hurting?
Wealth Daily - Platinum Cheaper Than Gold; The White Metal Hits a Tipping Point
Bullion Vault - Why We All Need Some Bullion in the Vault
VIDEO (04:39) : CNBC - Ron Paul Asks Bernanke About Deflation
Clean Energy - Silver prices force solar researchers to innovate
Times News - Sullivan Co. worker accused of stealing nearly $720,000 in gold bars
Article & VIDEO (05:35) : Wealth Wire - Peter Schiff: Bernanke Is Hiding Some Scary Truths
VIDEO (04:39) : BBC – A brief history of money
VIDEO (01:44) : Wyatt Research – Why I'm OK with Being Wrong about Commodities
Financial Sense – How Gold Will be Made Acceptable by the Powers that Be
VIDEO (30:43) : Casey Research – David Stockman: Austerity Is Not Discretionary
Market Watch – Odyssey Announces First Load of Silver Cargo from Three Miles Deep
azizonomics – Poor Thieves Go To Jail, Rich Thieves Don’t
Mish's Blog – What Role Does Government Play in Price Inflation? Various Charts Provide the Answer!
07/17/12 - Bullion News
Silver Lunar – Perth Mint 2013 Lunar Snake Coin Pictures Leaked
CoinWeek – Knowledge and Diversification Keys to Successful Coin Investing
The Daily Bell – Inflation is a Monetary Phenomenon by Ron Paul
Eric De Groot – Commercial Banks Increasing Cash Assets Represents Another Warning Signal
VIDEO (08:36) : CNBC – Real Danger of a New Great Depression: Author
Market Watch – How Bernanke will cause the next crash before 2014
Top Secret Writer – Looking for the Lost Silver Mine of Captain Sunday in Maine
07/16/12 - Bullion News
arabian money – Why you should save in gold and silver rather than US dollars or euros
VIDEO (05:52) : Bloomberg – David Stockman: We're Heading Toward Recession, Paralysis
MineWeb – Silver - a modest outlook at best; HSBC
CoinNews – US Mint Suspends 2012-W Proof American Silver Eagle Coins
Resource Investor – Bullion Now Flat on a Year Ago Price Level
Wealth Daily – Silver and Gold, Silver and Gold
MoneyNews – Hulbert: Gold ‘Remains the Intelligent Bet Today’
CoinWeek – The Coin Analyst: Groundwork for Gold-Backed Reserve Currency is Being Laid
AUDIO : FSN - “Turd Ferguson” – Everyone Should Be Buying Precious Metals
VIDEO (00:58) : Bloomberg - Here Is Proof That Social Security Is in Crisis
Wealth Wire - How to Find Valuable Silver in Your Pocket Change
07/15/12 - Bullion News
Inside Futures - Silver And Gold - Forget Fundamentals And Opinions
Columbia Tribune - U.S. Mint in Philly reopens to public with new tour
Liberty Blitz Krieg - Gold Manipulation is Going Mainstream
Resource Investor - FDIC to Classify Gold as a 0% Risk-Weighted Asset?
arabian money - Emerging market central banks the biggest official buyers of gold but will buy much more
azizonomics - Penis Length, LIBOR & Soviet Growth
07/14/12 - Bullion News
Casey Research - Deflation or Inflation? Yes.
FX Empire - Silver Weekly Fundamental Analysis July 16-20, 2012, Forecast
AUDIO : FSN - Peter Schiff (Live at Freedom Fest 2012) – Socialism is the Problem – Capitalism Is The Solution
Got Gold Report - COMEX Swap Dealers Net Long Gold for Third Time Ever
321gold - The Other-Side of the Gold Manipulation Argument; Urban Legends and Gold by Bob Moriarty
MineWeb - Fading QE talk keeps gold on track for weekly loss
07/13/12 - Bullion News
VIDEO (28:04) : Capital Account - Jim Grant on Safe-Haven Bubbles and a Bull Market in Black Walnut Trees!
Financial Sense - Does Central-Bank Gold-Buying Signal the Top Is Near?
Wealth Wire - Have We Reached 'Peak Gold'?
Solon Patch - Cash For Gold Business Swindled With Counterfeit Coins
The New American - Deficit Headed for $1.1 Trillion This Year
Minyanville - Four Insanely Bold Predictions About the Commodity Industry
CNBC - Market Savior? Stocks Might Be 50% Lower Without Fed
CNBC - Dollar Could Fall Off Fiscal Cliff Into Euro Abyss
07/11/12 - Bullion News
VIDEO (24:24) : Sprott Management; Managing Wealth in Uncertain Times
CME Group - Is Gold Stuck in BIZARRO Land?
Hard Assets Investor - Deutsche Bank’s Brebner: Gold Headed To $2,000/oz. In Early 2013 Amid Inflationary Bias By Central Banks
Seeking Alpha - Beginners' Guide To Buying Metals
Fox Business - Another California City Seeks Bankruptcy
The Globe and Mail - Get ready for gold bullion's season of strength
Perth Mint Bullion - Thomson Reuters GFMS Sees Gold Above $1,800 Later This Year
Wyatt Research - Another Shocking Revelation about the Death of the Dollar
The Bismarck Tribune - Gold buying company operating in Bismarck bounced checks in Dickinson
Acting Man - In Gold We Trust, 2012 Edition (PDF at bottom of article)
Merk Funds - Gold to Outshine Dollar?
Gold Investing News - Peter Schiff on Gold and Money
Article & VIDEO (28:03) : SafeHaven - How To Protect Yourself From Collapse of the Faith-Based Financial System
VIDEO (06:33) : arabian money - Sharjah Gold Souk sees a revival of interest in buying silver and increases range of silver bars
POLL : Gallup - Americans' Confidence in Television News Drops to New Low
07/10/12 - Bullion News
Peak Prosperity- Our Money Is Dying;Don't let your wealth die w/ it
Numismaster - Does Slab Add Value to Bullion?
ZeroHedge - China Imports More Gold From Hong Kong In Five Months Than All Of UK's Combined Gold Holdings
azizonomics - Propping Up The Gold Price?
The Daily Caller - CBO: US posts $900 billion dollar deficit in first nine months of fiscal year 2012
Gold Alert - Can Gold Prices Climb to $2,000 by Year-End?
VIDEO (03:37) : Learn Liberty - How Cronyism Is Hurting the Economy
Index Universe - Jim Rogers Waits For Gold, Shorts Stocks
07/09/12 - Bullion News
ZeroHedge - Dismal Equity Volume Day As Gold And Treasuries Surge
Bullion Vault - How Fiat Money Has Depressed Living Standards
VIDEO (04:32) : CNBC - Santelli Interviews Nigel Farage, UK Independence Party leader, discusses Europe's looming fiscal crisis,
Wyatt Research - Shouldn’t Commodities be Headed for the Moon by Now?
Forbes - The Psychological Mind Set of a Precious Metals Buyer
Arabian Money - Why do so few investors seem to understand the silver story?
Paper Money Collapse - Central banks: Running out of ideas, road
VIDEO (04:01) : Max Keiser - Ned Naylor-Leyland on CNBC: “Gold May Have Been Manipulated Like Libor”
The Bull - Steve Forbes Interview: How The US Federal Reserve Is Damaging The Economy
Wealth Daily - Buy Dips in Gold
Times of India - E -waste contains $21 billion worth gold and silver: Experts
PCGS - PCGS Gives Congressmen A Close Look At Counterfeiting Problems
07/08/12 - Bullion News
ENCORE VIDEO (03:47:25) : PBS - Money, Power & Wall Street
SafeHaven - Market Report: A Glimpse of Gold Capitulation?
Ludwig von Mises Institute - Why Gold?
07/07/12 - Bullion News
CoinNews - Gold, Precious Metals Fall on Week. US Coin Sales Weaker
NPR - What Does London's LIBOR Mean To The U.S.? (AUDIO to story will be avail. after 7pm/ET)
VIDEO (28:04) : Capital Account - Steve Keen on the Minsky Singularity and the Debt Black Hole's Event Horizon!
Acting Man - The Gold Silver Ratio As An Early Warning Indicator
AUDIO (44:38) : Peak Prosperity - Paul Brodsky: Central Banks are Nearing the 'Inflate or Die' Stage; So hold tightly to your gold
AUDIO (20:29) : Future Money Trends - Interview With James Turk of GoldMoney.com
Daily Reckoning - Imagining a Universe Without Central Banks
Money Morning - What I Wish Ben Bernanke Knew About Japan
Numismaster - Battle Against Fakes Continues
07/06/12 - Bullion News
The Market Oracle - The Next Time Silver Crosses Above $30.00 Will Be The Last Time
VIDEO (02:54) & Article : Bullion Vault - FRIDAY EVENING UPDATE AND WEEK IN REVIEW VIDEO
Washington Blog - Are Banks Raiding “Allocated” Gold Accounts?
Wealth Wire - The Shocking Rise of U.S. Gold Exports
Kitco News - CME Group Lowers Margin Requirements For Nymex Palladium Futures
Bullion Street - Japan Gold reserves drop below $40 billion
Yorkshire Evening Post - Leeds bullion fraudster jailed for internet card scam
Summary & VIDEO : Silver Doctors - Jim Cramer. “I trust Gold, I don’t trust Paper!?!”
Ahead of the Herd - The Ancient Metal of Kings
07/05/12 - Bullion News
Coin News - Gold Prices Dip, Silver Falls. US Gold Coin Sales Up
Bullion Street - The Dow/Gold ratio this independence day
chron - Franchise Agreement Signed to Bring Precious Metals Refinery to Pittsburgh
Bloomberg - Gold Futures Fall on Stimulus Outlook, Dollar’s Rally
The Telegraph - Revealed: why Gordon Brown sold Britain's gold at a knock-down price
Breit Bart - Worried central banks slash global interest rates to new lows
The Independent - Cut in platinum output by Aquarius
The Star - Coin collector learns the difference between legal tender and spending money the hard way
ETF Daily News - Currencies Don’t Make Gold Prices Look Good
Buy Silver Coin - Deciding which Precious Metal is Best for You
VIDEO (23:26) : Got Gold Report - Ronald Reagan’s First Inaugural Address
07/04/12 - Bullion News
VIDEO (26:45) : Got Gold Report - COMEX Silver Futures Skewed Short, Potentially Explosive
The Daily Journal - San Mateo County Dealer talks about the Gold and Silver Industry
Manchester Evening News - Doing your own Gold Products Homework
The Source (WSJ) - Platinum Miners Under Pressure
ZeroHedge - The Ultimate History-Of-Markets Chartbook
VIDEO (01:05) : Bloomberg - The Ticking Debt Bomb: $16 Trillion and Climbing
King World News - This Will End In Inflation & Destruction of Paper Currencies
07/03/12 - Bullion News
CoinWeek - Why Aren’t There “Hotel Sellers” Of Gold And Silver?
Advisor One - State Capitalism to Rule the U.S.: Roubini Report
AUDIO (30:00) : BBC Radio - The Gold Standard
Wyatt Research - The Real Cause of Hyperinflation
Financial Sense - Audit the Fed Headed for the House Floor! by Ron Paul
MoneyNews - Investopedia: Consider Real Estate, Gold as Alternatives to Cash SilverSeek - The Silver Two Year Cycle Continues
VIDEO (03:21) : David Morgan - Gold Headed for a Minimum of $2,500 an Ounce
LA Times - Mammoth Lakes files for bankruptcy
SafeHaven - Monetary Inflation and Gold
07/02/12 - Bullion News
Wall Street Cheat Sheet - Did the EU Summit Change Anything for Gold?
AUDIO (57:49) : Financial Sense - In-Depth Precious Metals Market Mechanics with Jeff Christian
MineWeb - Gold coin sales tumble to pre 2008-crisis levels
CoinWeek - IS SILVER A GOOD DEAL AT $27 to $29?
Resource Investor - Deflation is the Biggest Catalyst for Precious Metals
VIDEO (27:37) : USA Watchdog - One on One with Reggie Middleton
Arabian Money - $15m Roman silver hoard uncovered in Jersey, wealth preserved for 2,000 years
Gold Silver Worlds - 7 facts proving we are in a long term powerful uptrend in Gold and Silver
VIDEO (03:07) : Learn Liberty - Would Taxing the Rich Fix the Deficit?
Gold and Silver Blog - John Paulson Remains Bullish On Gold With $4,000 Target
novinite - Romanian Caught Smuggling Silver at Bulgarian - Turkish Border
BBC - Eurozone unemployment rises to fresh record high in May
07/01/12 - Bullion News
VIDEO (02:54) : Bloomberg - Show Me the Money: European Bailout Funds
azizonomics - The Origin of Money
ZeeBiz - Rich Indians hoarding banknotes, gold and art works in Swiss banks
VIDEO (04:08) : WSJ - Just Like 1965, These Are Golden Years
For Bullion Market News...
Notice:
The charts, commentary, and information on the Free-Bullion-Investment-Guide.com are in no way an endorsement of how you should invest or divest.
|
Support this Guide & Paypal Thank You for Your Support |
|
|
 | |||||

Recent Articles
-
Newsletter of the Free Bullion Investment Guide - April 2026
Apr 05, 26 04:44 PM
 The April 2026 newsletter of the Free Bullion Investment Guide provides the latest updates, fundamental and technical gold and silver market analysis, the best articles from last month, and a list of…
 -
Newsletter of the Free Bullion Investment Guide - February 2026
Feb 07, 26 02:12 PM
 The February 2026 newsletter of the Free Bullion Investment Guide provides the latest updates, fundamental and technical gold and silver market analysis, the best articles from last month, and a list…
 -
Newsletter of the Free Bullion Investment Guide - January 2026
Jan 07, 26 04:07 PM
 The January 2026 newsletter of the Free Bullion Investment Guide provides the latest updates, fundamental and technical gold and silver market analysis, the best articles from last month, and a list o…
 -
Newsletter of the Free Bullion Investment Guide - December 2025
Dec 07, 25 04:35 PM
 The December 2025 newsletter of the Free Bullion Investment Guide provides the latest updates, fundamental and technical gold and silver market analysis, the best articles from last month, and a list…
 -
Newsletter of the Free Bullion Investment Guide - November 2025
Nov 08, 25 01:58 PM
 The November 2025 newsletter of the Free Bullion Investment Guide provides the latest updates, fundamental and technical gold and silver market analysis, the best articles from last month, and a list…

18W LED Security Light (Dusk to Dawn & Motion Sensor) - $32.99
from:
 LED Lighting

) (as of March 11, 2011)")
This website is best viewed on a desktop computer.
Keep this Guide Online
& Paypal
Thank You for
Your Support
with Feedly
Search the Guide
| search engine by freefind | advanced |

Give a lasting gift of the iconic Silver Maple Leaf bullion coin [More]
Free Shipping on Orders over $100 (CDN/USA)
The Sovereign 2026 Gold Bullion Coin in Card

Britian's
Royal Mint

Daily
Newsletter
Mintages & Photos
|

|
Silver Panda |

Mintages
for
2024
Gold, Silver, & Platinum
Austrian Philharmonic Bullion Coins

|
Silver Philharmonics  |
Platinum Philharmonics

Platinum and Palladium Bullion


Mintages
for
2025
Gold & Silver Mexican Libertad
|
Gold Libertads |


Updated Mintages for
American Gold Buffalo
American Gold Eagle
American Silver Eagle
2024 & 2025
Jerusalem of Gold Bullion
Coin photos
(bottom of page)
 Obverse side")


Help Us Expand our Audience by forwarding our link
www.free-bullion-investment-guide.com.
Thank You!
Last Month's

In No Particular Order
April 2026
|
All Articles were Originally Posted on the Homepage Gold Nanoparticle Cancer ResearchSona Nanotech’s Hyperthermia Platform Boosts Immunotherapy Response in Colorectal Cancer Study - Tipranks Sona Nanotech Showcases Cancer Therapy Results At Prestigious Industry Cancer Conferences - Financial Times Development of gold nanostars coated with mesoporous silica for chemo-photothermal therapy - Published Research Paper - Journal of Drug Delivery Science and Technology (Science Direct) |
All Articles were Originally Posted on the Homepage
Platinum per Troy Oz. (ozt.)


Click Ad to Request a Free Appraisal Kit
ExpressGoldCash
Customer Reviews 4.9 stars


Give a lasting gift of the iconic Silver Maple Leaf bullion coin [More]
Free Shipping on Orders over $100 (CDN/USA)
