A Rebound in the Dollar
will cause Silver and Gold to Dip
Review and Outlook for Silver, Gold and the U.S. Dollar
Originally Posted on 1/07/2018 @ 4:49pm
Last Edited on 01/08/2018 @ 12:19pm
by Steven Warrenfeltz
Subscribe to this Blog

Hello,
Thank you for visiting the Free-Bullion-Investment-Guide's latest blog post, before we get to the precious metals review and outlook, below are some of last week's Best Bullion Market-Related News articles that were taken from this guide's home page.

Trump’s Tax Cuts: The Good, The Bad, and the Inflationary - Money Metals Exchange
Why the Price of Gold Kept Climbing in 2017 - The Motley Fool
Sleepy Gold Market Is Woken Up by Flurry of Trades - Bloomberg
Palladium Panic-Bid To Record Highs As Shortage Fears Mount - Zero Hedge
INFOGRAPHICs: Visual Capitalist - Our Top Infographics of 2017 - Visual Capitalist
Best of the Week for Gold NanoParticle Cancer Research
GOLD NANOPARTICLE CANCER RESEARCH: WSU researchers use gold to target, kill cancer cells with less drugs - Washington State University

Photo above provided courtesy of pixabay.com
 yin and yang
Before I start this week's post, I hope you and your family had a very Merry Christmas and a Safe & Happy New Year.
Yesterday morning (1/06), I was searching for a visual graphic that would best describe this week's blog post, I had come up with a few ideas but nothing concrete, then I saw an image of 'Yin and Yang.'
Immediately, I knew that image would work best, so I threw away everything else I was working on and altered the graphic to correspond with the title of this post.
Why does 'Yin and Yang' work so well? The symbol is one of the best representation of the dollar's relationship with gold and silver.
When the dollar's down, gold and silver are up, and vice versa, of course, there are some exceptions, but it's usually the case about 90% of the time.
Based on the charts below, over the next week or two, we should see a great example of this relationship as the U.S. Dollar's rebound will cause gold and silver to dip.
Review & Outlook
|
All the charts on this blog are Daily Charts unless noted otherwise.
US DOLLAR
In Review
Two weeks ago, I wrote the following about the U.S. Dollar and posted the chart below.
In the U.S. Dollar's chart below you can see the negative patterns or 'Dark Clouds' I was talking about in the title.
The dollar has formed two negative patterns the first is a Rising Expanding Wedge pattern and the other is a Head and Shoulders pattern.
The Head and Shoulders pattern has a question mark on the right shoulder because technically it can't be called a 'Head and Shoulders' pattern until the price breaks the neck-line.
However, the same 'Head and Shoulders' pattern looks to be forming in the dollar's MACD and RSI indicators, but first, the U.S. Dollar must break and confirm the 'Rising Expanding Wedge' before it comes close to confirming the Head and Shoulders pattern.

In Review - continued
In the chart below, you can see that over the last two weeks both negative patterns were confirmed.
The Rising Expanding Wedge was confirmed very shortly after posting the chart above, then early last week (1/02), the dollar fell in price, and in doing so it broke the neck-line of the negative 'head and shoulders' pattern confirming it.

U.S. Dollar - This Week's Outlook
In the outlook chart below, you can see that the Dollar has formed a narrow 'Falling Expanding Wedge' pattern.
It is a positive pattern, but because of how narrow it is, it's hard to say how positive it will be for the dollar's future, quite honestly it could end up looking a lot like a 'dead cat bounce,' but its too early to say how the dollar will rebound after its latest fall.
Lastly, you'll notice in the dollar's MACD chart below, I've traced the bar chart with a 'black line,' this is a clear indication that a rebound should happen in the dollar's price soon.
Plus, the RSI, below the MACD, has already started to show that a rebound is due to happen to the dollar.

Charts provided courtesy of TradingView.com
U.S. Dollar's Price Resistance and Support Levels
U.S. Dollar's Resistance Levels
$94.00
$93.00
U.S. Dollar's Support Levels
$92.00
$91.00
SILVER
In Review
Two weeks ago, I didn't write much of an outlook for silver because no technical patterns had formed in its price chart.
However, its MACD and RSI were both indicating that more upward movement was possible and this was stated in the commentary, below are silver's commentary and chart outlook from two weeks ago.
For the week to come, I could not find any clear patterns in silver's chart.
However, silver's MACD and RSI are both indicating that more upward movement is possible and with the forecast for the U.S. Dollar this outcome becomes more likely, but time will tell.

In Review - continued
As seen in the chart below, the price of silver did rise as the MACD and RSI were indicating.
Silver - This Week's Outlook
As silver rose in price, the Rising Expanding Wedge in the chart below slowly started to take shape.
Now that the price of silver has moved up, it looks to be in the process of a pullback, the negative 'Rising Expanding Wedge' pattern isn't the only sign that indicates this will happen.
Another negative sign is in Silver's MACD chart below, its bar chart, like the dollar, has started to move in the opposite direction of its signal lines.
Due to all of the negatives in silver's chart, we should see a pullback in its price and the 'Rising Expanding Wedge' pattern is expected to be confirmed sometime in the next week or two.

Charts provided courtesy of TradingView.com
Silver's Price Resistance &
Support Levels
Silver's Resistance Levels
$18.20
$17.50
Silver's Support Levels
$16.50
$16.00
GOLD
In Review
Like silver, two weeks ago, I didn't give much of an outlook for gold because no clear technical patterns had formed in its chart, but like silver, its MACD and RSI were both indicating more upward movement was in its future.
Below, is what was written in the gold outlook from two weeks ago and its corresponding gold chart is below it.
For the week ahead, after studying Gold's chart, I could not identify any positive or negative technical patterns.
However, also like silver, gold's MACD and RSI are giving an indication that we should see gold move higher.
Ultimately time will tell, but if the dollar falls like the patterns in its chart indicate then we should see gold and silver move higher.

In Review - continued
As seen in the chart below, the price of gold, like silver, rose as its MACD and RSI indicated.
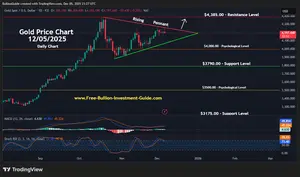
Gold - This Week's Outlook
Like silver, now that the price of gold has moved up with a lot of momentum, some of that momentum is starting to wane.
In addition, like silver, gold has also formed a negative 'Rising Expanding Wedge' pattern that is narrow in shape.
The narrow shape of the 'Rising Expanding Wedge' pattern found in gold and silver's price charts gives the possible indication that the two precious metals may see a limited pull back; time will tell.
The other indication that shows gold is due for a pullback is gold's MACD bar chart, like the dollar and silver's MACD has indicated, gold's bar chart has also started to change directions.
Plus, gold's RSI is also peaking in overbought territory.

Charts provided courtesy of TradingView.com
Gold's Price Resistance and
Support Levels
Gold's Resistance Levels
$1350.00
$1325.00
Gold's Support Levels
$1295.00
$1265.00
Thank You for Your Time.
Have a Great Week and God Bless,
Steve
'Click Here' see all of the prior Blog posts,
Thank You for Your Time!
|
Investment/Information Disclaimer: All content provided by the Free-Bullion-Investment-Guide.com is for informational purposes only. The comments on this blog should not be construed in any manner whatsoever as recommendations to buy or sell any asset(s) or any other financial instrument at any time. The Free-Bullion-Investment-Guide.com is not liable for any losses, injuries, or damages from the display or use of this information. These terms and conditions of use are subject to change at anytime and without notice. |
|
Support this Guide & Paypal Thank You for Your Support |
|
|
 | |||||

Recent Articles
-
Newsletter of the Free Bullion Investment Guide - April 2026
Apr 05, 26 04:44 PM
 The April 2026 newsletter of the Free Bullion Investment Guide provides the latest updates, fundamental and technical gold and silver market analysis, the best articles from last month, and a list of…
 -
Newsletter of the Free Bullion Investment Guide - February 2026
Feb 07, 26 02:12 PM
 The February 2026 newsletter of the Free Bullion Investment Guide provides the latest updates, fundamental and technical gold and silver market analysis, the best articles from last month, and a list…
 -
Newsletter of the Free Bullion Investment Guide - January 2026
Jan 07, 26 04:07 PM
 The January 2026 newsletter of the Free Bullion Investment Guide provides the latest updates, fundamental and technical gold and silver market analysis, the best articles from last month, and a list o…
 -
Newsletter of the Free Bullion Investment Guide - December 2025
Dec 07, 25 04:35 PM
 The December 2025 newsletter of the Free Bullion Investment Guide provides the latest updates, fundamental and technical gold and silver market analysis, the best articles from last month, and a list…
 -
Newsletter of the Free Bullion Investment Guide - November 2025
Nov 08, 25 01:58 PM
 The November 2025 newsletter of the Free Bullion Investment Guide provides the latest updates, fundamental and technical gold and silver market analysis, the best articles from last month, and a list…

18W LED Security Light (Dusk to Dawn & Motion Sensor) - $32.99
from:
 LED Lighting

) (as of March 11, 2011)")
This website is best viewed on a desktop computer.
Keep this Guide Online
& Paypal
Thank You for
Your Support
with Feedly
Search the Guide
| search engine by freefind | advanced |

Give a lasting gift of the iconic Silver Maple Leaf bullion coin [More]
Free Shipping on Orders over $100 (CDN/USA)
The Sovereign 2026 Gold Bullion Coin in Card

Britian's
Royal Mint

Daily
Newsletter
Platinum and Palladium Bullion


Mintages
for
2025
Gold & Silver Mexican Libertad
|
Gold Libertads |


Updated Mintages for
American Gold Buffalo
American Gold Eagle
American Silver Eagle
2024 & 2025
Jerusalem of Gold Bullion
Coin photos
(bottom of page)
 Obverse side")
 Obverse side")
Chinese Gold Coin Group Co.
& Chinese Bullion


Help Us Expand our Audience by forwarding our link
www.free-bullion-investment-guide.com.
Thank You!
Last Month's

In No Particular Order
March 2026
US Dollar Demand Soars: Dedollarization Was a Fabrication of the Bull Market - Daniel Lacalle
Video: (04:51) WisdomTree CEO Is Going All In on Gold - Jonathan Steinberg, founder and CEO of WisdomTree, tells Barron’s Andy Serwer how gold and metals can be a strong alternative to the dollar and Bitcoin - BARRON'S
Are Central Banks Selling Gold? - Gold holdings of Turkey's central bank are down a lot, but Turkey is an outlier in EM - Robin J. Brooks (Substack)
Advisors want to bask in gold's warm glow, says Jan van Eck - Investment News
(.pdf) Report: Powertrain shifts spark PGM optimism - Metals Focus
American Gold Rushes: North Carolina (1799–1849) vs. California (1848–1898) - America’s resource extraction history hinges on two gold rushes with practically paradoxical origins - MINING VISUALS
If The World Is On Fire, Why Is Gold Getting Cheaper? - Trefis
Banks seize on precious metals trading boom - International Finance Review (IFR)
Video Short: FINDING FAKE GOLD BULLION (HAVE YOUR BULLION CHECKED) - Happy Jewelers (YouTube)
Gold Update : When the Dollar Wears the Crown Even Gold Steps Aside - The explanation is not that gold has lost its appeal. It simply means the market is still hoarding cash before deciding how to protect purchasing power - The Dark Side of the Boom
Report: Beyond “Dr. Copper”: Copper’s Strategic Shift - Sprott
What is the IRS loophole for gold? - The IRS loophole could help you save substantially on the taxes tied to your gold assets - CBS News (msn)
Bargain Collector: Five-Ounce Silver Quarters, Really? - Numismatic News
Report: Silver: The Forgotten Metal That Built Civilizations — 5,000 Years & The $100+ Reckoning - From Mesopotamian shekels to the $100+ supercycle: the complete, unvarnished story of the most undervalued metal on Earth - Capital Street FX
Platinum is back. So why are its miners shunning growth? - mining_mx
Gold CFDs Vs Silver CFDs (Contract for Difference): Which Metal Is Safer For A Small Account Scalper? - EBC Financial Group
(.pdf) Charts: India Monthly Chartbook - March 2026 - Metals Focus
More PGM potential for South Africa as Palladium Center returns with major new insight - MINING WEEKLY
Item of the Week: Low Mintage Makes 1928 Peace Dollar a Tough Find - With a mintage under 400,000, the 1928 Peace dollar stands as the series’ lowest-production issue—though its true scarcity comes with the complexities of silver dollar history. - Numismatic News
RANKED: Top 10 gold mining companies of 2025 - MINING.COM
Info~Graphic: Mapped: Top Marginal Income Tax Rates by State in 2026 - Visual Capitalist
|
All Articles were Originally Posted on the Homepage Gold Nanoparticle Cancer ResearchThe Role of Gold in Technology: 5 High-Tech Uses - Securities.io Synthesis Strategies, Therapeutic Roles, and Clinical Progress of Gold Nanoparticles in Biomedical Engineering - Nano Select Optimizing gold nanoparticles for better medical imaging, drug delivery, and cancer therapy - PHYS.org (msn) One-hour saliva test spots biomarker linked to several cancers - Medical Express (msn) Korean researchers unveil rapid diagnostic test for pancreatic cancer - Korea Joongang Daily |
All Articles were Originally Posted on the Homepage