Gold and Silver
Wiping the Slate
Gold, Silver, U.S. Dollar, Platinum and Palladium Review & Outlook
05/01/2017 thru 05/12/2017
Originally Posted on 05/08/2017 @8:03pm
Last updated 5/9/2017 @3:07pm
Subscribe to this Blog
Hello,
Thank you for visiting the Free-Bullion-Investment-Guide's latest blog post, I hope that you and your family have had a great week.
Before we get to this week's post; below are a few of Last Week's Best News Articles that were taken from this guide's homepage.

VIDEO : CNBC - Ron Paul on the Fed, stocks and gold
VIDEO : Santelli Exchange - 'Fuzzy' Markets & the Fed
Bloomberg View - The 'Bernanke Doctrine' Is Played Out
My Budget 360 - Canada Housing Bubble Pops and Looks Similar to US Housing Bubble: Canada’s Largest Alternative Mortgage Lender Crashes in Dramatic Fashion.
Best of the Week for Nano-Particle Cancer Research
GOLD NANOTECHNOLOGY : The New York Times - One Day, a Machine Will Smell Whether You’re Sick
NANOTECHNOLOGY : CANCER RESEARCH : University Herald - Tumor-Shrinking Nanoparticle May Be The Cure For Cancer, Mayo Clinic Researchers Find
Gold and Silver
Wiping the Slate

In the past, there have been times when I’ve posted charts that I wish I could erase and forget about.
I'm happy to say, this isn’t one of those times and it doesn't happen that often.
But when these times arise, I take responsibility and show you where the mistake was made, so we can both learn can learn from it.
The reason why I titled this week's post 'Gold & Silver - Wiping the Slate' is because many of the old lines and patterns that have been posted on this guide's analysis for last several weeks have been wiped away, but not all.
In this week's charts, after I removed many lines and patterns in gold and silver's charts, a new bullish pattern was identified, see below for this new pattern.
This weeks analysis includes: Gold, Silver, U.S. Dollar, Platinum and Palladium.
SILVER
Last week, the chart below was posted for silver, it showed that the precious metals fell below its Falling Wedge and Ascending Channel.
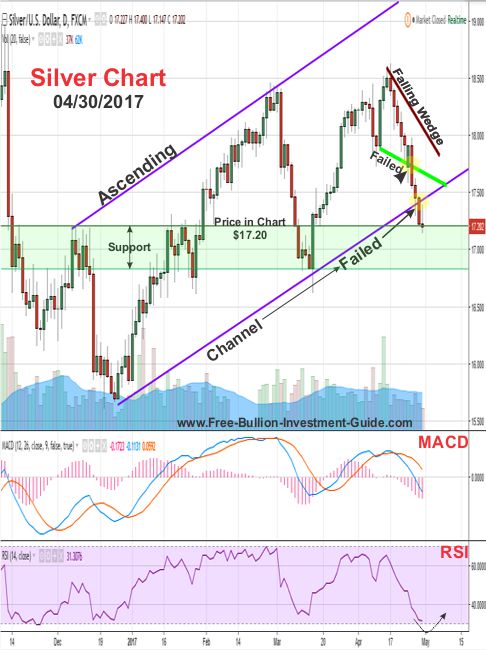
In last week’s analysis for silver, the following was stated:
“Sometime this week, we should see an end to silver’s falling price because its RSI is in oversold territory, plus, it has good support between the $17.20 and $16.80 levels.”
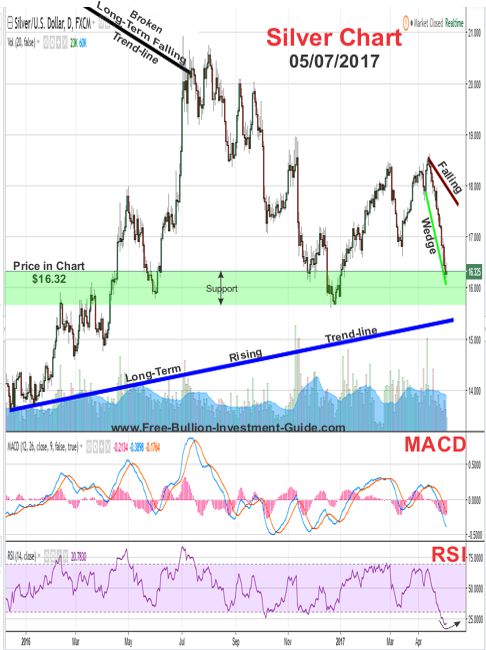
However, silver kept on falling in price, its RSI (Relative Strength Index) fell deeper into oversold territory; plus silver fell through all its support levels and didn’t stop its till it hit the $16.30 support level.
Now that silver has found support at the $16.30 level, silver's price should start to rebound.
Its RSI is deep into oversold territory and its MACD is slowly starting to change direction.
This week, after all the lines from last week's chart were wiped away, a positive pattern has formed in silver's chart; a bullish falling expanding wedge.
In the week to come, we should see silver reverse its free fall in price and slowly start to move back up in price.
Note: The bottom of the highlighted support area in the chart below is $15.65.
charts provided courtesy of TradingView.com
Silver's Price Resistance &
Support Levels
Silver's Resistance Levels
$16.80
$16.70
$16.45
Silver's Support Levels
$16.10
$15.80
$15.65
GOLD
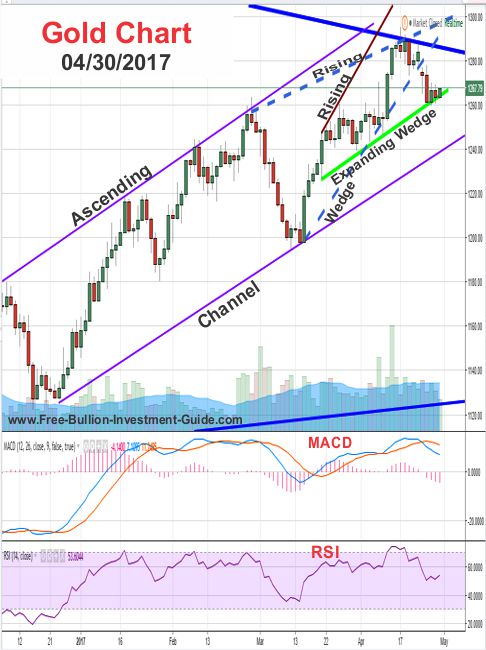
Last week's chart below was posted with the following commentary;
In the chart (below), we see that gold fell below the ‘rising wedge pattern’ (confirming it) and it is now trading on the ‘rising expanding wedge’s' support level.
This week, it will be up to current events to determine gold’s direction.
If things in the world get worse in the mind of traders, we will see gold rise.
However, if things don’t get worse, we will see gold confirm the rising expanding wedge pattern and come closer to trade near the bottom of its ascending channel.
Things didn't get worse in the eyes of traders.
First, the French Presidential Candidate Emmanuel Macron’s poll numbers rose in France’s presidential polls, which calmed the market’s fears of a Marine LePen presidency.
Plus, North Korea didn’t set off any successful weapon tests last week, which also help calm the market's nerves.
The only thing that was wrong with that commentary was that gold didn’t stop falling in price at the Ascending Channel’s bottom trend-line, it continued to fall through it.
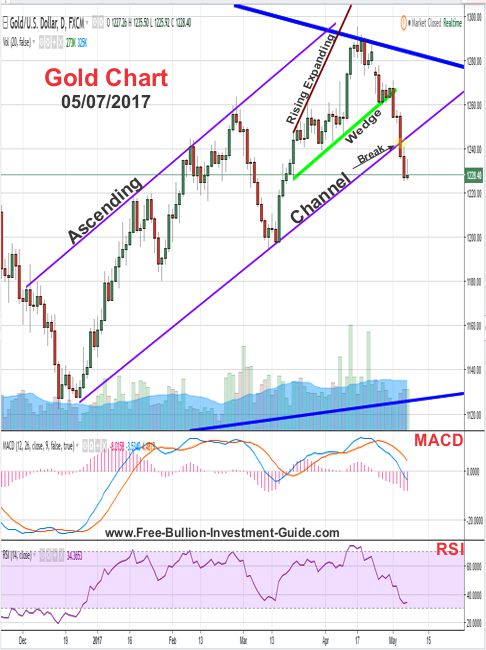
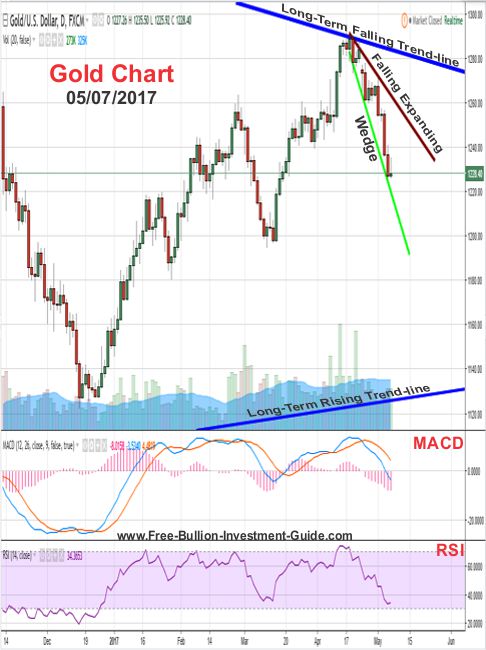
Like silver, gold’s chart this week is showing a bullish falling expanding wedge pattern.
Even though gold looks like it may fall a little more in price, we should see gold slowly reverse its pattern, like silver, and move higher this week.
Charts provided courtesy of TradingView.com
Gold's Price Resistance and
Support Levels
Gold's Resistance Levels
$1290.00
$1250.00
$1240.00
Gold's Support Levels
$1210.00
$1200.00
$1180.00
US DOLLAR
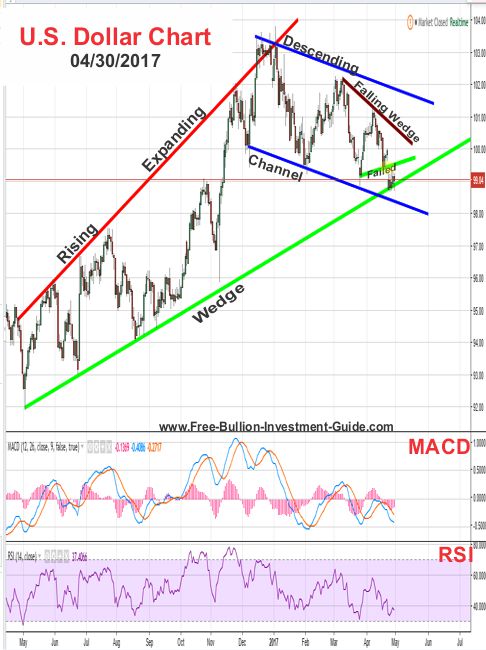
Last week the following was stated about the chart below:
The rise of the Euro is what caused the big drop in the price of the U.S. Dollar, and it is why the dollar is now trading along the bottom support level of the rising expanding wedge (bear pattern).
The final vote for the French elections will be on May 7th, traders will be happy if Macron wins.
If that is the outcome, we can expect the dollar to fall below the rising expanding wedge’s bottom level – confirming the bear pattern.
(continued....)
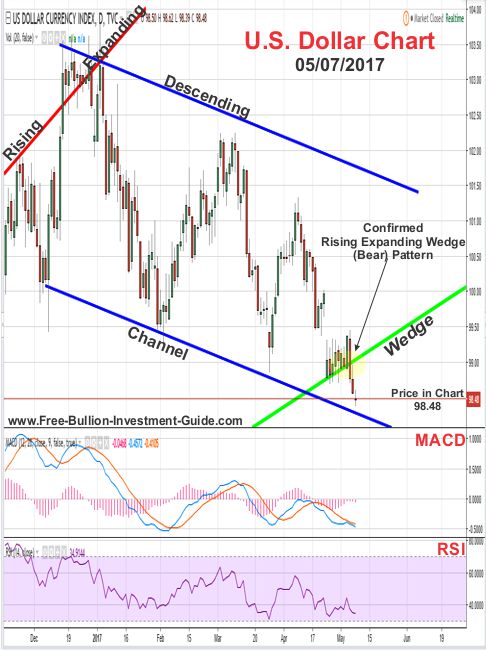
Trader’s didn’t wait till the election on May 7th to sell the dollar, once Macron started to rise in the polls on Wednesday, Thursday, and Friday, they started to buy euros.
As they sold the dollar, they confirmed the 'Rising Expanding Wedge' pattern that has been posted on this guide’s analysis since November 2016.
In addition, as the dollar broke below the bottom trend-line of the rising expanding wedge, it also fell below the $99.50 support level, turning it into a strong resistance level.
This week, now that the French Presidential Elections are over, and the selling in the dollar is over too (for now), we should see the dollar’s price rise, but it is doubtful it will break back above the $99.50 in the near future.
Charts provided courtesy of TradingView.com
U.S. Dollar's Price Resistance and Support Levels
U.S. Dollar's Resistance Levels
$99.50
$99.30
$99.10
U.S. Dollar's Support Levels
$98.60
$98.30
$98.00
PLATINUM
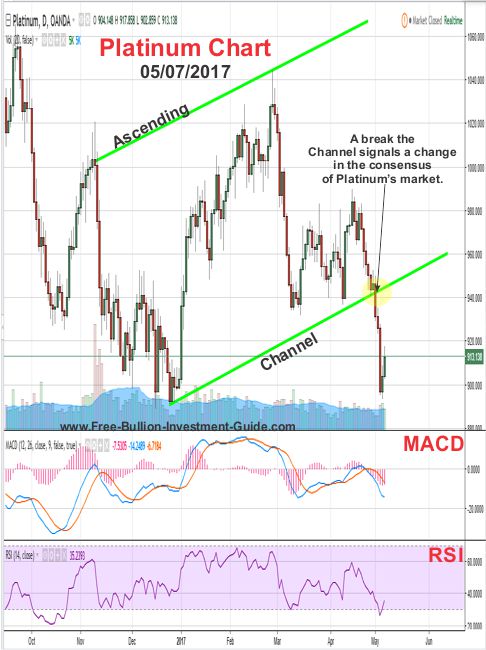
For the last several weeks, platinum has been trading along the bottom of its ascending channel, then early last week it fell through the bottom of the channel.
Note: 'Ascending' & 'Descending' Trading Channels always fail, when the price breaks either above or below a channel, it is a failure of the channel. A break in a channel shows a change in the consensus of the asset’s market.
In this week’s chart, the platinum chart is showing a few possible patterns but nothing concrete enough for lines to be drawn. If a pattern starts to take shape its chart will be posted next week.
Charts provided courtesy of TradingView.com
Platinum's Price Resistance and Support Levels
Platinum's Resistance Levels
$945.00
$930.00
Platinum's Support Levels
$890.00
$855.00
PALLADIUM
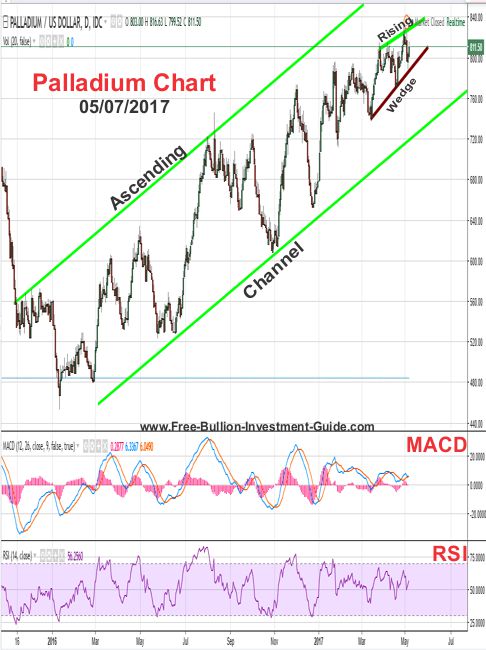
Palladium is the only precious metals still trading inside its 'Ascending Channel, however, Palladium often trades separately from the other precious metals.
This week, palladium could complete the 'rising (bear) wedge pattern' or continue to trade inside it; only time will tell.
PLATINUM & PALLADIUM
In addition, for those who like these two precious metals, you will want to pay attention to Auto Sales (see article below).
Currently, Platinum & Palladium's primary market is in the catalytic converters industry, and as auto sales drop so will the prices of these precious metals.
Charts provided courtesy of TradingView.com
Palladium's Price Resistance and Support Levels
Palladium's Resistance Levels
$945.00
$930.00
Palladium's Support Levels
$890.00
$855.00
Have a Great Week.
Thank you for your time & God Bless,
Steve
'Click Here' see all of the prior Blog posts,
Thank You for Your Time!
|
Support this Guide & Paypal Thank You for Your Support |
|
|
 | |||||
This website is best viewed on a desktop computer.
Keep this Guide Online
& Paypal
Thank You for
Your Support
with Feedly
Search the Guide
| search engine by freefind | advanced |
Premium Canadian Bullion
Give a lasting gift of the iconic Silver Maple Leaf bullion coin [More]
Free Shipping on Orders over $100 (CDN/USA)
or
From the U.K. Royal Mint

Daily
Newsletter
Updated Mintages for
American Gold Buffalo
American Gold Eagle
American Silver Eagle
2024 & 2025
Jerusalem of Gold Bullion
Coin photos
(bottom of page)
Mintages
for
2024
Gold & Silver Mexican Libertad
|
Gold Libertads |
Chinese Gold Coin Group Co.
& Chinese Bullion
Help Us Expand our Audience by forwarding our link
www.free-bullion-investment-guide.com.
Thank You!
Last Month's

In No Particular Order
January 2026
All Articles were Originally Posted on the Homepage

