ExpressGoldCash - 4.9 star - Customer Reviews
Silver is Showing Gold
its Future
In Their Short-Term Trade
Gold, Silver and U.S. Dollar Review & Outlook
04/24/2017 thru 05/05/2017
Originally Posted on 05/01/2017 @2:21pm
Subscribe to this Weekly Blog post
Hello,
Thank you for visiting the Free-Bullion-Investment-Guide's latest blog post, I hope that you and your family have had a great week.
Before we get to this week's post; below are a few of Last Week's Best News Articles that were taken from this guide's homepage.

Advancing Time - Central Banks Massive Incursion Into Buying Stocks
Bloomberg - Consumers Show Signs of Frailty
Knowledge Leaders Capital - Is the USD Bull Market Over and What That Would Mean for Your Portfolio
AUDIO : Financial Sense - When Things Get Crazy, Don’t Get Lazy – Focus on Risk!
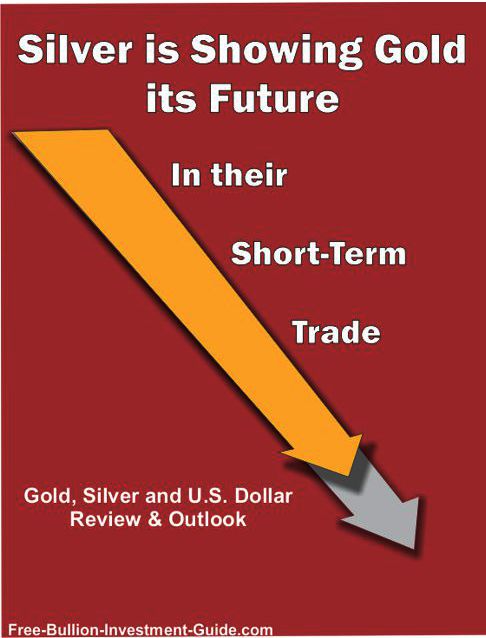
Silver is Showing Gold its Future
in their Short-Term Trade
SILVER
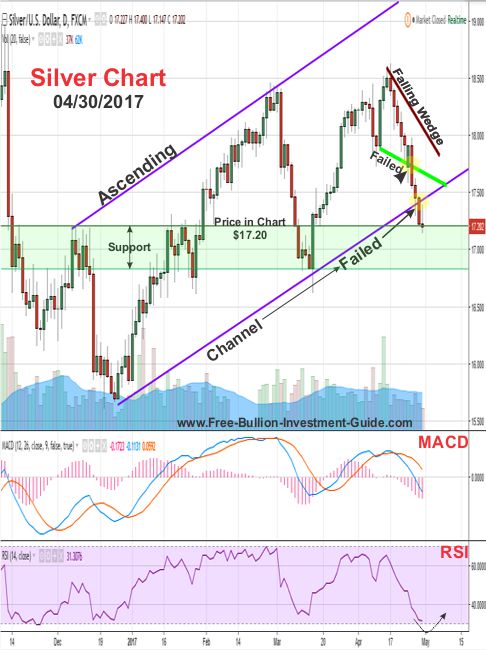
Last week, the chart below was posted, it showed a bullish pattern called a falling wedge.
It was a false pattern…
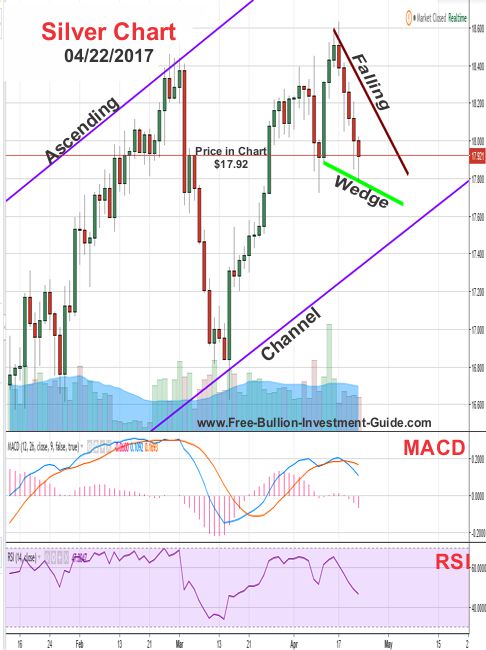
This pattern was a false pattern because the price fell through the bottom trend-line of the wedge; as you can see in the chart (below).
Silver also broke through its ascending channel.
Silver's move below these two positive trend-lines is a premonition into gold’s future. (I’ll explain in the gold section below).
Note: 'Ascending' & 'Descending' Trading Channels always fail, when the price breaks either above or below a channel, it is a failure of the channel. A break in a channel shows a change in the consensus of the asset’s market.
Sometime this week, we should see an end to silver’s falling price because its RSI is in oversold territory, plus, it has good support between the $17.20 and $16.80 levels.
charts provided courtesy of TradingView.com
Silver's Price Resistance &
Support Levels
Silver's Resistance Levels
$17.90
$17.70
$17.50
Silver's Support Levels
$17.20
$16.80
$16.70
GOLD
Earlier this year, this guide posted several posts that showed you how gold was leading silver in their short-term trade: Gold leads Silver and Gold Still Leads Silver.
Then in the ‘Freak is back on a Leash' blog post, I showed you that silver took back the lead from Gold and resumed its traditional position.
Silver is still leading Gold, and in silver's charts above it is showing us gold’s future.
Gold’s price is currently being held up by current events: the Final French Presidential Elections on May 7th, the conflict in Syria, and the tensions with North Korea.
If there isn’t a surprise in the French Elections or if tensions don’t rise in Syria or North Korea, we can expect to see gold follow silver and fall in price.
Last week, the chart below was posted, it showed gold trading inside two negatives (bear) patterns, a ‘rising wedge’ and a ‘rising expanding wedge.’
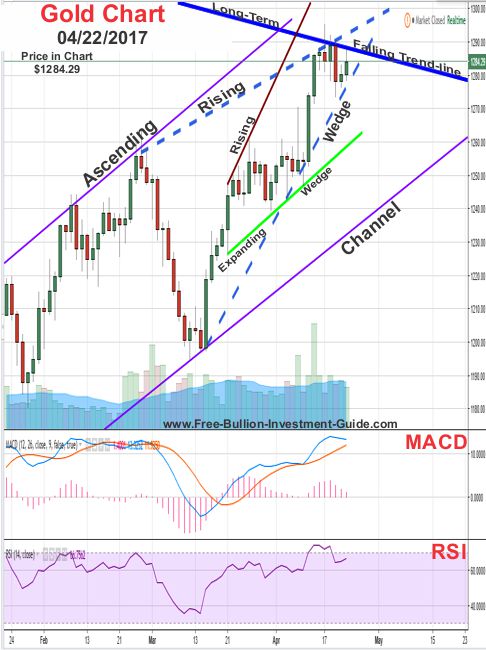
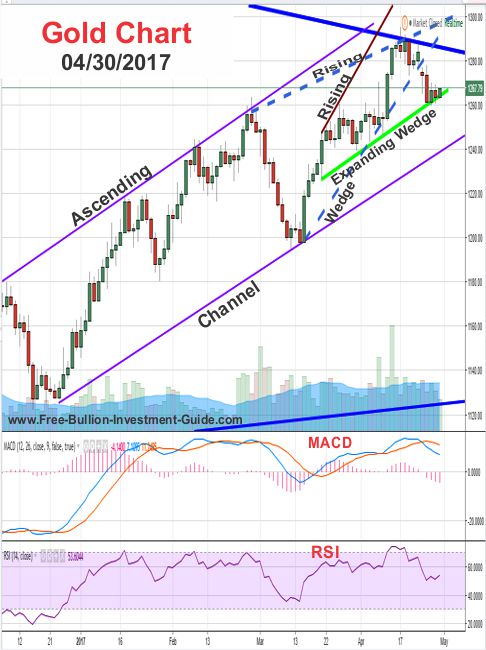
In the chart (below), we see that gold fell below the ‘rising wedge pattern’ (confirming it) and it is now trading on the ‘rising expanding wedge’s' support level.
This week, it will be up to current events to determine gold’s direction.
If things in the world get worse in the mind of traders, we will see gold rise.
However, if things don’t get worse, we will see gold confirm the rising expanding wedge pattern and come closer to trade near the bottom of its ascending channel.
Charts provided courtesy of TradingView.com
Gold's Price Resistance and
Support Levels
Gold's Resistance Levels
$1300.00
$1290.00
$1270.00
Gold's Support Levels
$1250.00
$1250.00
US DOLLAR
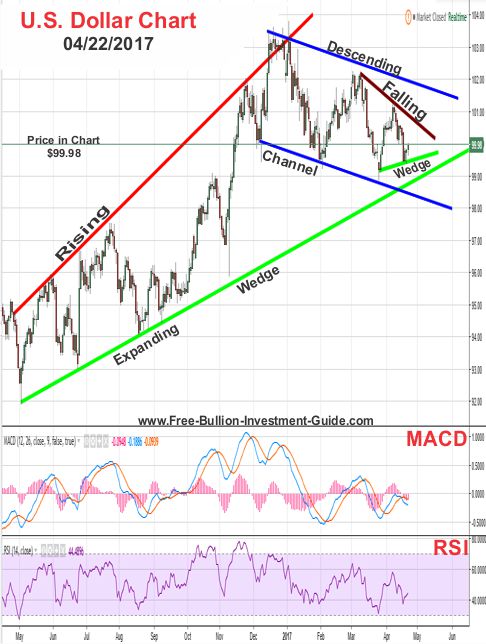
In last week’s U.S. Dollar chart, below, it showed a bullish pattern called a falling wedge.
Just like the one in silver’s chart, it too was a false pattern, but for different reasons.
(continued....)
Silver fell in price because unlike gold, it trades more as a commodity than a safe haven currency.
The U.S. dollar fell because it too trades like a safe haven currency, and when traders saw the results of the French Presidential Election's first round, they liked what they saw and sold the U.S. Dollar and bought Euros.
Fundamentals Always trump Technical Analysis.
The rise of the Euro is what caused the big drop in the price of the U.S. Dollar, and it is why the dollar is now trading along the bottom support level of the rising expanding wedge (bear pattern).
The final vote for the French elections will be on May 7th, traders will be happy if Macron wins.
If that is the outcome, we can expect the dollar to fall below the rising expanding wedge’s bottom level – confirming the bear pattern.
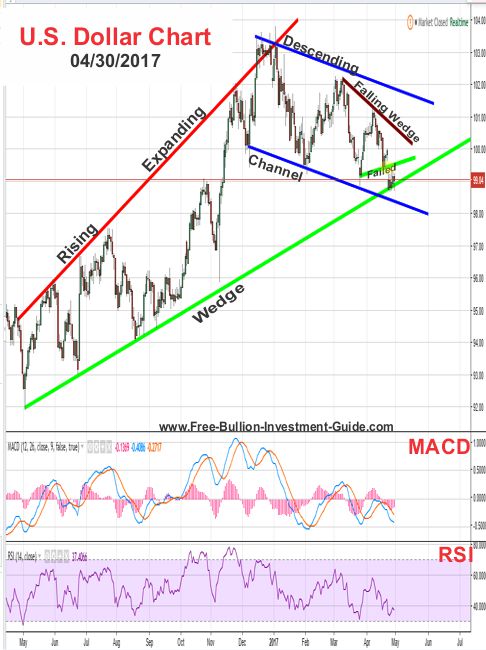
Charts provided courtesy of TradingView.com
U.S. Dollar's Price Resistance and Support Levels
U.S. Dollar's Resistance Levels
$99.75
$99.50
$99.20
U.S. Dollar's Support Levels
$98.30
$98.00
$97.60
Music
This weekend I listened to a lot of Alice in Chains, I have many favorites but this one is in my top five.
Alice in Chains - Nutshell
Have a Great Week.
Thank you for your time & God Bless,
Steve
'Click Here' see all of the prior Blog posts,
Thank You for Your Time!
|
Support this Guide & Paypal Thank You for Your Support |
|
|
 | |||||

Ad Gloriam Dei
This website is best viewed on a desktop computer.
Keep this Guide Online
& Paypal
Thank You for
Your Support
with Feedly
Search the Guide
| search engine by freefind | advanced |
Premium Canadian Bullion
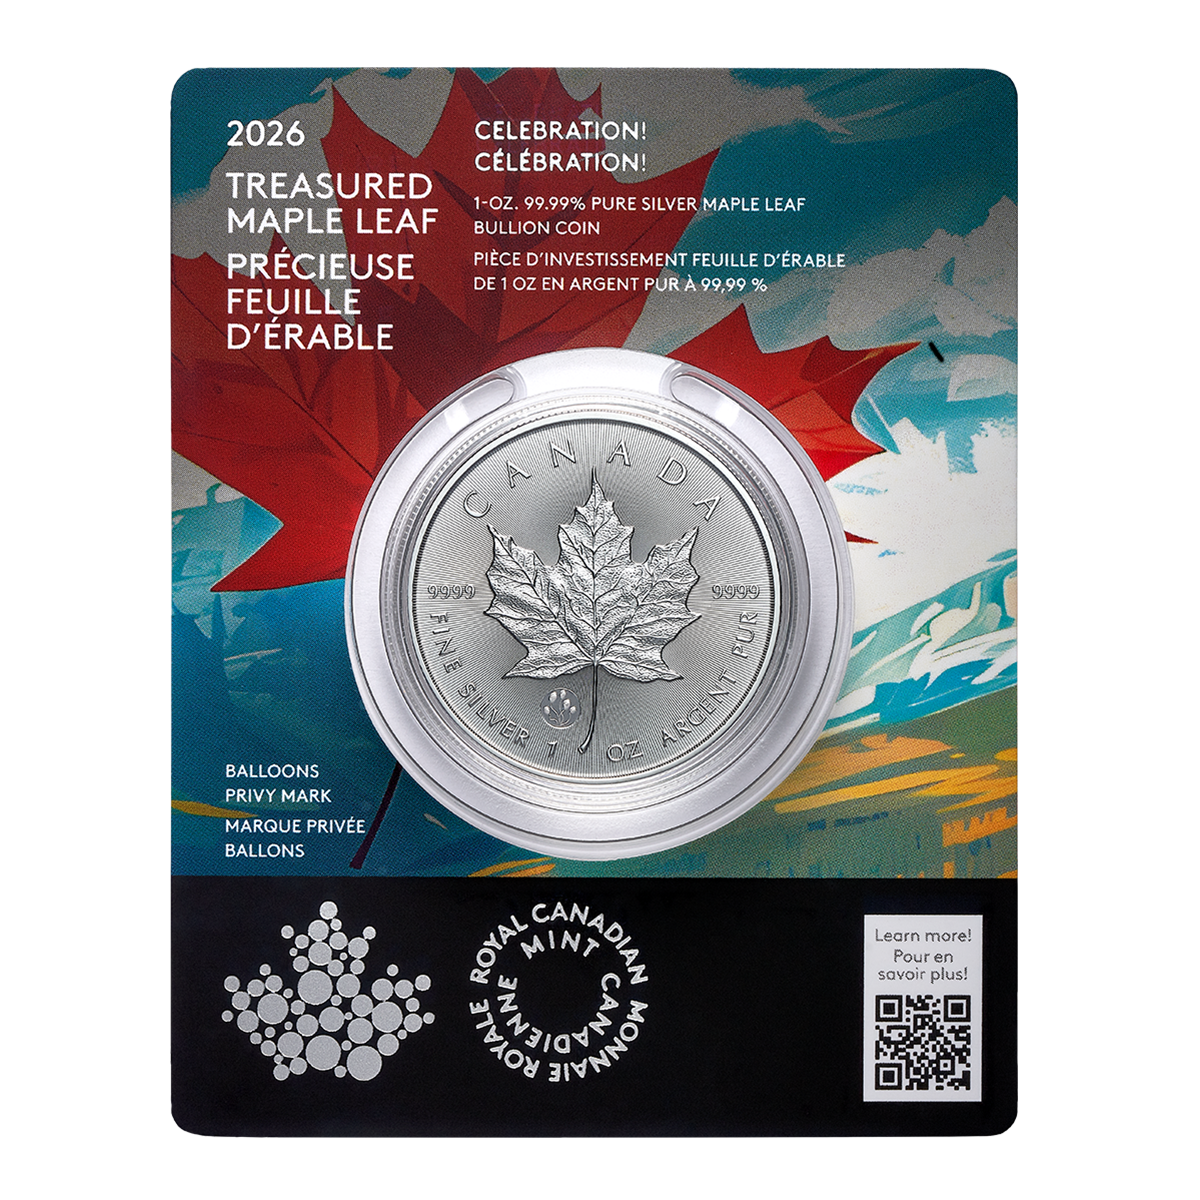
Give a lasting gift of the iconic Silver Maple Leaf bullion coin [More]
Free Shipping on Orders over $100 (CDN/USA)
or
From the U.K. Royal Mint


Daily
Newsletter
Updated Mintages for
American Gold Buffalo
American Gold Eagle
American Silver Eagle
2024 & 2025
Jerusalem of Gold Bullion
Coin photos
(bottom of page)
Mintages
for
2024
Gold & Silver Mexican Libertad
|
Gold Libertads |
Chinese Gold Coin Group Co.
& Chinese Bullion
Help Us Expand our Audience by forwarding our link
www.free-bullion-investment-guide.com.
Thank You!
Last Month's

In No Particular Order
November 2025
All Articles were Originally Posted on the Homepage


