
ExpressGoldCash - 4.9 star - Customer Reviews
Gold and Silver Break
Old Resistance and Finds New
in their short-term trade
Precious Metals Review and Outlook for the last week of
July 2017
Originally Posted on 07/24/2017 @5:00 pm
by Steven Warrenfeltz
Subscribe to this Blog

Hello,
Thank you for visiting the Free-Bullion-Investment-Guide's latest blog, I hope that you and your family are having a Great Summer!
Before we get to this week's post; below are a few of Last Week's Best News Articles that were taken from this guide's homepage.

The Fed just edged a step closer to recognizing a major policy misstep - Business Insider
Ponzi Scheme 101- When It's Too Good To Be True - Advancing Time
CHARTS : 11 Must See Gold Price Charts - Silver Doctors
One (more) Reason to Expect the USD to Continue to Fall - Knowledge Leaders Capital
Thoughts On Gold - The Deviant Investor
Best of the Week for Nano-Particle Cancer Research
NANO-PARTICLE CANCER RESEARCH : Tumor-targeting drug shows potential for treating bone cancer patients - Science DailyGOLD NANO-PARTICLE CANCER RESEARCH : Novel Approach Can Immobilize Cancer Cells - Specialty Pharmacy Times

Last week’s post was about how gold and silver's prices had started to bounce up after their dramatic price drop around the fourth of July.
In that post, I showed you some new positive technical patterns that had formed in their charts, I wrote that it may take more than a week for the metals to confirm those new patterns, but I stand corrected; it took less than 5-days.
This week’s review and outlook will include Gold, Silver, U.S. Dollar, Platinum, Palladium and the ‘HUI’ – Gold Bugs Index.
GOLD
In Review
Last week, I posted the chart below with the following commentary:
Last week, after the dust settled from gold's price drop, a 'falling expanding wedge' formed in gold's price chart (below).
All falling wedges are positive technical patterns, however for gold to confirm the pattern it will need to break above the upper resistance trend-line of the wedge.
In addition, gold's MACD (lower indicator) is showing that its direction is about to change from negative to positive, so we should continue to see gold climb this week, but some profit taking is also expected as it moves up.

Gold - This Week's Outlook
After gold broke above the Expanding Falling Wedge's upper resistance-line, confirming the pattern, its MACD and RSI (bottom indicators) show that more upside may be in store for gold.
However, the Broken ‘Long-term Falling Trend-line’ that gold broke about a month ago, still stands as resistance in gold’s move up.
But, because gold’s price has already broken this line, it should make it easier for it to break it again in the future.
So for the week ahead, it looks like gold will have some more upside, but the old resistance line may help it to consolidate below it.

Charts provided courtesy of TradingView.com
Gold's Price Resistance and
Support Levels
Gold's Resistance Levels
$1280.00
$1260.00
Gold's Support Levels
$1240.00
$1210.00
SILVER
In Review
Last week, the chart below was posted, in my outlook for silver, I only expected silver to test the resistance line of the falling wedge, I didn’t expect it to break it.
Below is last week’s commentary for Silver's outlook;
“…this week we should see silver stay above the long-term trend-line and start to test the resistance (red) trend-line of its falling wedge.”

As you can see, silver broke above resistance and in the process confirmed the falling wedge's technical pattern.
(continued...)

Silver - This Week's Outlook
Now that silver has moved passed above the Falling Wedge, its price is currently hitting resistance at $16.50.
However, its MACD and RSI are giving an indication that it is going to move higher, but when it reaches the $16.80 to $17.20 level it will find tougher resistance.
So we may see it move up this week, but expect to see some resistance/consolidation before silver reaches the red highlighted area in the chart below.

charts provided courtesy of TradingView.com
Silver's Price Resistance &
Support Levels
Silver's Resistance Levels
$16.80
$16.50
Silver's Support Levels
$16.00
$15.55
US DOLLAR
In Review
Last week, I posted the following commentary and chart for the U.S. Dollar.
When it breaks out of this (descending) channel a clearer future can be given for the dollar because it will be an indication that sentiment has changed; either for the better or the worse.

U.S. Dollar - This Week's Outlook
As you can see in the chart below, last week, the U.S. Dollar broke below the descending channel, and its future is not looking bright.
However, for the immediate future, the dollar looks like it may be bottoming out, its RSI and MACD are moving at the bottom of their indicators and the dollar has been moving consistently lower for almost two weeks, so some sort of upside correction is expected.

Charts provided courtesy of TradingView.com
U.S. Dollar's Price Resistance and Support Levels
U.S. Dollar's Resistance Levels
$95.50
$94.75
U.S. Dollar's Support Levels
$93.95
$93.50
PLATINUM
In Review
Below are last week’s commentary and chart for Platinum
“…in the chart below, Platinum did confirm the positive Falling Wedge, but it is still trading inside the Descending Channel.
So nothing much has changed, except to say that Platinum's MACD does look like it is about to turn up, so the price of platinum could start to test the upper falling trend-line of the descending channel this week.
Time will tell.
Plus, I’ve been saying for the last several weeks the following about Platinum:
Overall, Platinum's outlook won't change to the positive until it breaks above the Descending Channel.

PLATINUM - This Week' Outlook
As you can see in the chart below, last week Platinum did test the upper trend-line of its descending channel and broke it.
Note: All channels break, when they do, it's a sign that the old sentiment has been broken and a new outlook is in store for the asset.
For Platinum, this is a good sign that its price will stop falling inside this channel.
In the immediate future, no clear patterns have formed in Platinum's chart, its MACD looks like it may rise this week, but the price will be hitting a lot of resistance between the $940-$960 price levels, so we may see it move up to this price area then consolidate; time will tell.

Charts provided courtesy of TradingView.com
Platinum's Price
Resistance and Support Levels
Platinum's Resistance Levels
$945.00
$935.00
Platinum's Support Levels
$920.00
$910.00
PALLADIUM
In Review
For palladium, the chart below was posted and I simply stated that the chart had formed a falling wedge and that sometime in the future the price of the precious metal is expected to break above it.
Here’s what was written:
“So sometime in the near future, Palladium is expected to break this pattern, although this week's chart its MACD and RSI are showing that perhaps some pullback will happen.”

Palladium - This Week's Outlook
As you can see in the chart below, palladium did pullback last week as the MACD and RSI suggested
This week, the lower indicators aren’t giving much of indication as to which way the price of palladium will move.
But, the price chart looks like it may stop falling, so it could be ready to break the falling wedge’s upper resistance-line.

Charts provided courtesy of TradingView.com
Palladium's Price Resistance and Support Levels
Palladium's Resistance Levels
$885.00
$860.00
Palladium's Support Levels
$830.00
$800.00
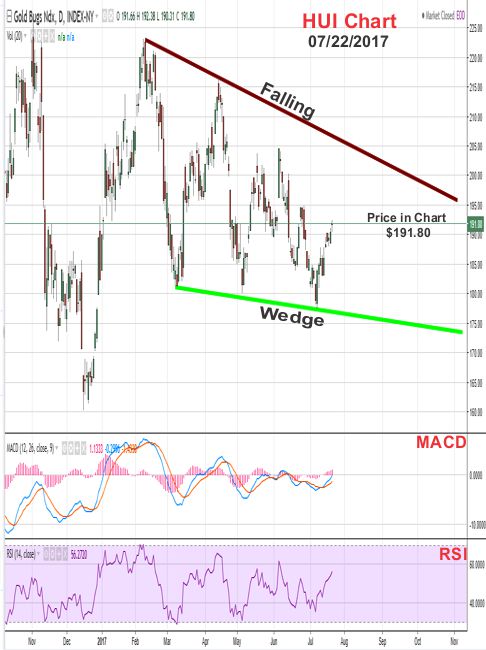
HUI - Gold Bugs Index
A few week’s ago, I wrote that I would start studying random charts that relate to the precious metals sector.
At the bottom last week’s review and outlook (here), I updated you on the GDX – Gold Miners ETF, this week I’m going to focus on the HUI – Gold Bug’s Index.
The chart below is of the HUI, which looks very similar to the GDX chart from last week; Coincidence? Doubtful.
The HUI and the GDX both have falling wedges in their charts which are positive signs, meaning that both prices are expected to rise above the upper falling trend-line of the wedge.
When this happens is anyone’s guess, but when it does I’ll follow up on it.

Charts provided courtesy of TradingView.com
Thank You for Your Time.
Have a Great Week.
God Bless, Steve
'Click Here' see all of the prior Blog posts,
Thank You for Your Time!
|
Support this Guide & Paypal Thank You for Your Support |
|
|
 | |||||

Recent Articles
-
Newsletter of the Free Bullion Investment Guide - May 2026
May 05, 26 02:25 PM
 The May 2026 newsletter of the Free Bullion Investment Guide provides the latest updates, fundamental and technical gold and silver market analysis, the best articles from last month, and a list of re…
 -
Newsletter of the Free Bullion Investment Guide - April 2026
Apr 05, 26 04:44 PM
 The April 2026 newsletter of the Free Bullion Investment Guide provides the latest updates, fundamental and technical gold and silver market analysis, the best articles from last month, and a list of…
 -
Newsletter of the Free Bullion Investment Guide - March 2026
Mar 04, 26 02:08 PM
 The March 2026 newsletter of the Free Bullion Investment Guide provides the latest updates, fundamental and technical gold and silver market analysis, the best articles from last month, and a list of…
 -
Newsletter of the Free Bullion Investment Guide - February 2026
Feb 07, 26 02:12 PM
 The February 2026 newsletter of the Free Bullion Investment Guide provides the latest updates, fundamental and technical gold and silver market analysis, the best articles from last month, and a list…
 -
Newsletter of the Free Bullion Investment Guide - January 2026
Jan 07, 26 04:07 PM
 The January 2026 newsletter of the Free Bullion Investment Guide provides the latest updates, fundamental and technical gold and silver market analysis, the best articles from last month, and a list o…

18W LED Security Light (Dusk to Dawn & Motion Sensor) - $32.99
from:
 LED Lighting

) (as of March 11, 2011)")
This website is best viewed on a desktop computer.
Keep this Guide Online
& Paypal
Thank You for
Your Support
with Feedly
Search the Guide
| search engine by freefind | advanced |

Give a lasting gift of the iconic Silver Maple Leaf bullion coin [More]
Free Shipping on Orders over $100 (CDN/USA)
The Sovereign 2026 Gold Bullion Coin in Card

Britian's
Royal Mint

Daily
Newsletter
Mintages & Photos
|

|
Silver Panda |

Mintages
for
2024
Gold, Silver, & Platinum
Austrian Philharmonic Bullion Coins

|
Silver Philharmonics  |
Platinum Philharmonics

Platinum and Palladium Bullion


Mintages
for
2025
Gold & Silver Mexican Libertad
|
Gold Libertads |


Updated Mintages for
American Gold Buffalo
American Gold Eagle
American Silver Eagle


Help Us Expand our Audience by forwarding our link
www.free-bullion-investment-guide.com.
Thank You!
Last Month's

In No Particular Order
April 2026
|
All Articles were Originally Posted on the Homepage Gold Nanoparticle Cancer ResearchSona Nanotech’s Hyperthermia Platform Boosts Immunotherapy Response in Colorectal Cancer Study - Tipranks Sona Nanotech Showcases Cancer Therapy Results At Prestigious Industry Cancer Conferences - Financial Times Development of gold nanostars coated with mesoporous silica for chemo-photothermal therapy - Published Research Paper - Journal of Drug Delivery Science and Technology (Science Direct) |
All Articles were Originally Posted on the Homepage