Gold Breaks Long-Term Resistance
Gold, Silver, U.S. Dollar, Platinum, and Palladium Review & Outlook
05/29/2017 thru 06/09/2017
Originally Posted on 06/05/2017 @2:22 pm
Last Updated on 06/05/2017 @8:48pm
by Steven Warrenfeltz
Subscribe to this Blog
Hello,
Thank you for visiting the Free-Bullion-Investment-Guide's latest blog post, I hope that you and your family have had a great week.
Before we get to this week's post; below are a few of Last Week's Best News Articles that were taken from this guide's homepage.

Silver and NASDAQ Strength Will Reverse - The Deviant Investor
As Americans Take on More Debt, Some Pockets of Concern - The Sentinel
PDF : REPORT : In Gold We Trust - incrementum
Fed Policymakers Don’t Understand the Money Supply Process - Hedgeye
Numismatic hobby awaits full disclosure on 2015 silver American Eagle output - Coin World
Best of the Week for Nano-Particle Cancer Research
GOLD NANOTECHNOLOGY : CANCER RESEARCH : WSU researchers developing new method of cancer treatment - The Daily Evergreen
GOLD NANOTECHNOLOGY : CANCER RESEARCH : Nanoparticles that chat back and forth could dispense medication - New Scientist
Gold Breaks Long-Term Resistance
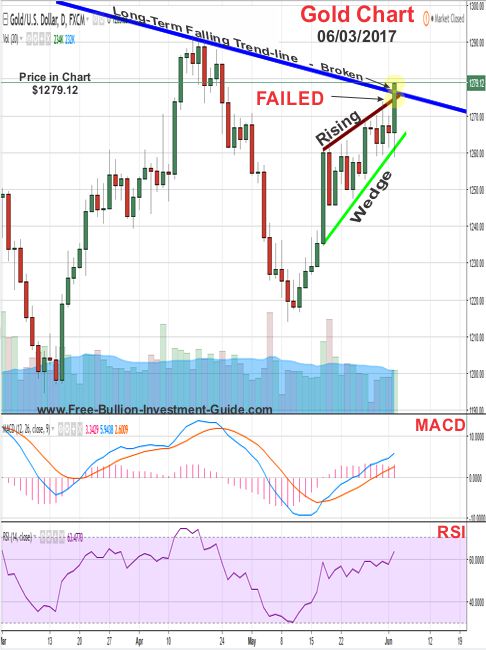
Last week, gold broke above its long-term falling trend-line and it has been 'a long-time coming.'

As you can see in the chart above, it's only been in the last year that gold has started to test the strength of this trend-line.
That was until Friday when gold broke through this long-term falling trend-line and closed above it for the first time in nearly 6-years.
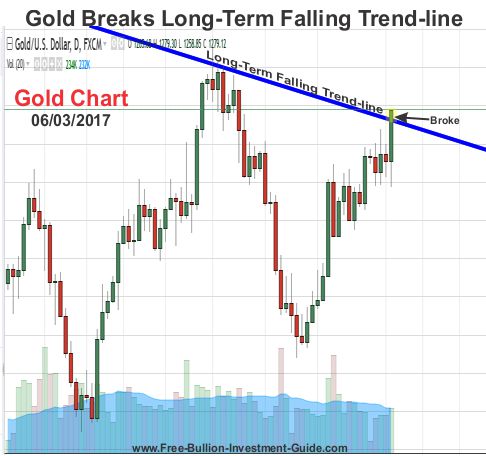
Chart Clarification...
Addition (06/5/2017 @8:48pm)
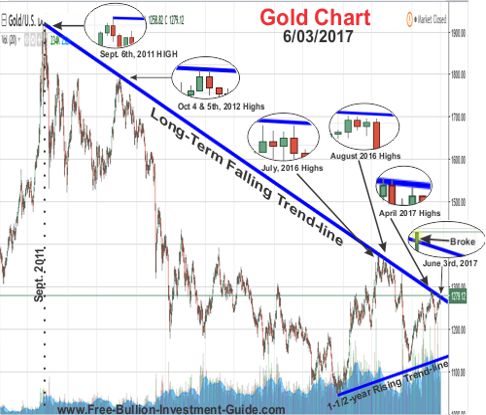
For additional clarification, I wanted to show you this additional chart so you can better see where the trend-line connects to gold's price highs.
Note:
Had the trend-line been lowered at the bottom of the chart to better accommodate the lower points, it would have undercut the 2012 highs.
In addition, had the line been raised it would have made the 2012 high's obsolete.
What Gave Gold the Extra Boost?
The biggest reason for gold’s rise this year has been due to uncertainty in the markets, uncertainty about World Events, uncertainty about the stability of the China, and uncertainty about the Federal Reserve and other Central Bank’s actions.
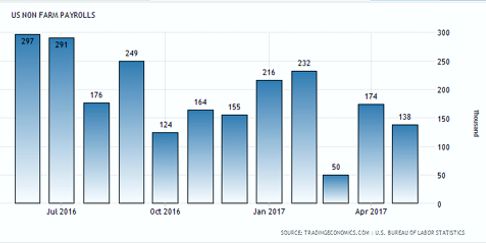
May’s Jobs Report put a lot of uncertainty in the markets about a June rate hike, which caused gold and the other precious metals to rise in price.
Skepticism Mounts for Fed Rate Hikes Post-June as Data Soften - BloombergThe jobs report stated that the labor market grew by 138,000 in May, which was 47,000 less jobs than the 185,000 jobs that most economists and traders were expecting.
What about Silver’s Long-Term Trend-line?
In this past year, I’ve written several blog posts about gold and silver’s trading relationship, silver usually leads gold, but currently, in their short-term trade, silver is slightly trailing gold, which is not normal.
However, silver is leading gold in its long-term and intermediate trade, and gold's most recent movement will allow me to show you an easy way to identify this fact.
The answer is found in their long-term falling trend-lines.
Gold has had one long-term falling trend-line, and as we’ve seen in the charts above, it just broke it.
However, silver has had several long-term falling trend-lines, and it has broken them, one by one, over the years.
Silver broke its last falling trend-line in July of 2016, and uncertainty helped it do it after the results of Brexit vote.
Therefore, as mentioned above this day for gold has been ‘a long-time coming’ because it was a day that silver had already foretold.
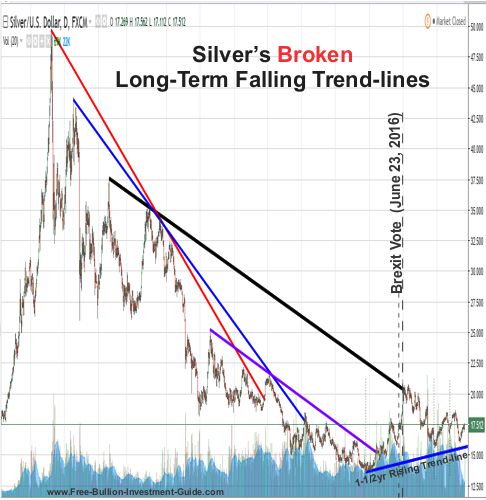
Note: Another way to see how silver leads gold is to compare their 2011 peaks. Silver's peak was in April of 2011, while gold's happened in September of 2011.
This week’s charts include Gold, Silver, U.S. Dollar, Platinum, and Palladium.
GOLD
A few weeks ago I stated the following: “In the past, there have been times when I’ve posted charts that I wish I could erase and forget about.”
Last week’s gold analysis was one of those times.
I was wrong in my outlook for gold last week, and below I show you where.
Below is last week's chart and analysis for gold’s outlook.
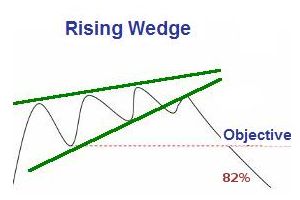
A 'Rising Wedge' is a negative pattern, so it's telling us that a pullback should be happening in sometime gold's near future.
But, until gold confirms the technical pattern, we can expect gold's price to continue to bounce around inside the wedge.
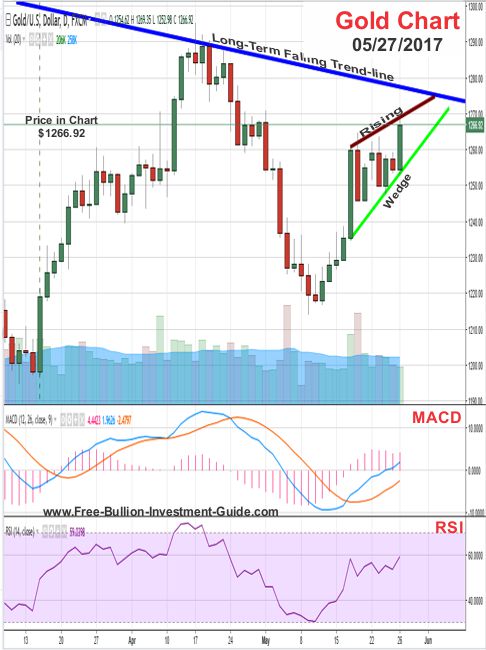
Clearly, by looking at the chart below you can see that the
rising wedge did not pan out the way it was expected.
Gold did move sideways for most of the last week, as it ‘bounced around inside the wedge,’ but after the jobs report was released, fundamentals trumped technical analysis, as it always does, and the price of gold broke above its long-term falling trend-line.
(continued…)
Charts provided courtesy of TradingView.com
For Gold’s outlook, next week I’m going to be ‘wiping the slate’ and remove gold's long-term trend-line from its chart.
This isn’t to say that the price of gold won’t fall back below the trend-line, I almost expect it, but the line has clearly been broken and if gold does falls back below it, it shouldn't be hard for it to move back above it.
After Friday’s move, this week's gold chart is giving the impression that gold will move sideways.
Plus, now that the long-term falling trend-line is broken, if gold does move up its closest resistance level is now the $1290 price level.
Gold's Price Resistance and
Support Levels
Gold's Resistance Levels
$1300.00
$1290.00
Gold's Support Levels
$1275.00
$1260.00
$1240.00
SILVER
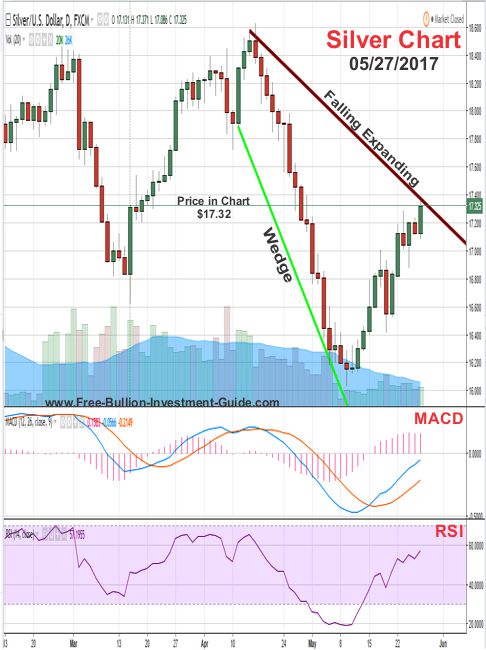
Last week's, silver chart and analysis is below.
“…this week looks a lot like last week since silver is now following gold, it is expected to break above the falling expanding wedge sometime soon, but the upper resistance level may prove to be a tough line for it to break like it was for gold.”
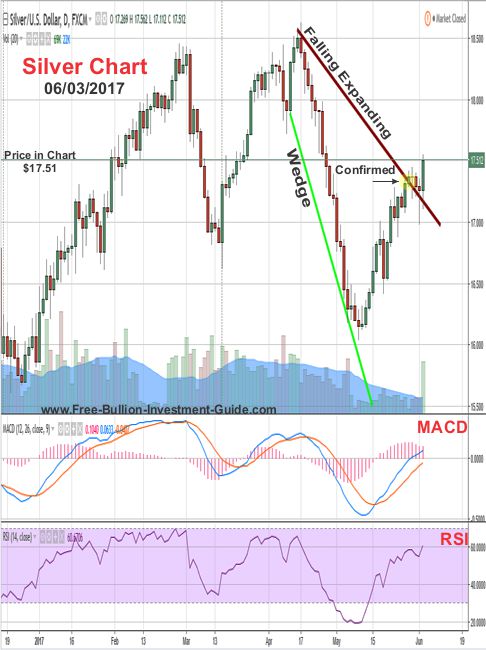
Last week, silver did break above the falling expanding wedge (confirming it), but it isn’t giving much of an indication as to which way it will move this week.
Silver’s MACD is giving the indication that we may see more sideways movement this week than up, but its RSI continues to climb, so it could move higher or pull back.
(continued...)
charts provided courtesy of TradingView.com
Beyond what the technical signs are showing, fundamentals will play a big roll this week for all the precious metals.
There are several market-moving news to look out for this week:
Current events (fundamentals) always play a role as to which way precious metals move; on June 8th the former director of the FBI, James Comey will testify in front of Congress, the ECB has a policy meeting, and the United Kingdom is having Parliamentary Elections.
I"ve learned not to speculate on these matters, but if there are any surprises in the news this week, the precious metals will most definitely be moved by it.
Plus, the Fed’s FOMC meeting is coming up on June 13-14, so as other market news is released this week, traders will try to interpret the Fed’s move, which will also have an impact on the price of the precious metals.
Uncertainty is a precious metal’s best friend and there’s definitely a lot of it in this week’s market.
Silver's Price Resistance &
Support Levels
Silver's Resistance Levels
$18.00
$17.75
Silver's Support Levels
$17.25
$17.00
US DOLLAR
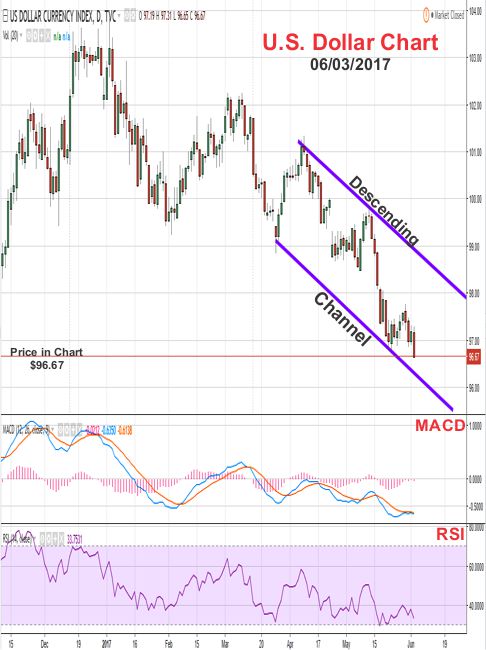
Below is last week's chart and analysis for the U.S. Dollar’s outlook.
This week when I was studying the US Dollar chart the only pattern that I could find was a 'Descending Channel.'
A descending channel is not a good sign for the dollar, but in all honestly, I will be surprised if the dollar trades in the steepness of this channel, time will tell.
In addition, for this week, the U.S. Dollar's MACD and RSI are both in oversold territory, so we should see a rise in the dollar.
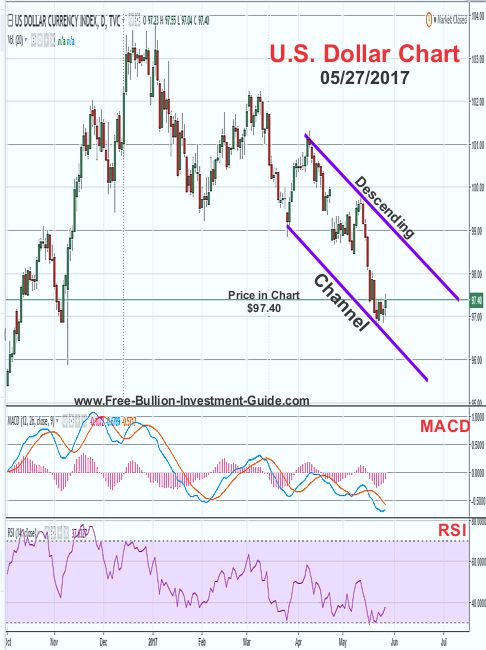
Last week, the U.S. Dollar only rose on Monday, then its general direction was down.
This week, the dollar will most likely continue to trade inside the descending channel, and even though its RSI and MACD are trading in oversold territory, it keeps making lower lows, and it looks like it may break below the descending channel sometime in the near future.
Time will tell.
Charts provided courtesy of TradingView.com
U.S. Dollar's Price Resistance and Support Levels
U.S. Dollar's Resistance Levels
$97.85
$96.90
U.S. Dollar's Support Levels
$96.40
$96.00
PLATINUM
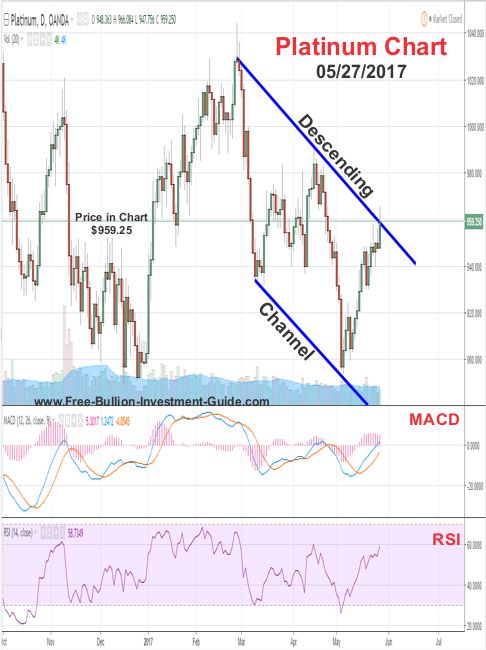
Here’s Platinum outlook and chart from last week (below).
Last week, platinum rose in price as expected and on Friday (May 26th) it hit resistance when it came in contact with the upper trend-line of the descending channel.
For the week to come, it’s hard to say what platinum will do, but its MACD and RSI look like they are about to crest, so we may see some pull back in the precious metal this week; time will tell.
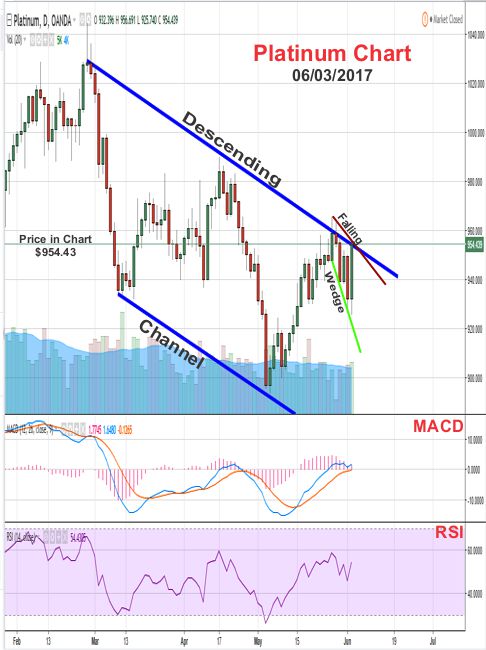
Platinum did pull back some last week, but after Friday’s jobs report was released its safe haven properties propelled it up and it once again tested the upper trend-line of the descending channel, but it did not break it.
For the week to come, after studying the chart, I was able to identify a falling expanding wedge, which is a positive pattern for the precious metal.
The wedge is rather large so it may or may not take a little bit of time for it to play itself out, but once it does, the descending channel should be destroyed.
Charts provided courtesy of TradingView.com
Platinum's Price
Resistance and Support Levels
Platinum's Resistance Levels
$980.00
$960.00
Platinum's Support Levels
$935.00
$920.00
PALLADIUM
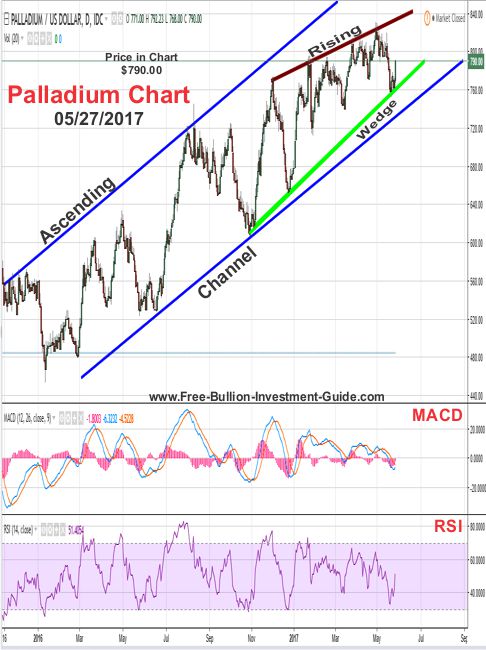
Below is last week’s palladium chart and analysis.
After letting the dust settle in Palladium’s chart last week, a new and much larger 'Rising Wedge' has emerged.
This pattern is not a good sign for palladium, and just by looking at the size of it, palladium’s price may fall below its ascending channel when it breaks.
As for the week to come, palladium’s MACD and RSI look to be turning up, so its price will most likely move up, but the upper trend-line of the rising wedge will serve as resistance.
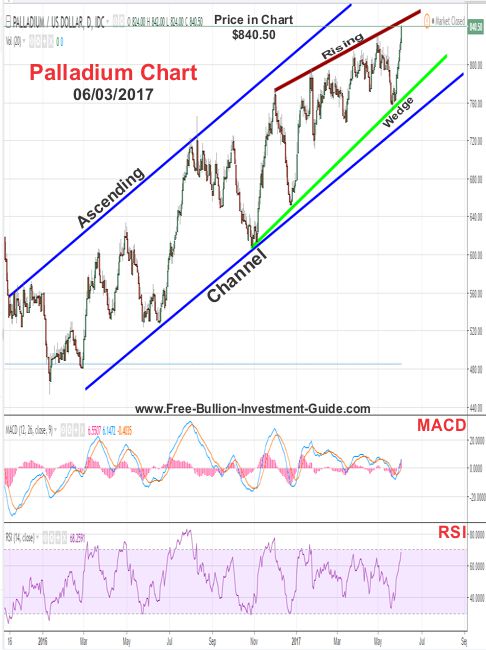
Last week palladium rose in price, but my chart's rising wedge proved to be drawn a little too narrow, because it did slightly break above the upper trend-line of the rising wedge.
This happened because I drew the trend-line by connecting palladium's open and closes, instead of connecting its highs and lows.
In the chart below, I raised the upper trend-line of the rising wedge.
(If you compare last week's and this week's palladium chart you can see the small adjustment)
The upper trend-line now connects palladium's highs and has more connecting points.
For this week's outlook, Palladium's RSI looks to be closing in on oversold territory and it should find strong resistance with the upper trend-line of the rising wedge.
So we should see some pull-back in palladium's price this week.
Charts provided courtesy of TradingView.com
Palladium's Price Resistance and Support Levels
Palladium's Resistance Levels
$860.00
$850.00
Palladium's Support Levels
$835.00
$800.00
Have a Great Week.
God Bless & Thank You for Your Time,
Steve
'Click Here' see all of the prior Blog posts,
Thank You for Your Time!
|
Support this Guide & Paypal Thank You for Your Support |
|
|
 | |||||
This website is best viewed on a desktop computer.
Keep this Guide Online
& Paypal
Thank You for
Your Support
with Feedly
Search the Guide
| search engine by freefind | advanced |
Premium Canadian Bullion
Give a lasting gift of the iconic Silver Maple Leaf bullion coin [More]
Free Shipping on Orders over $100 (CDN/USA)
or
From the U.K. Royal Mint


Daily
Newsletter
Updated Mintages for
American Gold Buffalo
American Gold Eagle
American Silver Eagle
2024 & 2025
Jerusalem of Gold Bullion
Coin photos
(bottom of page)
Mintages
for
2024
Gold & Silver Mexican Libertad
|
Gold Libertads |
Chinese Gold Coin Group Co.
& Chinese Bullion
Help Us Expand our Audience by forwarding our link
www.free-bullion-investment-guide.com.
Thank You!
Last Month's

In No Particular Order
January 2026
All Articles were Originally Posted on the Homepage

