Gold Moves Ahead of Silver
(in their Short-Term Trade)
Gold, Silver, U.S. Dollar, Platinum, and Palladium Review & Outlook
05/21/2017 thru 06/02/2017
Originally Posted on 05/29/2017 @11:58 pm
Subscribe to this Blog

Hello,
Thank you for visiting the Free-Bullion-Investment-Guide's latest blog post, I hope that you and your family have had a great week.
Before we get to this week's post; below are a few of Last Week's Best News Articles that were taken from this guide's homepage.

Value of gold remains the same, it is all assets Around it that change - Value Walk
VIDEO : Gold $10,000: The Full Report - Gary Christensen - Wealth Research Group
VIDEO : Is the Federal Reserve Good for America? - McCuistion
Exclusive: London's gold benchmark hit by volatility after banks exit - Reuters
Catalyst Of Our Economic Demise Yet To Be Determined - Advancing Time
You Shouldn't Be 'Super Excited' About This Record - Daily Wealth
Best of the Week for Nano-Particle Cancer Research
NANOMEDICINE : CANCER RESEARCH : What is nanomedicine, and how can it improve childhood cancer treatment? - Phys.org
GOLD NANOTECHNOLOGY : CANCER RESEARCH : Researchers Use Nanotherapy to Fight Cancer - R&D Magazine
Gold Moves Ahead of Silver

Usually silver leads gold in their long-term, intermediate and short-term trade, however, this year the two precious metals have been trading positions in the price charts.
In late February of this year, I wrote a series of posts about how gold had moved ahead of silver in their short-term trade. (See posts: Gold Leads Silver, Gold Still Leads Silver and ‘the Freak is back the Leash’)
This time, gold's move ahead of silver is small, so far, but I believe it is enough to point out, plus it allows me to show you why I always include the MACD and RSI (Relative Strength Indicators) in the technical charts.
The two indicators are very easy to read once you learn their movements and even though the candlestick price chart gave me my first clue into how gold's movement, it was the MACD and RSI that confirmed my suspicions.
MACD
First, we’ll take a look at Gold and Silver’s MACD (Moving Average Convergence/Divergence Oscillator) pronounced 'Mac-Dee".
Stock Charts.com offers an excellent definition of the MACD; here.
In their opening paragraph about the indicator, StockCharts states the following:
‘Developed by Gerald Appel in the late seventies, the Moving Average Convergence/Divergence oscillator (MACD) is one of the simplest and most effective momentum indicators available’….’the MACD offers the best of both worlds: trend following and momentum.’
In the chart below, the MACD for gold and silver have been isolated to show you that gold has moved slightly ahead of silver.
Gold is almost two points above the zero-line, while silver is still below zero.

In the chart above, the Blue Line is the MACD line, the Orange or Yellow line is the signal line.
The easiest way to interpret the MACD is to know that when you see the lines move far apart and the bar chart (histogram) crest, a change is imminent. Note: the bar chart crests before the lines do.
RSI - Relative Strength Indicator
The RSI (Relative Strength Indicator) is the other indicator mentioned above that I used to determine that Gold had moved ahead of Silver.
Like the
MACD, StockCharts.com offers a very easy to understand description of the RSI
indicator; seen here.
In the opening paragraph of StockCharts definition, the following is stated about the RSI:
Developed by J. Welles Wilder, the Relative Strength Index (RSI) is a momentum oscillator that measures the speed and change of price movements. RSI oscillates between zero and 100. Traditionally, and according to Wilder, RSI is considered overbought when above 70 and oversold when below 30.
In the chart below, I’ve compared both RSI’s of gold and silver, and although gold’s lead over silver in this indicator is small, it still offers some further insight into how the precious metals are moving.

This week’s charts include Gold, Silver, U.S. Dollar, Platinum, and Palladium.
Plus, since gold is now leading silver, I will be starting out with gold's analysis this week.
GOLD
Last week's gold analysis and chart outlook are posted below.
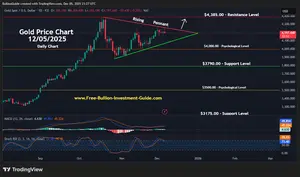
After studying gold’s chart for this week’s analysis, I decided to raise the upper trend-line of the falling expanding wedge because it still fits the pattern and the line still connects at several points on the chart (highlighted).
Plus, silver is still expected to rise above its falling expanding wedge, so it's only a matter of time before gold does it again.
For this week, some pull back is expected in gold, but like silver, fundamentals always trump technical analysis and if the news overwhelms the markets, we may see gold and silver pop again.

Well, no incredibly shocking news came out, so as expected gold moved up last week with some pullback, and it broke above the Falling Expanding Wedge on Friday (confirming it).

After the lines were removed from the confirmed 'Expanding Falling Wedge,' I found a rising wedge in gold's chart.
A 'Rising Wedge' is a negative pattern, so it's telling us that a pullback should be happening in sometime gold's near future.
But, until gold confirms the technical pattern, we can expect gold's price to continue to bounce around inside the wedge.

Charts provided courtesy of TradingView.com
Gold's Price Resistance and
Support Levels
Gold's Resistance Levels
$1290.00
$1275.00
Gold's Support Levels
$1260.00
$1240.00
SILVER
Below is last week’s silver analysis and chart that was posted for its outlook.
This week, silver’s MACD is still deep in oversold territory, so we should continue to see it rise in price this week, but its RSI is sitting at the halfway point between the oversold and over bought territory, so we will probably see some pull back as well.
The one caveat is what could come out in the news, yesterday I read that the USS Ronald Reagan Carrier Group just set off to relieve the USS Carl Vinson in the Pacific.
USS Ronald Reagan Now Underway On Patrol Amid Uncertainty in Asia - Military.comSo, fundamentals could cause silver (and gold) to pop again this week, time will tell.
Lastly, for silver, in the 'off-chance' that traders don’t panic about any additional press against the President or about rising tensions with North Korea, then we should see silver move up in price at a slower pace, but stay below the upper resistance trend-line of the Falling Expanding Wedge, we’ll have to wait and see what happens.

Last week, not much bad press came out about the President and the extra Carrier in the Western Pacific didn’t make silver (or gold) pop in price, instead we saw the ‘off chance’ scenario in last week’s outlook.
Silver slowly moved up but stayed below the upper resistance trend-line of the 'Falling Expanding Wedge.'
However, over the weekend, I read that another carrier group was sent to the Western Pacific, so this may cause a ‘pop’ in the precious metals sometime in the future.
US deploys third carrier group to Korea as China beefs up border, pleads at UN - Asia TimesBut, until that time comes to pass, the future looks mixed for silver (and gold).
Why?
Mostly because of another big factor that causes gold and silver to move; the Federal Reserve.
In two weeks (June 13-14) the Fed has their next meeting, and most including myself aren’t sure what they are going to do, but between now and June 14th this factor will be looming over the precious metals.
Therefore, this week looks a lot like last week,
since silver is now following gold, it is expected to break above the falling
expanding wedge sometime soon, but the upper resistance level may prove to be a tough line for it to break, like it
was for gold.

charts provided courtesy of TradingView.com
Silver's Price Resistance &
Support Levels
Silver's Resistance Levels
$17.75
$17.50
Silver's Support Levels
$17.15
$17.00
US DOLLAR
Below, is last week’s chart and analysis for the U.S. Dollar’s Outlook.
Last week, the dollar fell back below the rising falling wedge (confirming it); in addition, the U.S. Dollar also fell below the descending channel giving the indication to traders that for at least the immediate future the days of the rising dollar are over.
However, with all that being said, the dollar’s MACD and RSI are both moving in oversold territory, so a rise in the price of the dollar should happen sometime this week.

In the chart below, you can see that the U.S. Dollar's price rose last week, but not much.
This week when I was studying the chart the only pattern that I could find was a 'Descending Channel.'
A descending channel is not a good sign for the dollar, but in all honestly, I will be surprised if the dollar trades in the steepness of this channel, time will tell.
In addition for this week, the U.S. Dollar's MACD and RSI are both in oversold territory, so we should see a rise in the dollar.

Charts provided courtesy of TradingView.com
U.S. Dollar's Price Resistance and Support Levels
U.S. Dollar's Resistance Levels
$98.20
$97.85
U.S. Dollar's Support Levels
$96.90
$96.40
PLATINUM
Here’s Platinum outlook and chart from last week (below).
For the last several weeks I’ve been looking at Platinum’s chart trying to find a pattern, but nothing concrete was showing up, until this week, in the chart below it looks like Platinum has formed a descending channel; we’ll have to see how it plays out.
For this week, platinum should continue to move up slowly in price with some pullback. its lower indicators are not giving any clear indication as to which way it will go.

Last week, platinum rose in price as expected and on Friday it hit resistance when it came in contact with the upper trend-line of the descending channel.
For the week to come, it’s hard to say what platinum will do, but its MACD and RSI look like they are about to crest, so we may see some pull back in the precious metal this week; time will tell.

Charts provided courtesy of TradingView.com
Platinum's Price
Resistance and Support Levels
Platinum's Resistance Levels
$980.00
$960.00
Platinum's Support Levels
$935.00
$920.00
PALLADIUM
Below is last week’s palladium chart and analysis.
Last week, the rising wedge was confirmed.
This week palladium looks like it will continue to trade inside the ascending channel, however beyond that, no clear patterns have formed, so I’m going to let the dust settle from its latest move and wait and see what the chart looks like next week.

After letting the dust settle in Palladium’s chart last week, a new and much larger 'Rising Wedge' has emerged.
This pattern is not a good sign for palladium, and just by looking at the size of it, palladium’s price may fall below its ascending channel when it breaks.
As for the week to come, palladium’s MACD and RSI look to be turning up, so its price will most likely move up, but the upper trend-line of the rising wedge will serve as resistance.

Charts provided courtesy of TradingView.com
Palladium's Price Resistance and Support Levels
Palladium's Resistance Levels
$835.00
$800.00
Palladium's Support Levels
$785.00
$770.00
Have a Great Week.
God Bless & Thank You for Your Time,
Steve
'Click Here' see all of the prior Blog posts,
Thank You for Your Time!
|
Support this Guide & Paypal Thank You for Your Support |
|
|
 | |||||

Recent Articles
-
Newsletter of the Free Bullion Investment Guide - April 2026
Apr 05, 26 04:44 PM
 The April 2026 newsletter of the Free Bullion Investment Guide provides the latest updates, fundamental and technical gold and silver market analysis, the best articles from last month, and a list of…
 -
Newsletter of the Free Bullion Investment Guide - February 2026
Feb 07, 26 02:12 PM
 The February 2026 newsletter of the Free Bullion Investment Guide provides the latest updates, fundamental and technical gold and silver market analysis, the best articles from last month, and a list…
 -
Newsletter of the Free Bullion Investment Guide - January 2026
Jan 07, 26 04:07 PM
 The January 2026 newsletter of the Free Bullion Investment Guide provides the latest updates, fundamental and technical gold and silver market analysis, the best articles from last month, and a list o…
 -
Newsletter of the Free Bullion Investment Guide - December 2025
Dec 07, 25 04:35 PM
 The December 2025 newsletter of the Free Bullion Investment Guide provides the latest updates, fundamental and technical gold and silver market analysis, the best articles from last month, and a list…
 -
Newsletter of the Free Bullion Investment Guide - November 2025
Nov 08, 25 01:58 PM
 The November 2025 newsletter of the Free Bullion Investment Guide provides the latest updates, fundamental and technical gold and silver market analysis, the best articles from last month, and a list…

18W LED Security Light (Dusk to Dawn & Motion Sensor) - $32.99
from:
 LED Lighting

) (as of March 11, 2011)")
This website is best viewed on a desktop computer.
Keep this Guide Online
& Paypal
Thank You for
Your Support
with Feedly
Search the Guide
| search engine by freefind | advanced |

Give a lasting gift of the iconic Silver Maple Leaf bullion coin [More]
Free Shipping on Orders over $100 (CDN/USA)
The Sovereign 2026 Gold Bullion Coin in Card

Britian's
Royal Mint

Daily
Newsletter
Mintages & Photos
|

|
Silver Panda |

Mintages
for
2024
Gold, Silver, & Platinum
Austrian Philharmonic Bullion Coins

|
Silver Philharmonics  |
Platinum Philharmonics

Platinum and Palladium Bullion


Mintages
for
2025
Gold & Silver Mexican Libertad
|
Gold Libertads |


Updated Mintages for
American Gold Buffalo
American Gold Eagle
American Silver Eagle
2024 & 2025
Jerusalem of Gold Bullion
Coin photos
(bottom of page)
 Obverse side")


Help Us Expand our Audience by forwarding our link
www.free-bullion-investment-guide.com.
Thank You!
Last Month's

In No Particular Order
April 2026
|
All Articles were Originally Posted on the Homepage Gold Nanoparticle Cancer ResearchSona Nanotech’s Hyperthermia Platform Boosts Immunotherapy Response in Colorectal Cancer Study - Tipranks Sona Nanotech Showcases Cancer Therapy Results At Prestigious Industry Cancer Conferences - Financial Times Development of gold nanostars coated with mesoporous silica for chemo-photothermal therapy - Published Research Paper - Journal of Drug Delivery Science and Technology (Science Direct) |
All Articles were Originally Posted on the Homepage