Hard News
(plus)
Precious Metals Market Analysis
01/30 thru 02/10/2017
Gold, Silver, the U.S. Dollar, Platinum & Palladium
Originally Posted on 02/06/2017 @3:56pm
Hello,
I hope that you and your family have been safe and well.
This week's I wrote a short intro about the News and how hard its been to come by the news investors are looking for and where you can find it.
Hard News
Almost every evening I look for Bullion Market News to post on this guide’s homepage.
I look for factual news, news that is known as ‘Hard News,’ but lately, this kind of news has been hard to come by.

There are many different factors that relate to the Bullion Market; including, but are not limited to monetary policy, the stock market, bond market, futures markets, supply & demand, etcetera, etc.
For the last three weeks, almost every time I’ve searched the news I’ve been overwhelmed with politically driven financial news or financial news that is based more on ‘What if,’ than on Fact.
In addition, a lot of the sites that post these news articles are trying to cash in on a trending keyword: ‘Trump,’ instead of informing their readers.
Reading articles filled with ‘hype’ can negatively alter your investment strategy because the reporters of these stories use innuendo to stir your emotions.
Plus, titles/articles that stir emotions get clicks, the boring titles/articles that are filled with facts don’t, and unfortunately this has become the norm.
Excluding Love & Friendship, an emotional investment is usually an investment that will give you little return.
On the homepage of this guide, you won’t find news filled with emotional crap that either scares you or pisses you off to get you to invest.
Every evening (except Saturdays), I search for news that relates to the bullion market that will help you make an informed decision as to whether or not you want to get in or out of this market.
Lastly, starting next week, this blog will have a section titled ‘Hard News’ Featuring the Top Bullion Market News of the prior week (taken from the homepage).
GOLD
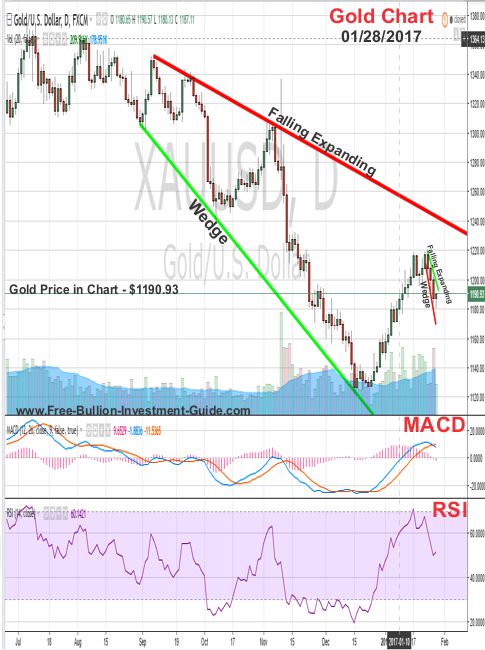
The chart below was from last week’s blog post: seen here.
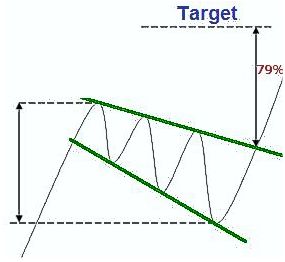
At the lower right side of the chart is a small 'Falling Expanding Wedge.'
The small wedge is surrounded by a larger ‘Falling Expanding Wedge that has been found in the charts of this blog since Nov. 2016.
The chart to the right is a ‘Text-Book’ example of a Falling a.k.a Descending Expanding Wedge from Forex-Central.com.
In the Gold Chart below, the price of gold bounced early last week; which offered a solid display that the expanding wedge pattern is playing itself out.
As for the week to come, gold's may consolidate or move higher.
(continued....)
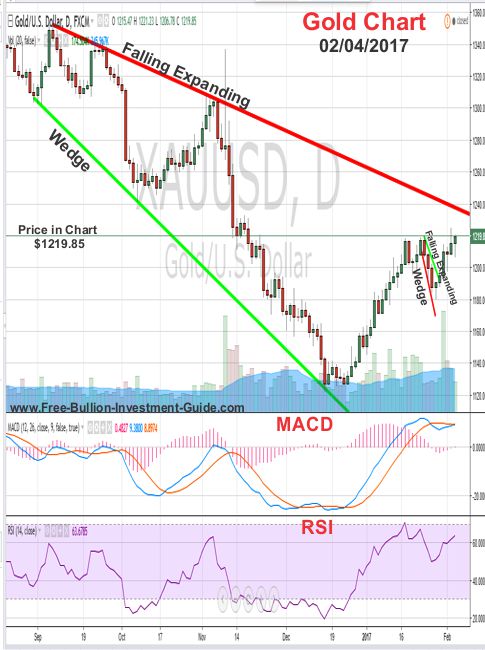
Gold’s MACD is only slightly above the ‘Zero’ Line and its RSI (relative strength index - lower indicator) is a little above 60.00; both of these indicators tell us that gold is barely trading in oversold territory.
All these signs are giving off bullish signals for gold, but gold will likely see some consolidation before it starts to test the falling trend-line of the larger falling wedge.
Gold's Price Resistance &
Support Levels
Gold's Resistance Level
$1265.00
$1250.00
$1225.00
Gold's Support Levels
$1200.00
$1180.00
$1170.00
SILVER
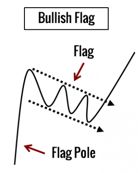
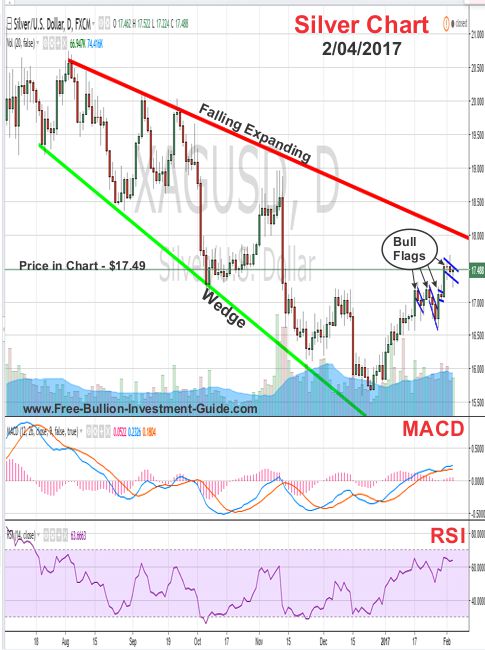
Last week silver continued to move up creating in its wake several ‘bull flags.’
Like gold, silver’s MACD and RSI are trending just above the overbought areas of the two indicators, but, by judging its movement over the last few weeks, it looks like we can expect more of the same; a quick move up, followed by some consolidation.
Charts provided courtesy of TradingView.com
Silver's Price Resistance and
Support Levels
Silver's Resistance Level
$18.15
$18.00
$17.85
Silver's Support Level
$17.10
$16.95
$16.75
US DOLLAR
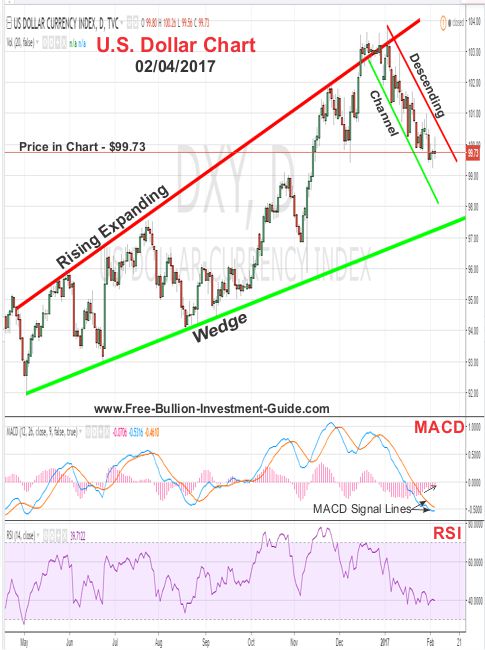
Last week, the U.S. Dollar fell below the $100.00 support level making it into a new resistance level for the dollar.
The US Dollar’s MACD and RSI are trading in the exact opposite position of Gold and Silver’s MACD and RSI, which means it is moving in the slightly oversold territory of these indicators.
However, the signal lines of the U.S. Dollar’s MACD continues to signal a change in price direction as they come closer together, plus the MACD's bar chart continues to reduce in size below the ‘Zero’ line.
Whichever way the dollar decides to trade next week, look for it to continue to trade inside its Descending Channel.
(continued…)
Charts provided courtesy of TradingView.com
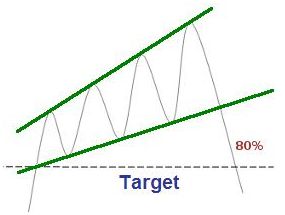
Note: Click the chart above for Forex-Central's definition of the Rising Expanding Wedge or 'Ascending Broadening Wedge.'
U.S. Dollar's Price Resistance and Support Levels
U.S. Dollar's Resistance Level
$101.00
$100.00
U.S. Dollar's Support Level
$99.75
$99.00
Platinum
Last week, I posted the chart below and stated that it looked like platinum’s chart had formed a bullish pattern known as an ‘inverse head and shoulders’ pattern.
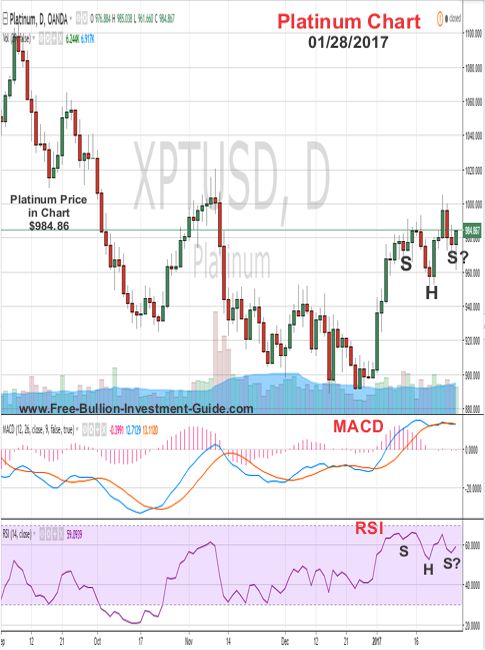
It was also stated last week, that if platinum's price completed this pattern, it would break above $1000.00
To be truthful, I wasn’t quite sure last week if platinum was going to do it and although it did break above $1000, platinum's price still hasn’t completed the ‘Inverse Head and Shoulders’ pattern in the chart below.
For platinum to complete the pattern, Platinum’s price will need to break above the neckline of the pattern.
In addition, like gold and silver, Platinum’s MACD and RSI are both sitting slightly above oversold territory, so the fact that it could break the neckline is not an impossible.
Ultimately, Time will tell, what if the pattern pans out or not.
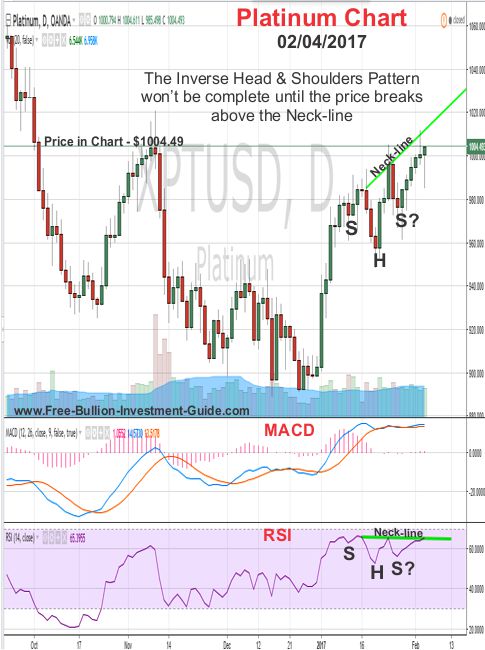
Platinum's Price Resistance and Support Levels
Platinum's Resistance Level
$1025.00
$1015.00
Platinum's Support Level
$980.00
$960.00
Palladium
In the first half of last week palladium’s price climbed in price, but fell in price on Thursday and Friday.
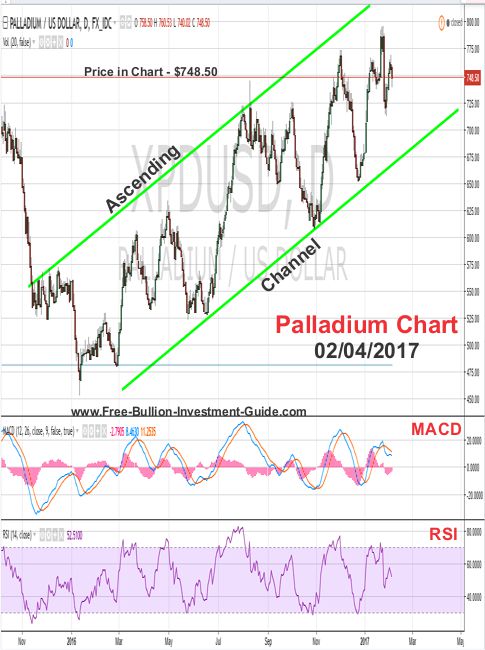
There are some technical pattern forming in palladium’s price chart, but its hard to say which pattern will play out, so I’m going to take a wait and see approach to palladium's chart this week.
Although I do expect it to continue to trade inside its Ascending channel.
Palladium's Price Resistance and Support Levels
Palladium's Resistance Level
$785.00
$770.00
Palladium's Support Level
$740.00
$720.00
Music
'Fly from the Inside' was the first song I heard from Shinedown when they became popular, several years ago.
After I heard it I became an instant fan.
Then, today I heard the song again, so I thought I'd share it with you.
‘Fly from the inside' by Shinedown
Have a Great Week.
Thank you for your time & God Bless,
Steve
'Click Here' see all of the prior Blog posts,
Thank You for Your Time!
|
Support this Guide & Paypal Thank You for Your Support |
|
|
 | |||||

Ad Gloriam Dei
This website is best viewed on a desktop computer.
Keep this Guide Online
& Paypal
Thank You for
Your Support
with Feedly
Search the Guide
| search engine by freefind | advanced |
Premium Canadian Bullion
Give a lasting gift of the iconic Silver Maple Leaf bullion coin [More]
Free Shipping on Orders over $100 (CDN/USA)
or
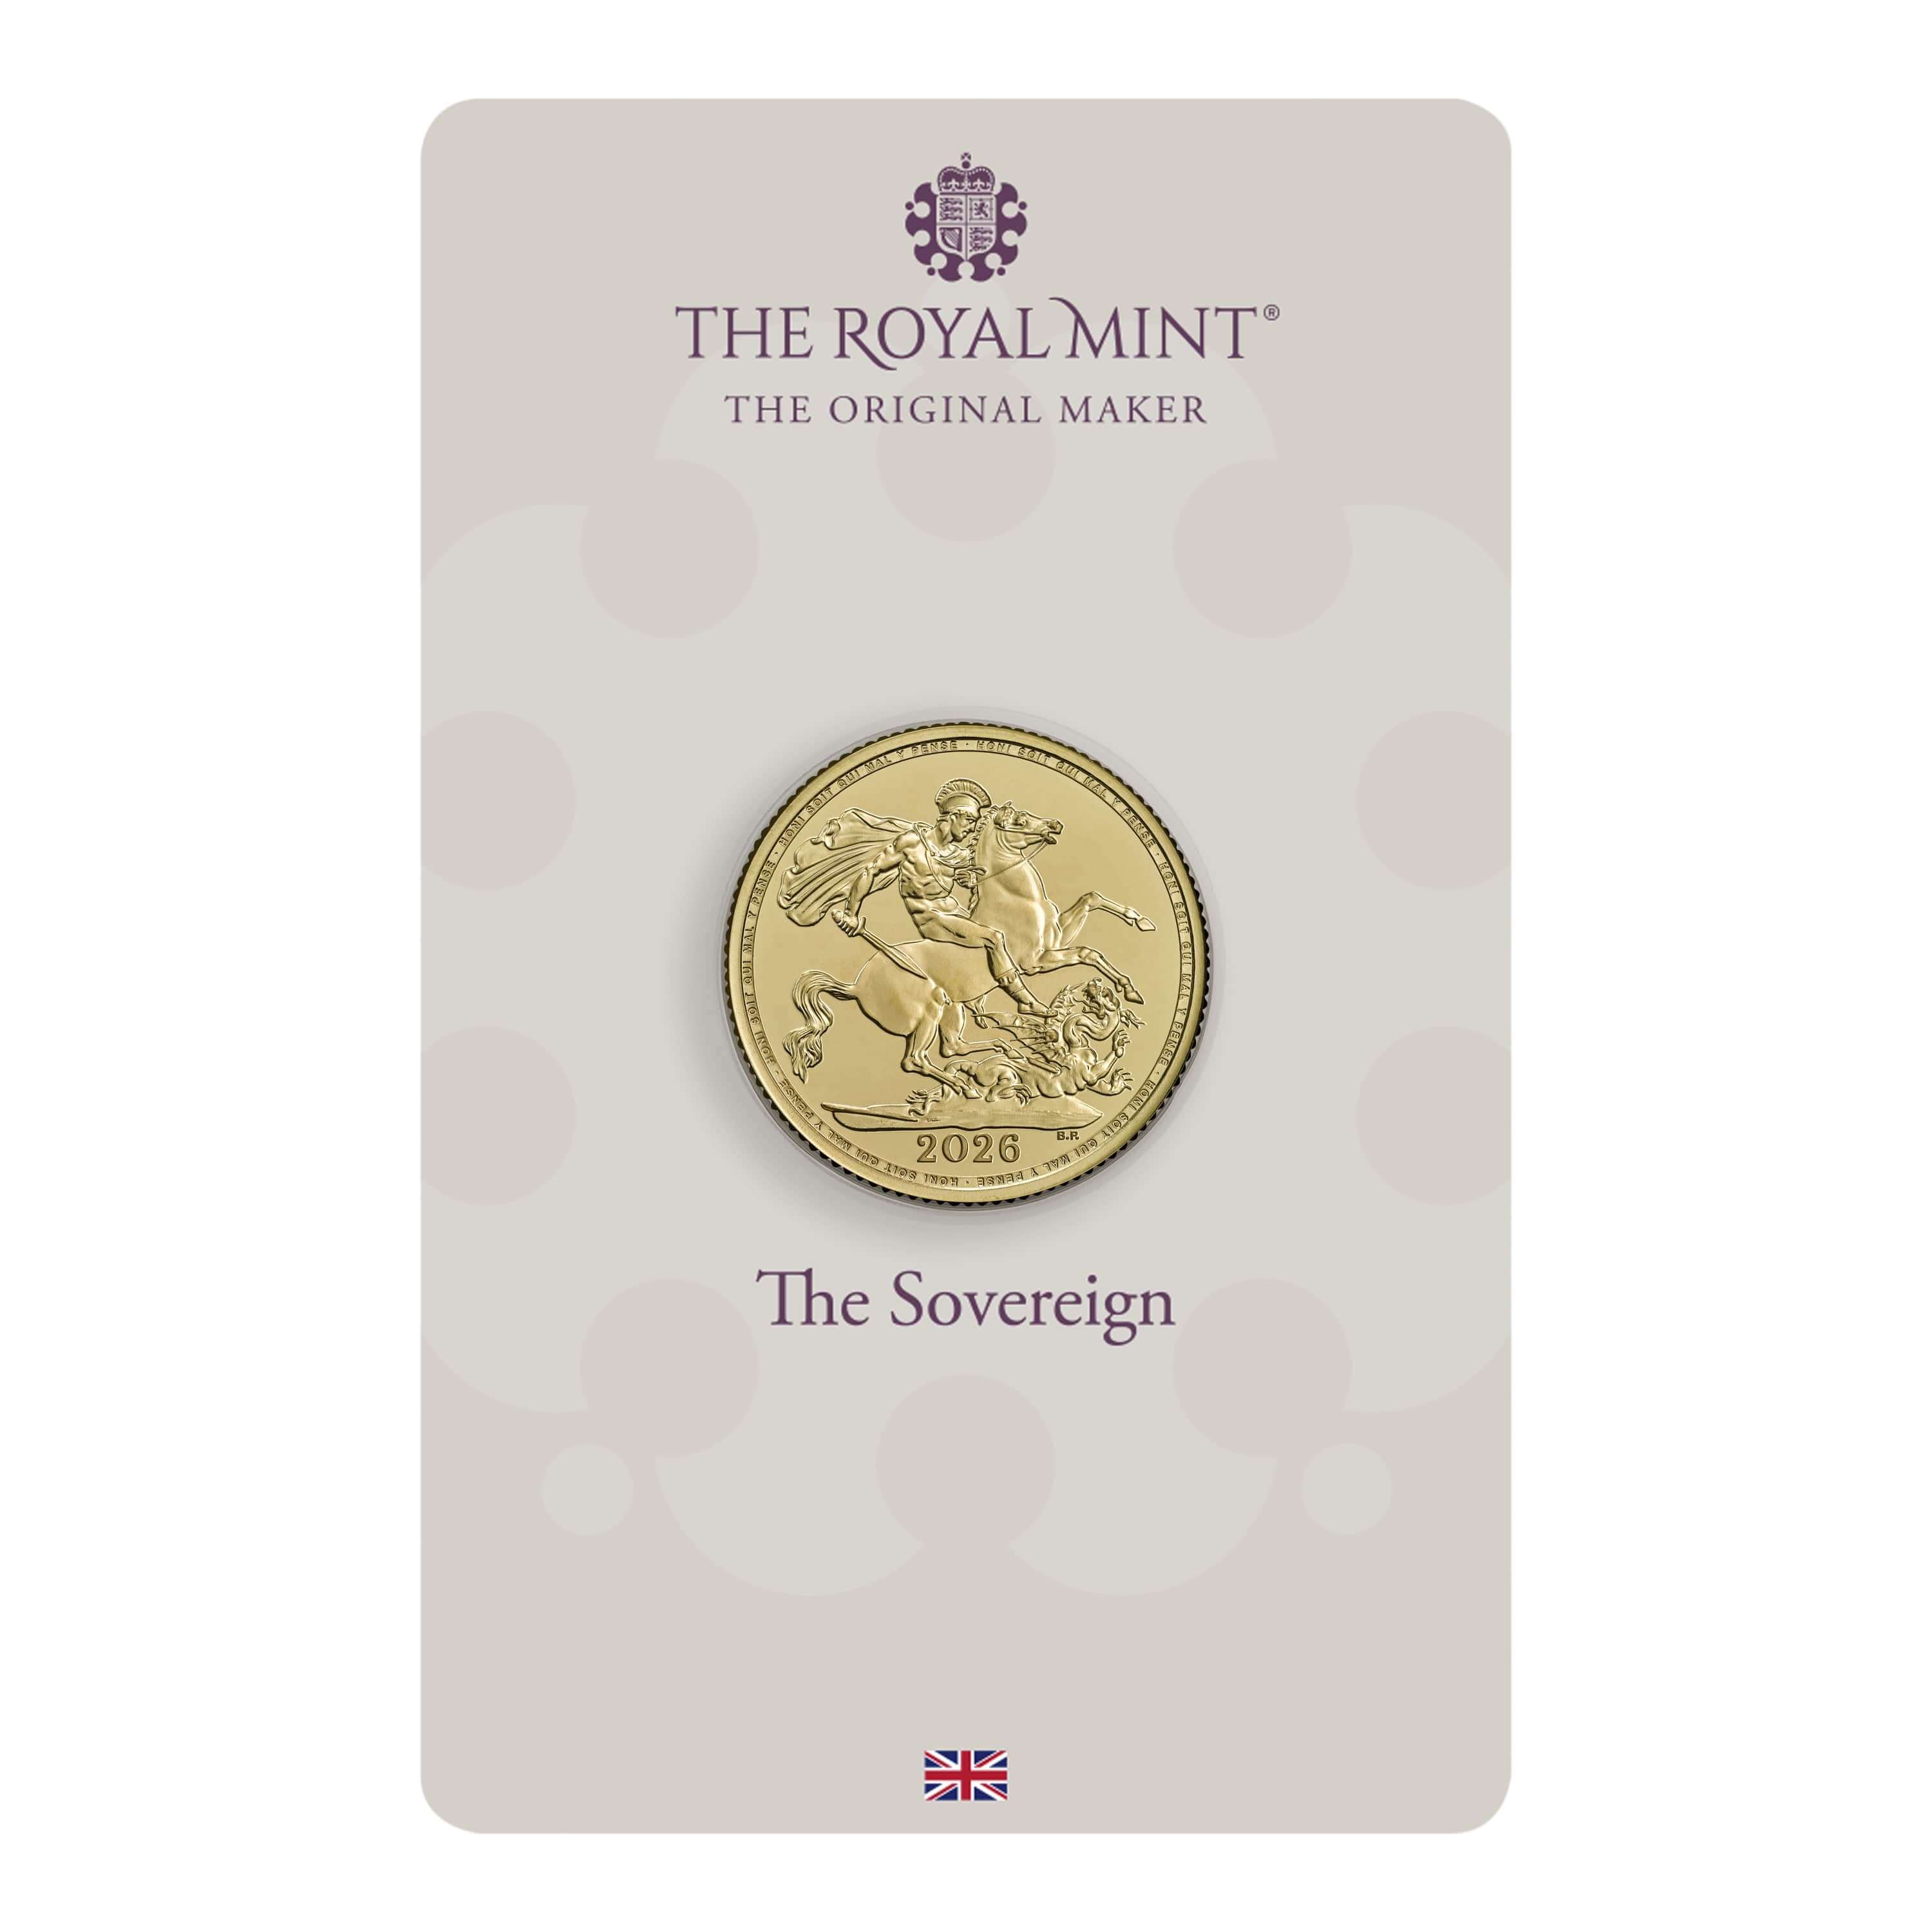
From the U.K. Royal Mint

Daily
Newsletter
Updated Mintages for
American Gold Buffalo
American Gold Eagle
American Silver Eagle
2024 & 2025
Jerusalem of Gold Bullion
Coin photos
(bottom of page)
Mintages
for
2024
Gold & Silver Mexican Libertad
|
Gold Libertads |
Chinese Gold Coin Group Co.
& Chinese Bullion
Help Us Expand our Audience by forwarding our link
www.free-bullion-investment-guide.com.
Thank You!
Last Month's

In No Particular Order
December 2025
All Articles were Originally Posted on the Homepage


