
ExpressGoldCash - 4.9 star - Customer Reviews
Precious Metals
Review and Outlook
01/16 thru 01/27/2017
Gold, Silver, the U.S. Dollar, Platinum & Palladium
Originally Posted on 01/23/2017 @12:19am
Precious Metals Review & Outlook

Hello,
I hope that you and your family have been safe and well.
This week I'm skipping the intro and going straight to the charts…
The order of this week’s Charts & Analysis are as follows:
Gold, Silver, U.S. Dollar, Platinum & Palladium.
GOLD
Last week, gold briefly paused at the $1200 level on Monday then moved quickly to the $1215 level on Tuesday, before falling back to close the week at $1208.
By looking at the chart below, it looks like the price of gold will continue to consolidate around the $1200-$1220 level before it continues to rise.
I think it will rise because there is a lot of uncertainty in the markets and uncertainty is often called gold’s best friend, plus a pattern has formed on the silver chart (in the next section) that is giving gold and silver positive indications of a further move up, this week.
Note: Silver and Gold generally move together in their daily trading, but silver leads gold in its long-term trade.


In addition, another bullish indicator on the gold and silver price charts is the 'Expanding Descending or Falling Wedge.'
Note: Click the chart above for Forex-Central's definition of the 'Falling Expanding Wedge' also known as a 'Descending Broadening Wedge.'
Gold's Price Resistance &
Support Levels
Gold's Resistance Level
$1250.00
$1220.00
Gold's Support Levels
$1200.00
$1180.00
SILVER

Silver started last week at the $16.80 level and ended the week above seventeen at $17.05.
It had been trading around the $16.80 level for almost a week before it broke above the $17 on Tuesday 1/17/2017.
The price of silver has now formed a ‘Bull Flag’ while consolidating at this level, to the right you can see an example of a bull flag; click the chart for a definition.
The bull flag may continue to move sideways this week, or the price of silver could break above it, time will tell what silver does this week.

Charts provided courtesy of TradingView.com
Silver's Price Resistance and
Support Levels
Silver's Resistance Level
$17.50
$17.25
Silver's Support Level
$16.70
$16.50
US DOLLAR
The U.S. Dollar continued to move down last week falling below the $101 level on Friday.
In this week’s chart I’ve indicated that a ‘Descending Channel’ has formed in the U.S. Dollar chart.
Last week, I misjudged this pattern to be a falling wedge, but after last week’s trade, this technical pattern has made itself easier to identify.
For the U.S. Dollar’s immediate future, it looks like it will trade between the $101.00 - $100.00 levels, as the market looks to the Federal Reserve’s remarks at its meeting on Jan. 26-27th.
However, it is doubtful that we’ll see any earth shattering news after this meeting, so expect the U.S. dollar to continue to trade inside this channel.
(continued…)

Charts provided courtesy of TradingView.com

Furthermore, the expanding rising wedge in the U.S. dollar
chart continues to be a negative sign for the dollar, so more down movement is expected.
Note: Click the chart above for Forex-Central's definition of the Rising Expanding Wedge or 'Ascending Broadening Wedge.'
U.S. Dollar's Price Resistance and Support Levels
U.S. Dollar's Resistance Level
$103.50
$102.90
$101.00
U.S. Dollar's Support Level
$100.00
$99.75
Platinum
Last week I wrote that Platinum’s price could be affected by the news that the U.S. EPA was accusing Fiat/Chrysler that they were manipulating the software in diesel vehicles to pass emissions tests.
So far, I haven’t heard any additional news about this allegation, but that doesn’t mean anything, the news last week stated that an investigation was started by the EPA.
If the EPA’s charges are true; that will be when it may hurt platinum.
Link to 1/13/2017 artilce: E.P.A. Accuses Fiat Chrysler of Secretly
Violating Emissions Standards
In last week’s analysis of Platinum, I didn’t offer any commentary about the chart because honestly there wasn’t much to say about it.
Last week, the Platinum price chart reached its crest and started to fall until a report about platinum & palladium supply was released on Friday 1/20, see chart below.

The report stated that supply for PGMs (Platinum Group Metals) was down year over year, which gave strength to platinum and palladium prices.
In addition, the Chinese extended a tax break to its citizens to buy small vehicles, which gave Palladium more momentum in price gain.
For an analysis of the report that was released last week, read this article by MINING.com : Palladium price surges to 22-month high.
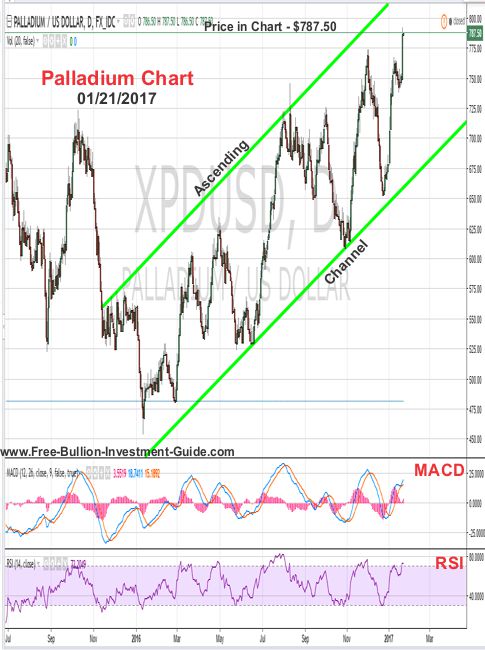
Palladium
Last week, I posted the chart below, and all can see that it was wrong after Friday’s move.

After reassessing Palladium’s chart, I can see a 'regular head and shoulders' topping pattern and an 'inverse head and shoulders' pattern; you probably can too.
But, instead of posting a confusing chart with a bunch of H's and S's on it, I've identified a completely different bullish pattern in the Palladium chart, a 'Rising or Ascending Channel.'
Palladium has been trading in this Ascending Channel' for over a year, and it doesn’t look like it will be stopping anytime soon.
Music
Numerous times, this week, I heard this song, it originally came out in the early 90’s, and for the longest time I hadn’t heard it until lately.
Then while I was writing this post it came on again, I’m a fan of the song and it has a great beat and lyrics.
So here it is...'Back to Life' by Soul II Soul
Have a Great Week.
Thank you for your time & God Bless,
Steve
Thank You for Visiting the Free Bullion Investment Guide
This Guide gives 50% or more of what it earns to those who are Battling Cancer.
Please Help Us Give by Supporting our Affiliates.
(Every Advertisement on the Guide is from one of our Affiliates)
'Click Here' see all of the prior Blog posts,
Thank You for Your Time!
|
Support this Guide & Paypal Thank You for Your Support |
|
|
 | |||||

Recent Articles
-
Newsletter of the Free Bullion Investment Guide - May 2026
May 05, 26 02:25 PM
 The May 2026 newsletter of the Free Bullion Investment Guide provides the latest updates, fundamental and technical gold and silver market analysis, the best articles from last month, and a list of re…
 -
Newsletter of the Free Bullion Investment Guide - April 2026
Apr 05, 26 04:44 PM
 The April 2026 newsletter of the Free Bullion Investment Guide provides the latest updates, fundamental and technical gold and silver market analysis, the best articles from last month, and a list of…
 -
Newsletter of the Free Bullion Investment Guide - March 2026
Mar 04, 26 02:08 PM
 The March 2026 newsletter of the Free Bullion Investment Guide provides the latest updates, fundamental and technical gold and silver market analysis, the best articles from last month, and a list of…
 -
Newsletter of the Free Bullion Investment Guide - February 2026
Feb 07, 26 02:12 PM
 The February 2026 newsletter of the Free Bullion Investment Guide provides the latest updates, fundamental and technical gold and silver market analysis, the best articles from last month, and a list…
 -
Newsletter of the Free Bullion Investment Guide - January 2026
Jan 07, 26 04:07 PM
 The January 2026 newsletter of the Free Bullion Investment Guide provides the latest updates, fundamental and technical gold and silver market analysis, the best articles from last month, and a list o…

18W LED Security Light (Dusk to Dawn & Motion Sensor) - $32.99
from:
 LED Lighting

) (as of March 11, 2011)")
This website is best viewed on a desktop computer.
Keep this Guide Online
& Paypal
Thank You for
Your Support
with Feedly
Search the Guide
| search engine by freefind | advanced |

Give a lasting gift of the iconic Silver Maple Leaf bullion coin [More]
Free Shipping on Orders over $100 (CDN/USA)
The Sovereign 2026 Gold Bullion Coin in Card

Britian's
Royal Mint

Daily
2026 Silver Kookaburra
Photo & Mintage Update

Newsletter
Mintages & Photos
|

|
Silver Panda |

Mintages
for
2024
Gold, Silver, & Platinum
Austrian Philharmonic Bullion Coins

|
Silver Philharmonics  |
Platinum Philharmonics

Platinum and Palladium Bullion


Mintages
for
2025
Gold & Silver Mexican Libertad
|
Gold Libertads |


Updated Mintages for
American Gold Buffalo
American Gold Eagle
American Silver Eagle


Help Us Expand our Audience by forwarding our link
www.free-bullion-investment-guide.com.
Thank You!
Last Month's

In No Particular Order
May 2026
 In Gold We Trust Report: Back to the Monetary Future - 20th Anniversary Edition - incrementum")
|
All Articles were Originally Posted on the Homepage Gold Nanoparticle Cancer ResearchNew shell helps gold nanoparticles keep shape under laser heat longer - PHYS.ORG Doctors Could Use Nasal Spray to End Fatal Brain Cancer in Pakistan - propakistani Video: (55:51) Realizing The Full Potential of Immunotherapy: The Clinical Promise of THT - Sona NanoTech Gold Nanoparticles That Behave Like a Liquid - NBIC New shell helps gold nanoparticles keep shape under laser heat longer - PHYS.ORG Sponge-like gold nanoparticles could upgrade ovarian cancer diagnostics - PHYS.org |
All Articles were Originally Posted on the Homepage