ExpressGoldCash - 4.9 star - Customer Reviews
Waiting on Time
(plus)
Precious Metals
Review and Outlook
01/09 thru 01/20/2017
Originally Posted on 01/16/2017 @12:51am
✟
Waiting on Time
Hello, I hope you had a great week.
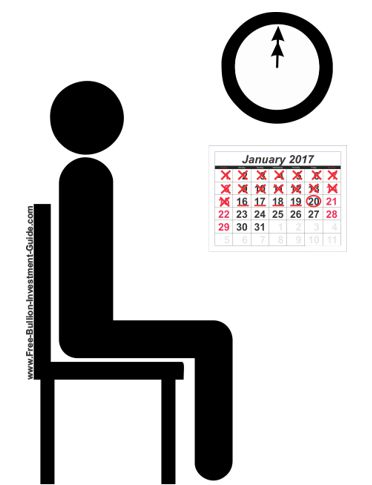
Not much has happened this week in the news concerning the markets; it seems everyone is trying to guess what's going to happen after January 20, 2017 – President-Elect Donald Trump’s Inauguration day.
The financial realm is showing its political biases with news reports about what 'may or may not' happen after Trump is inaugurated; I have a wait-and-see approach.
Some of the things that the President-Elect has said about the economy will likely provide a lot of growth; some of the other things he's said, I have my doubts, but he isn’t President yet, so all we can do is wait.
For the markets and the precious metals, it is up to the Federal Reserve, which has a meeting on January 26-27th. It appears the media and the markets are assuming that there will be another rate hike at this meeting.
It'll be a surprise to me if they do, but this year will be a hard one to predict concerning the Federal Reserve and interest rates; this is mostly because the Fed, like the financial media, is paying very close attention to what Trump will do.
But, unlike the media, I think it's foolish to predict what the Federal Reserve 'could' do in the future; there are way too many variables, so we’ll just have to wait and see what happens.
One thing is for certain about the Federal Reserve: They are almost always 'behind the curve.'
Precious Metals Review & Outlook
A quick note about this week’s Review & Outlook.
In this week’s charts, Platinum and Palladium have been added.
Periodically, these metals will be added to these weekly blog posts when the metals garner attention, like this past week. See the platinum and palladium sections below to learn more.
This week’s sequence of charts & analysis is as follows: Gold, Silver, U.S. Dollar, Platinum & Palladium.
GOLD
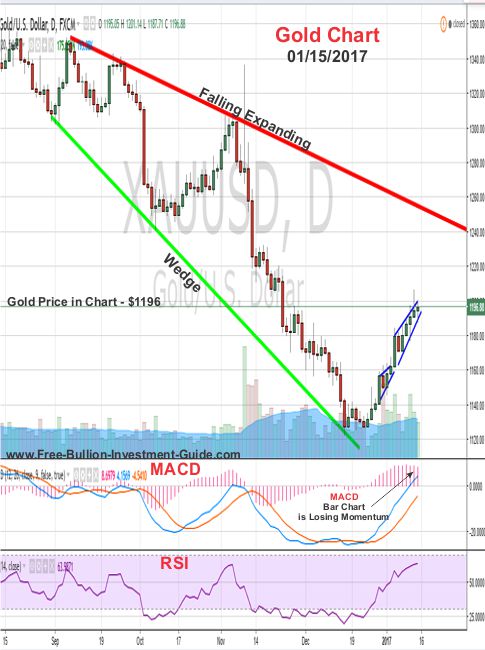
Last week, gold’s price continued to rise after consolidating at $1180, then moved up to the next resistance level at $1200.
In addition, gold’s MACD and RSI are signaling that a pause in the upward movement is inevitable.
The MACD’s ‘signal’ lines are widening, and its bar chart is showing a loss of momentum; this is not a good sign. Plus, Gold’s RSI (relative strength indicator) is starting to crest. (chart below)
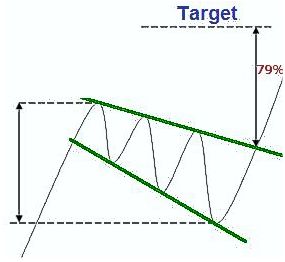
It's difficult to predict what gold will do this week due to the volatility in the market. We can expect some consolidation around the $1,200 level. After that, we will have to wait and see which direction gold takes. However, there is a bullish expanding falling wedge pattern on the charts that could influence gold's price.
Note: Click the Sample Chart above for Forex-Central's definition of the Falling Expanding Wedge.
Charts provided courtesy of TradingView.com
Gold's Price Resistance &
Support Levels
Gold's Resistance Level
$1250.00
$1225.00
$1200.00
Gold's Support Levels
$1180.00
$1120.00
$1100.00
SILVER
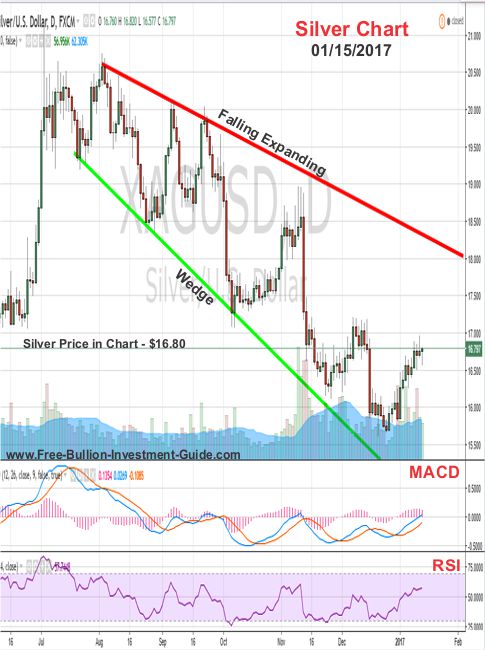
Silver’s price chart resembles that of gold; it too is losing momentum to rise; consolidation appears to be its next phase.
This week could be silver’s time to lead gold in its price chart movement; plus, like gold, it too has a bullish expanding falling wedge looming over it, which is a huge positive pattern that reveals that even if gold and silver consolidate this week, the general direction of their prices is up.
Charts provided courtesy of TradingView.com
Silver's Price Resistance and
Support Levels
Silver's Resistance Level
$17.10
$16.90
Silver's Support Level
$16.50
$15.85
$15.60

US DOLLAR
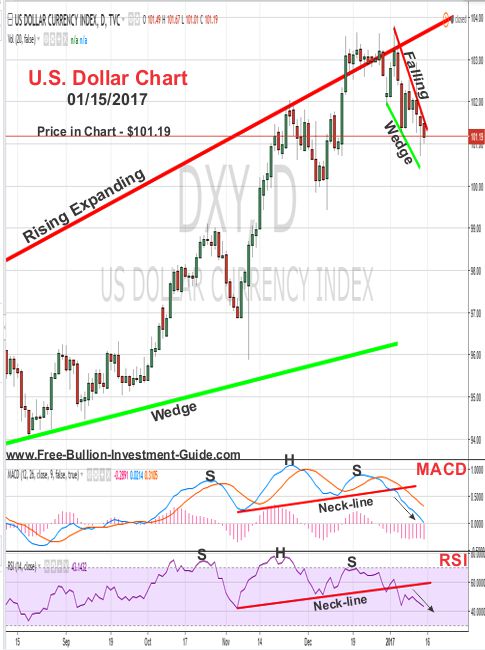
Before the end of 2016, on Dec. 19th, this blog post indicated a head-and-shoulders pattern was forming in the U.S. Dollar price chart's MACD and RSI (lower indicators).
In the "U.S. Dollar" section of last week's blog post here, the negative head (H) and shoulders (S) patterns in the MACD & RSI were confirmed, and are continuing to play out.
Recently, a falling wedge pattern has developed in the U.S. dollar chart. This suggests that we should expect some consolidation around the $101 level. However, both the MACD and RSI indicators for the dollar are still declining, which indicates that it may drop below $101 before Inaugural Day. (continued…)
Charts provided courtesy of TradingView.com
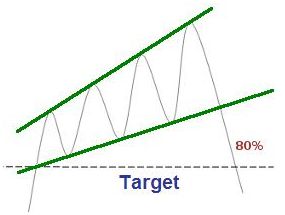
Furthermore, the expanding rising wedge in the U.S. dollar
chart continues to be a negative sign for the dollar, so more down movement is expected.
Note: Click the chart above for Forex-Central's definition of the Rising Expanding Wedge or 'Ascending Broadening Wedge.'
U.S. Dollar's Price Resistance and Support Levels
U.S. Dollar's Resistance Level
$103.50
$102.90
U.S. Dollar's Support Level
$101.00
$100.20
$99.75

BGASC - Customer Reviews - 4.8 stars
Platinum
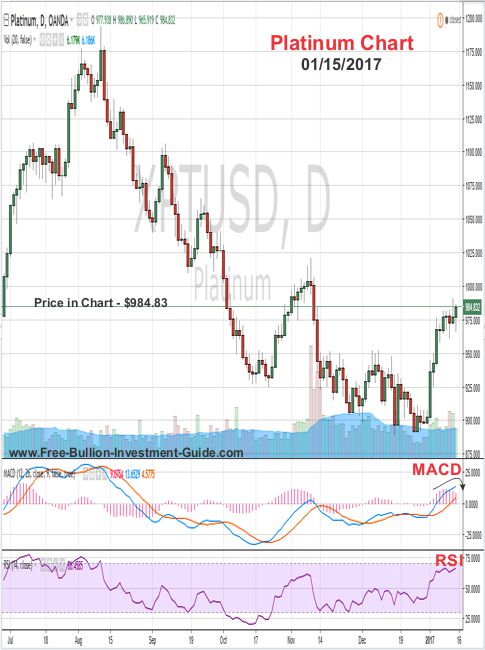
For the past several weeks, I've been monitoring the price of Platinum, but this weekend was the first time I examined the chart.
Unfortunately, the chart doesn't look promising, and there's not much more to say about it. Additionally, the news regarding Fiat Chrysler and the United States' EPA could have very negative impacts on Platinum's price.
On Jan 13th this story broke: E.P.A. Accuses Fiat Chrysler of Secretly Violating Emissions Standards
Platinum is the primary element in 'Diesel' Catalytic Converters that removes harmful gases from exhaust.
If the allegations are true, it is expected to hurt the sales of diesel vehicles, which will hurt the demand for platinum and its price.
The same thing happened in September of 2015 when Volkswagen admitted to rigging the software on their vehicles to pass emissions tests.
You can see what happened to the price of platinum (during this time) in the 'Platinum Section' on this guide's 3rd Quarter of 2015 report: here.
As for Platinum's chart, its MACD and RSI look to be in oversold territory and with the recent news, it looks like a change in direction isn't too far away.
Palladium
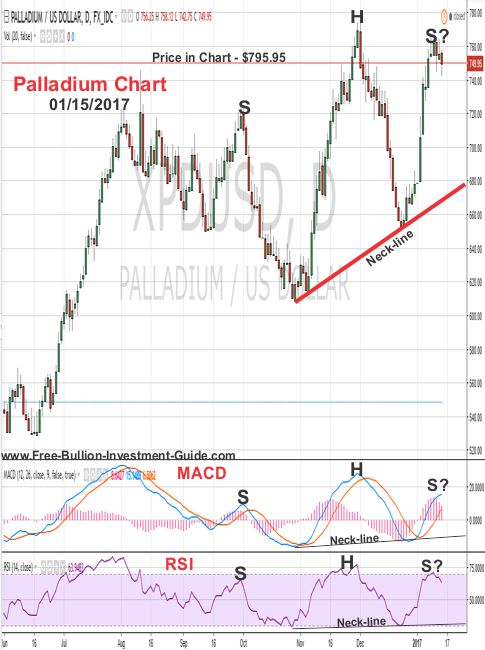
On Palladium’s chart, I see what looks like a head and shoulders top forming.
I could be getting way ahead of myself with this Palladium analysis, but I wanted to bring it to the attention of those who might be interested in getting in Palladium.
For the head and shoulders pattern to form in a chart the price will need to fall below the neckline, indicated in the chart.
However, the news story above about Platinum could completely change the pattern (below).
The reason being, Palladium is the primary metals used in catalytic converters for gasoline engines and this latest revelation about Fiat/Chrysler could help increase the sales of gasoline cars and in-turn Palladium.
Music
This week I listened to all kinds of music, so I'll leave you with one of the best I heard.
'Into The Mystic' by Van Morrison
Thank you for your time & God Bless,
Steve
Thank You for Visiting the Free Bullion Investment Guide
This Guide gives 50% or more of what it earns to those who are Battling Cancer.
Please Help Us Give by Supporting our Affiliates.
(Every Advertisement on the Guide is from one of our Affiliates)
'Click Here' see all of the prior Blog posts,
Thank You for Your Time!
|
Support this Guide & Paypal Thank You for Your Support |
|
|
 | |||||


Recent Articles


-
Newsletter of the Free Bullion Investment Guide - September 2026
Sep 05, 26 08:47 PM
 The September 2026 newsletter of the Free Bullion Investment Guide provides the latest updates, fundamental and technical gold and silver market analysis, the best articles from last month, and a list…
 -
Newsletter of the Free Bullion Investment Guide - August 2026
Aug 05, 26 04:26 PM
 The August 2026 newsletter of the Free Bullion Investment Guide provides the latest updates, fundamental and technical gold and silver market analysis, the best articles from last month, and a list of…
 -
Newsletter of the Free Bullion Investment Guide - July 2026
Jul 05, 26 08:41 PM
 The July 2026 newsletter of the Free Bullion Investment Guide provides the latest updates, fundamental and technical gold and silver market analysis, the best articles from last month, and a list of r…
 -
Newsletter of the Free Bullion Investment Guide - June 2026
Jun 05, 26 03:06 PM
 The June 2026 newsletter of the Free Bullion Investment Guide provides the latest updates, fundamental and technical gold and silver market analysis, the best articles from last month, and a list of r…
 -
Newsletter of the Free Bullion Investment Guide - May 2026
May 05, 26 02:25 PM
 The May 2026 newsletter of the Free Bullion Investment Guide provides the latest updates, fundamental and technical gold and silver market analysis, the best articles from last month, and a list of re…

18W LED Security Light (Dusk to Dawn & Motion Sensor) - $32.99
from:
 LED Lighting



This website is best viewed on a desktop computer.

Keep this Guide Online
& Paypal
Thank You for
Your Support

with Feedly
Search the Guide
| search engine by freefind | advanced |
Daily
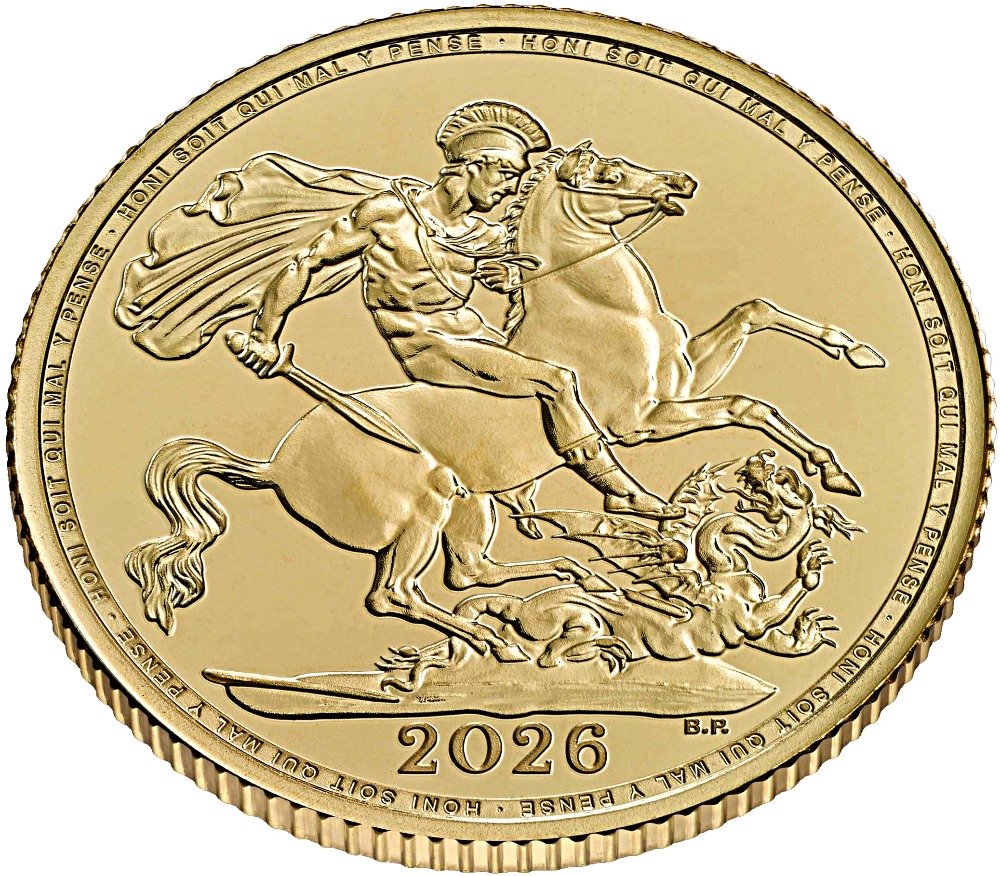
2026 U.K. Gold Sovereign Updates
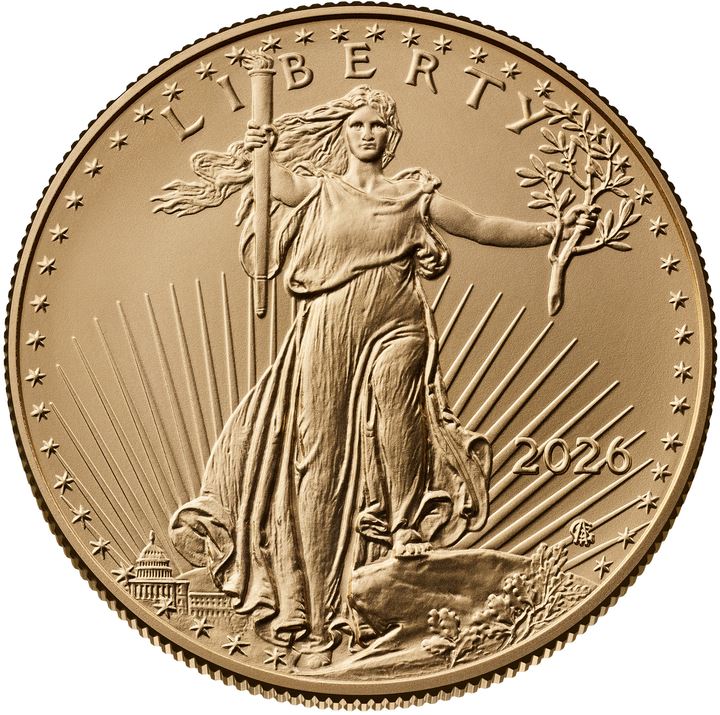
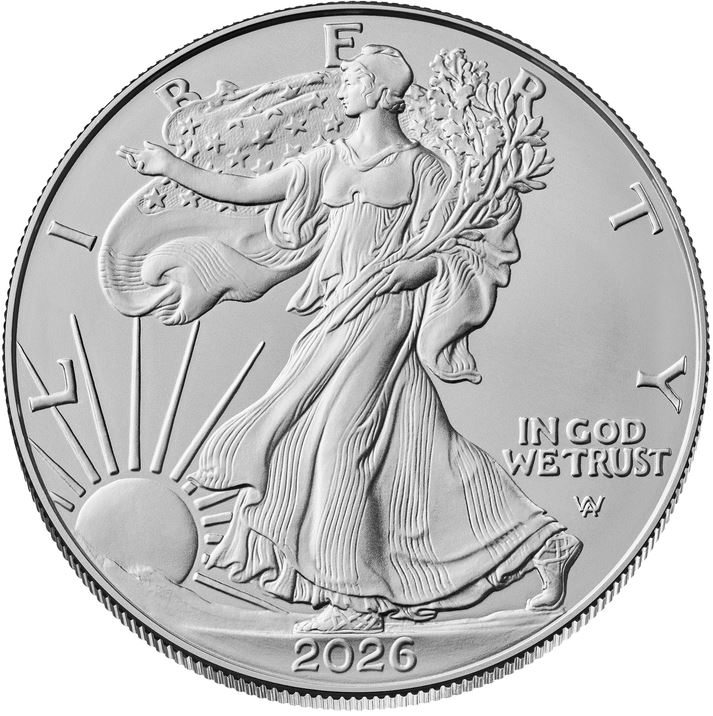
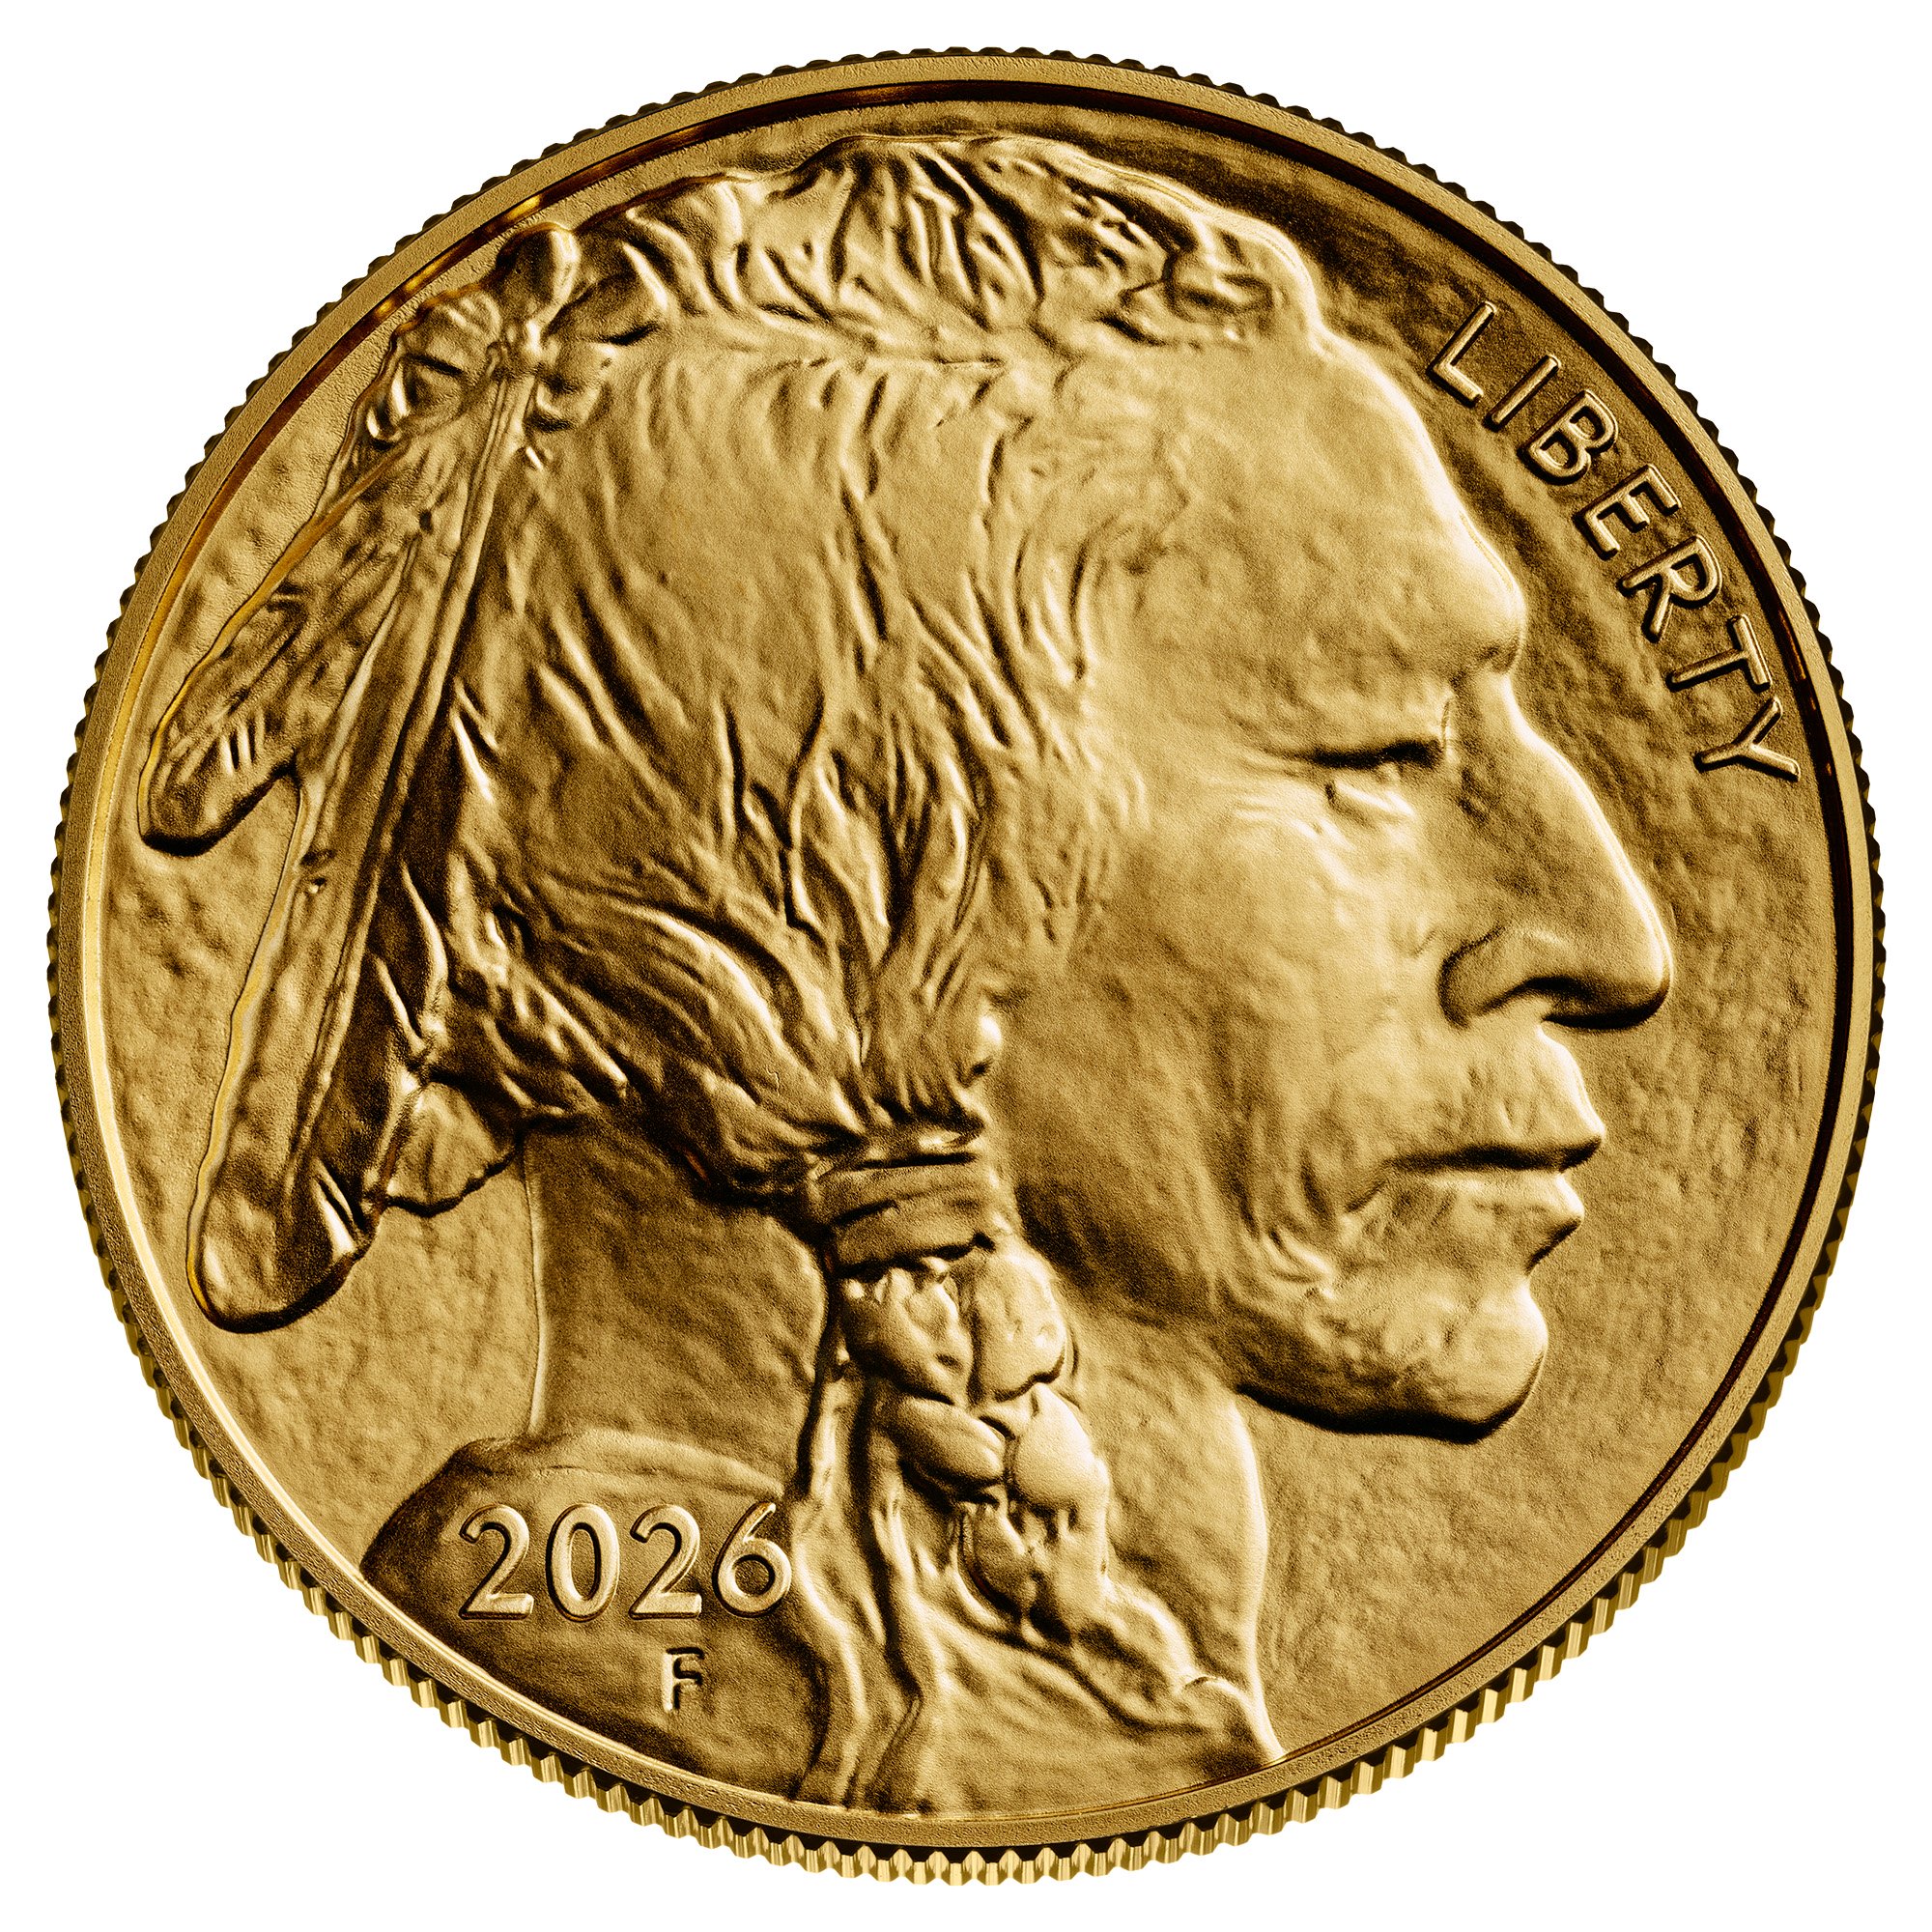
Gold and Silver American Eagle & Gold Buffalo Bullion Coin Mintage Updates
Newsletter
Updates for
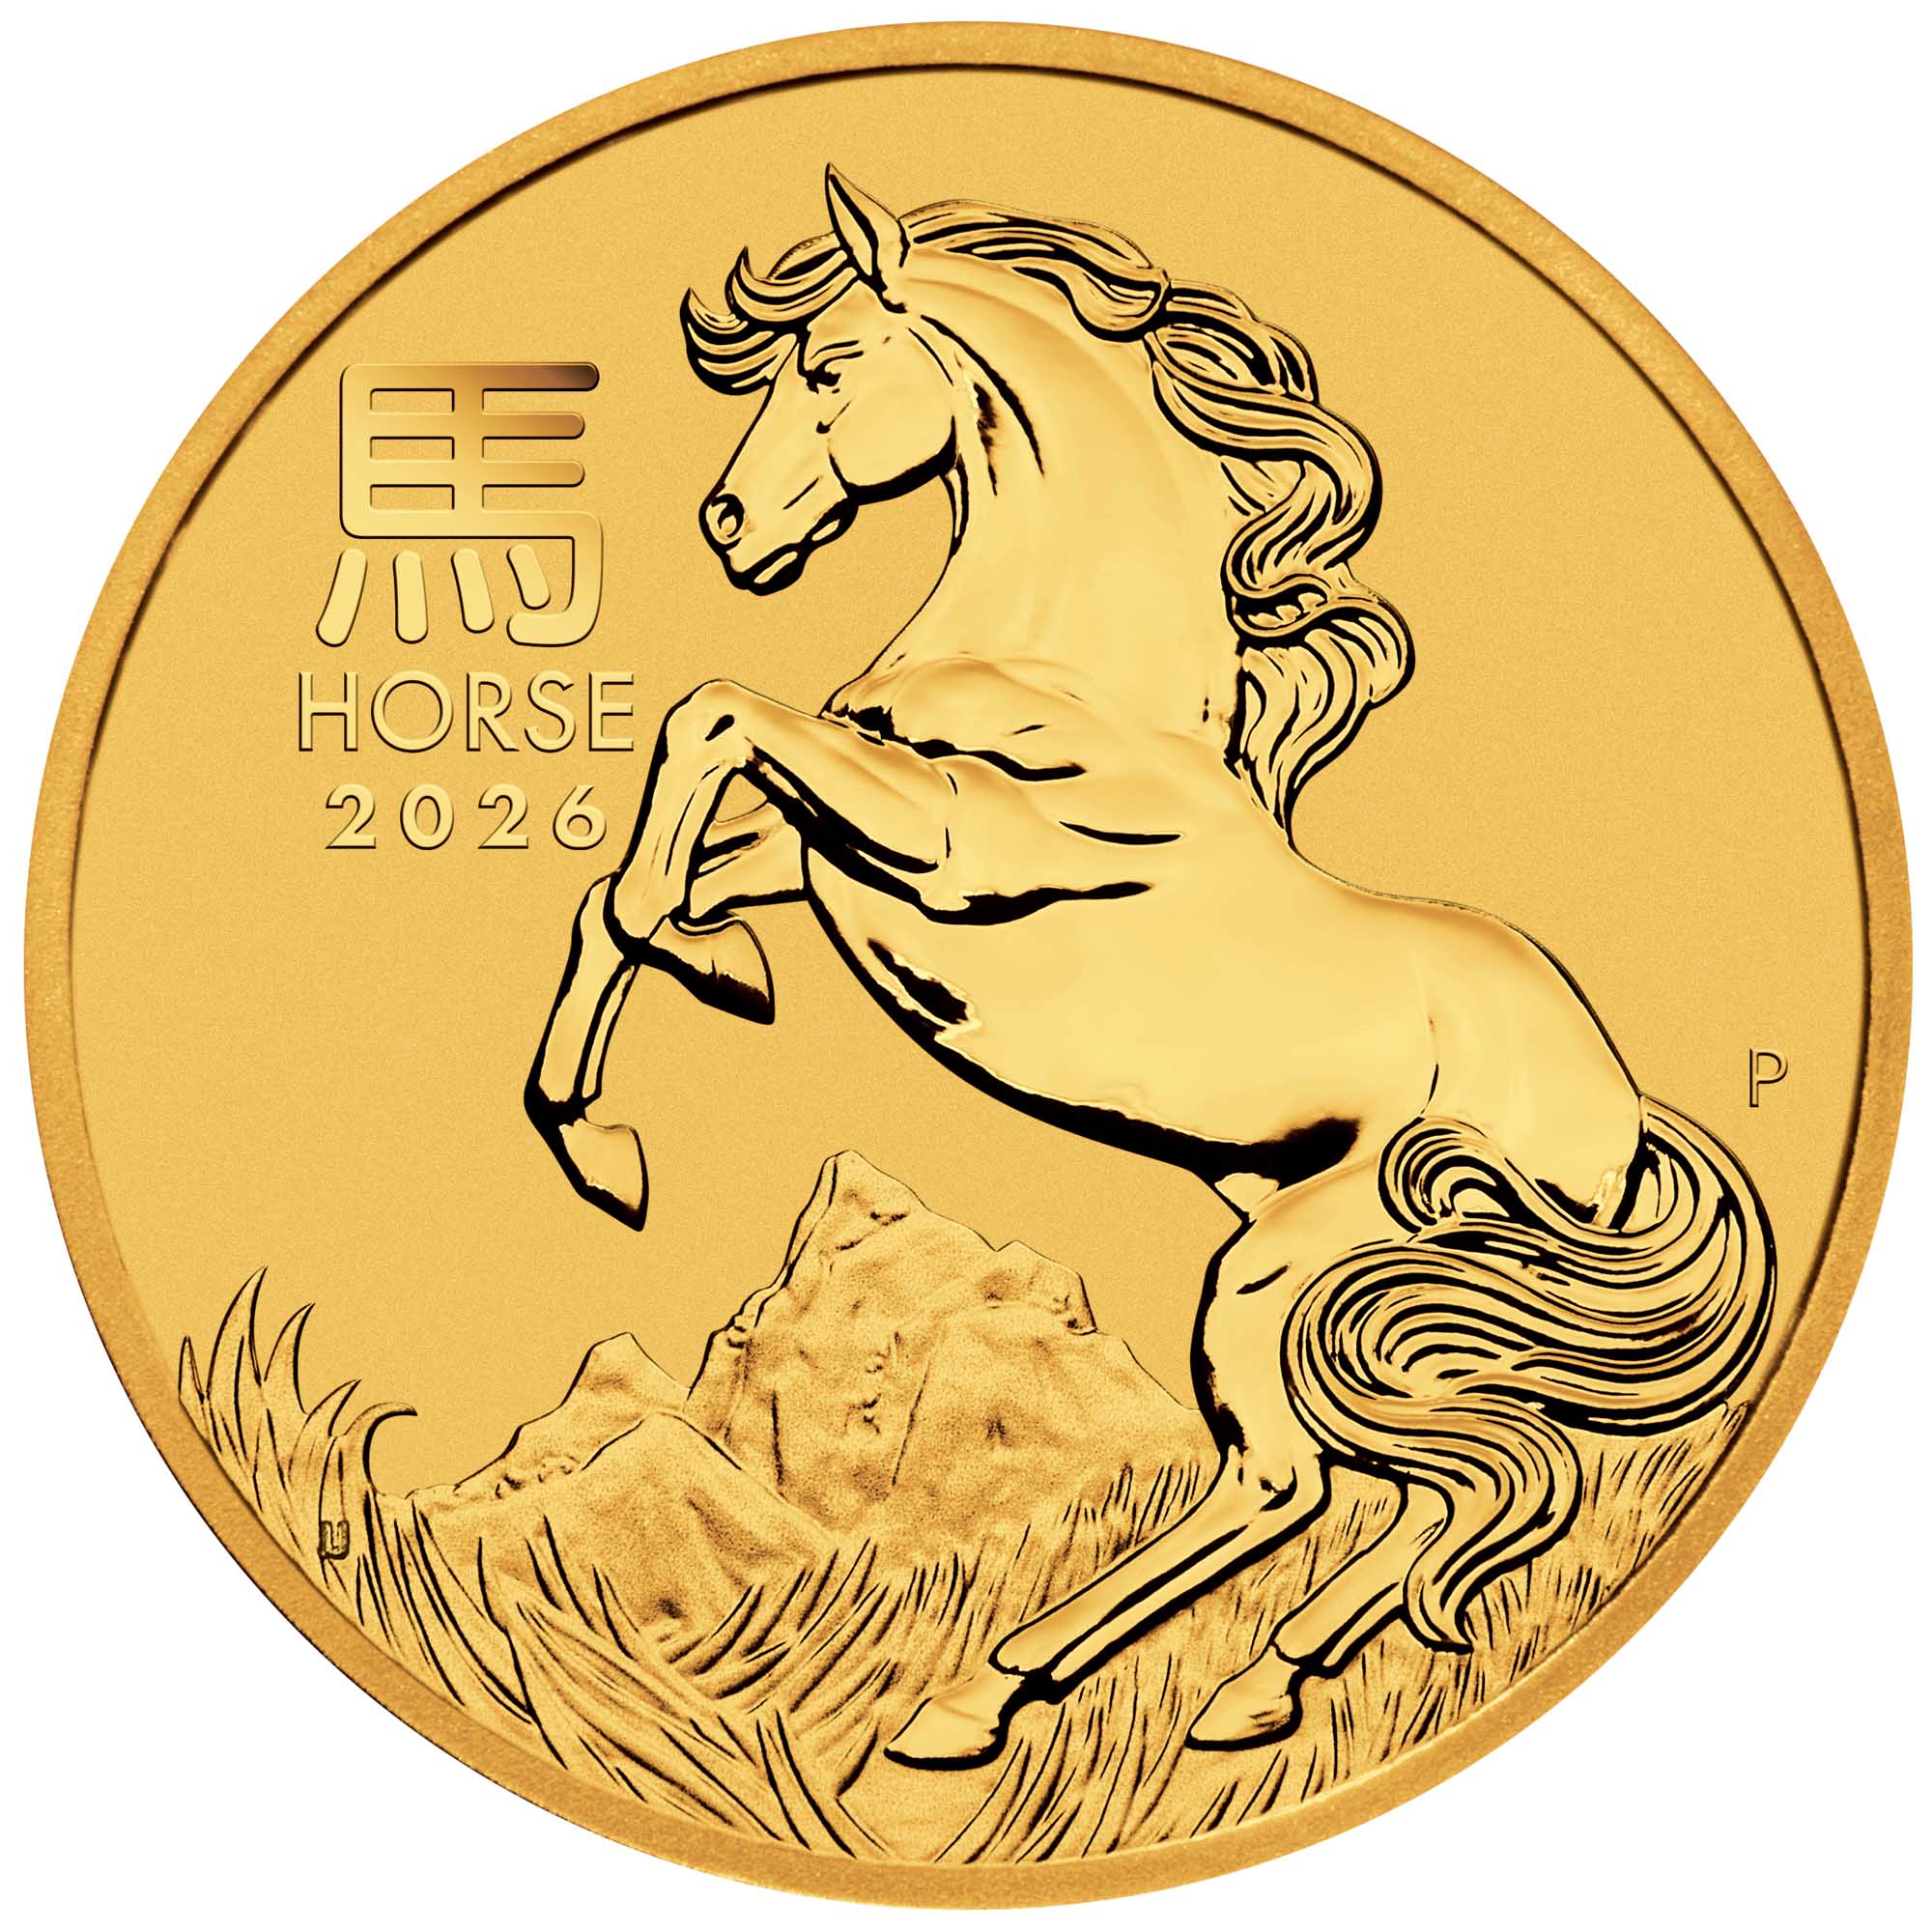
Australian Lunar
Gold, Silver, and Platinum Bullion Coins

|
Platinum: |
2026 Silver Australian Koala
Photos & Mintage Update

Updated Mintages and 2026 Photos for
Australian Gold, Silver, and Platinum Kangaroos
Gold Australian Kangaroos:

Silver Australian Kangaroo:

Platinum Australian Kangaroo:

Mintages
for
2024 &
2025 - Recently Posted
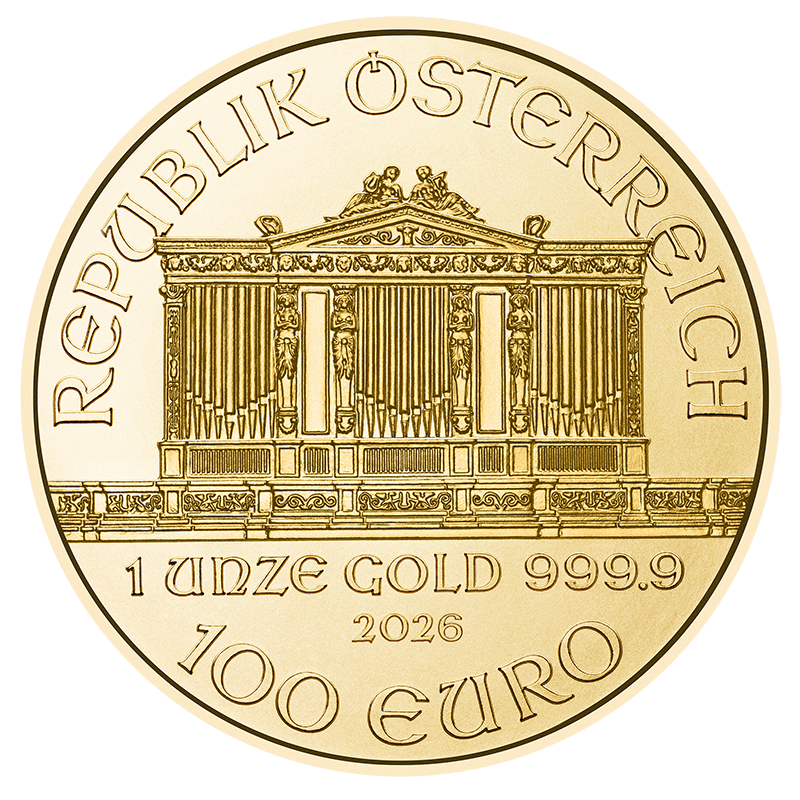
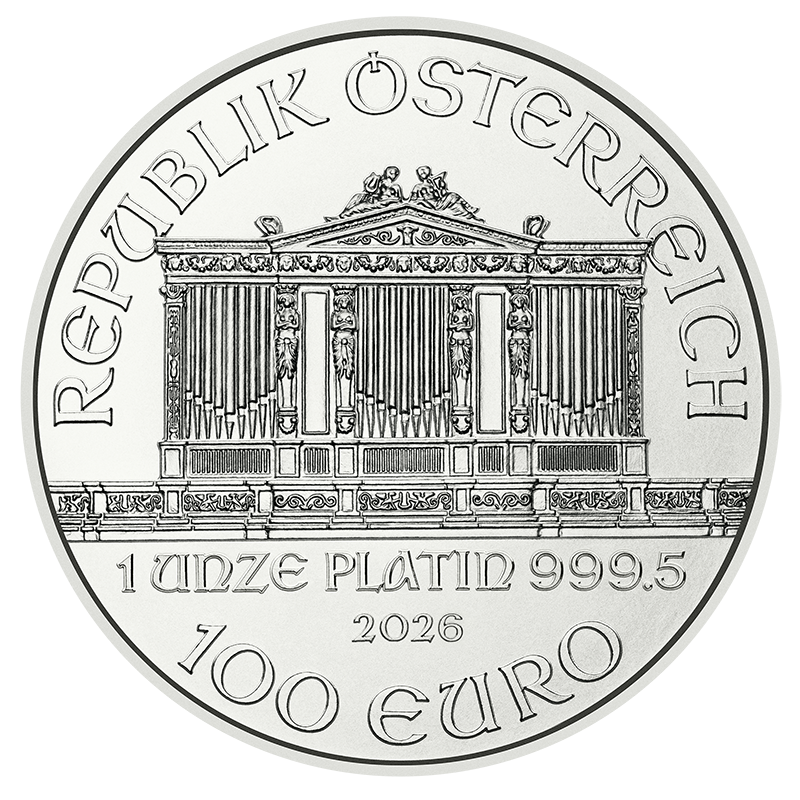
Gold, Silver, & Platinum
Austrian Philharmonic Bullion Coins
|
Silver Austrian Philharmonics 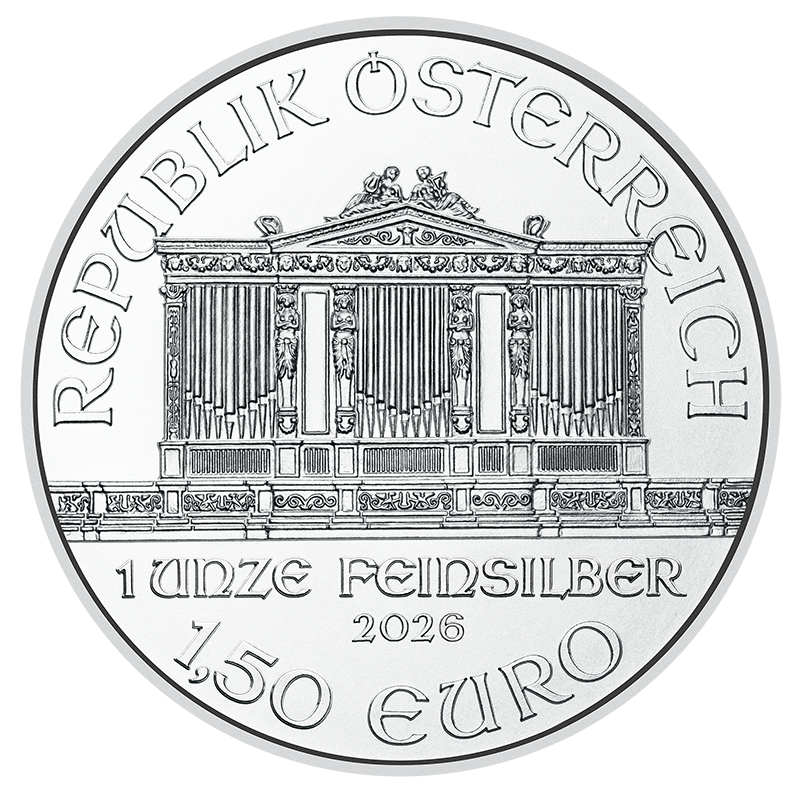 |
Platinum Austrian Philharmonics
2026 Silver Australian Kookaburra
Photo & Mintage Update
Platinum and Palladium Bullion


Help Us Expand our Audience by forwarding our link
www.free-bullion-investment-guide.com.
Thank You!
Last Month's

In No Particular Order
August 2026
|
All Articles were Originally Posted on the Homepage Gold Nanoparticle Cancer ResearchWhat the Moderna and Merck Phase 3 Result Means for Sona - SONA NanoTech Gold Nanoparticles Rewire Inflammatory Signals in Cells Carrying a Cancer-Linked Mutation - BioEngineer.org |
All Articles were Originally Posted on the Homepage