The Dollar's
Dead Cat Bounce
Review and Outlook for the U.S. Dollar, Silver, and Gold
Originally Posted on 1/21/2018 @ 4:38 pm
Last Edited on 01/22/2018 @ 12:17 pm
by Steven Warrenfeltz
Subscribe to this Blog

Hello,
Thank you for visiting the Free-Bullion-Investment-Guide's latest blog post, before we get to the precious metals review and outlook, below are some of the Best Bullion Market-Related News articles that were taken from this guide's home page, over the past few weeks.

2018: The Wrong Lesson on Gold Investing - Bullion Vault
Tocqueville: Review of 2017 and Outlook for 2018 by John Hathaway - Tocqueville
Much Talk About Market Sweet Spot But Nothing Different - Advancing Time
FAKE BULLION (CANADA): All that glitters may be fake gold: 2 charged in alleged scam - CBC
Chap. 11 Bankruptcies Spike 107% from Year Ago - Wolf Street
Why the Search for the New York Federal Reserve’s Next President Is a Big Deal - The American Prospect
The Three Reasons America Faces A Difficult Path Ahead - Advancing Time
DiMartino Booth Warns, Rising Rates Are "An Accident Waiting To Happen" For Stocks - Zero Hedge
China Weighs Slowing or Halting Purchases of U.S. Treasuries - Bloomberg
Federal Reserve thumbs nose at Congress yet again on inflation "While the Fed has the tools to deliver stable prices, it has chosen not to. From 1792 to 1912, U.S. prices rose 3 percent. In stark contrast, since the creation of the Fed in 1913 to 2013, prices rose a whopping 2,380 percent." - The Hill
Best of the Week for Gold NanoParticle Cancer Research
GOLD NANOPARTICLE CANCER RESEARCH: How gold nanoparticles may make killing tumors easier - ars TECHNICA
GOLD NANOPARTICLE CANCER RESEARCH: Israeli researchers harness gold in battle with cancer - The Times of Israel

Two weeks ago, in this guide's last blog post, I mentioned the following about the dollar's future rebound.
In the outlook chart below, you can see that the Dollar has formed a narrow 'Falling Expanding Wedge' pattern.
It is a positive pattern, but because of how narrow it is, it's hard to say how positive it will be for the dollar's future, quite honestly it could end up looking a lot like a 'dead cat bounce,' but its too early to say how the dollar will rebound after its latest fall.
At the time of the last post's writing on January 7th, it was too early to say what was going to happen, but a 'Dead Cat Bounce' is what happened to the U.S. dollar after it briefly confirmed the 'Falling Expanding Wedge.'
The question is: Why did it happen so soon?
Shortly after the last blog post was posted, all looked to be going as expected.
The dollar was rebounding and gold and silver were pulling back in price as the blog post's title stated: A Rebound in the Dollar will cause Silver and Gold to Dip.

The article states that some of China's senior government officials had recommended slowing or halting purchases of U.S. Treasuries.
However, the Bloomberg story doesn't go into any specific detail about why they stated this, nor does the story say which government agency the 'senior government officials' work for in China.
Regardless of who in the Chinese government said that it was contemplating slowing or ending their purchases of U.S. Treasuries, the story was enough to make traders 'freak out' and sell the dollar, making it drop in price, halting its rebound.
In my preparation for this blog post's introduction, I looked up the latest U.S. Treasury Department's report of Major Foreign Holders of Treasury Securities; here.
In the report, you can see that China and Japan are the two largest holders of U.S. Treasuries and they regularly adjust their holdings of U.S. Treasuries in small increments.
In addition, the U.S. Treasury Department report shows that over the last year China has increased their purchases of U.S. Treasury Securities by over $100 billion.
So, when in the future we see China abruptly halt and/or drastically reduce its purchases of U.S. Securities, the fast drop in the dollar will be justified.
Furthermore, this latest movement in the U.S. Dollar should stand as a wake-up call for those who don't own some precious metals because when China sells its U.S. Treasury investments the dollar will crash.
An investing truth is that investments are bought to be later sold.
China isn't collecting U.S. Securities, which means sometime in the future when the time is right for them, China will sell their U.S. Treasuries investments.
But, until that happens, as the charts below suggest some sort of rebound is expected in the U.S. Dollar.
Review & Outlook
|
All the charts on this blog are Daily Charts unless noted otherwise.
US DOLLAR
In Review
Two weeks ago, I wrote the following about the U.S. Dollar and posted the chart below.
In the outlook chart below, you can see that the Dollar has formed a narrow 'Falling Expanding Wedge' pattern.
It is a positive pattern, but because of how narrow it is, it's hard to say how positive it will be for the dollar's future, quite honestly it could end up looking a lot like a 'dead cat bounce,' but its too early to say how the dollar will rebound after its latest fall.
Lastly, you'll notice in the dollar's MACD chart below, I've traced the bar chart with a 'black line,' this is a clear indication that a rebound should happen in the dollar's price soon.
Plus, the RSI, below the MACD, has already started to show that a rebound is due to happen to the dollar.

In Review - continued
In the chart below, you can see that the U.S. dollar briefly bounce up and confirmed the narrow 'Falling Expanding Wedge' pattern.
However, after the Bloomberg article mentioned in the intro was released, the dollar ended up tumbling down like a dead cat.

U.S. Dollar - This Week's Outlook
In the U.S. Dollar's outlook chart below, I adjusted the upper trend-line of the positive 'Falling Expanding Wedge' pattern.
Even though the pattern was confirmed two weeks ago, it's still the most prevalent technical pattern that can be found in the U.S. Dollar's chart, so because of this, some sort of rebound in the dollar is still expected.
In addition, before the Bloomberg article was released more of a rebound in the dollar was expected prior to its 'dead cat bounce', but now it is trading low in oversold territory as its MACD and RSI indicate.
So, at the very least, the U.S. dollar is expected to break above the new upper trend-line of the 'Falling Expanding Wedge' sometime in the next week or two.

Charts provided courtesy of TradingView.com
U.S. Dollar's Price Resistance and Support Levels
U.S. Dollar's Resistance Levels
$92.00
$91.00
U.S. Dollar's Support Levels
$90.00
$89.50
SILVER
In Review
Two weeks ago, I wrote the outlook for silver and posted the chart below.
As silver rose in price, the Rising Expanding Wedge in the chart below slowly started to take shape.
Now that the price of silver has moved up, it looks to be in the process of a pullback, the negative 'Rising Expanding Wedge' pattern isn't the only sign that indicates this will happen.
Another negative sign is in Silver's MACD chart below, its bar chart, like the dollar, has started to move in the opposite direction of its signal lines.
Due to all of the negatives in silver's chart, we should see a pullback in its price and the 'Rising Expanding Wedge' pattern is expected to be confirmed sometime in the next week or two.

In Review - continued
In the chart below, you can see that a pullback did start to take place in silver's price chart, but after the Bloomberg story came out on January 10th, it bounced back up, giving us another example of where Fundamentals always override Technical Analysis.
However, after the hype of the story died down silver came back down in price confirming the negative 'Expanding Rising Wedge' pattern.

Silver - This Week's Outlook
In Silver's outlook chart below, it has formed a positive 'Falling Wedge' pattern.
The pattern has just formed and the MACD and RSI are both giving the indication that the price of silver may continue to consolidate inside of the wedge before it moves out of it.
Plus, the U.S. Congress is currently dealing with the shutdown of the government, so until 60 senators can agree on a funding bill, we may see silver flirt with the upper trend-line sooner rather than later, ultimately time will tell.

Charts provided courtesy of TradingView.com
Silver's Price Resistance &
Support Levels
Silver's Resistance Levels
$18.20
$17.50
Silver's Support Levels
$16.50
$16.00
GOLD
In Review
Below, is what was written in the gold outlook from two weeks ago and its corresponding gold chart is below it.
Like silver, now that the price of gold has moved up with a lot of momentum, some of that momentum is starting to wane.
In addition, like silver, gold has also formed a negative 'Rising Expanding Wedge' pattern that is narrow in shape.
The narrow shape of the 'Rising Expanding Wedge' pattern found in gold and silver's price charts gives the possible indication that the two precious metals may see a limited pull back; time will tell.
The other indication that shows gold is due for a pullback is gold's MACD bar chart, like the dollar and silver's MACD has indicated, gold's bar chart has also started to change directions.
Plus, gold's RSI is also peaking in overbought territory.

In Review - continued
As seen in the chart below, the price of gold, like silver, did start to pullback in price, but after January 10th, it bounced back up in price.
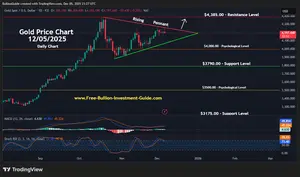
Gold - This Week's Outlook
Unlike silver, gold still has not broken below its negative 'Rising Expanding Wedge' pattern, which may have something to do with what's happening concerning the funding of the U.S. government.
So the price of gold may move up higher as traders move into it because it is a safe haven.
However, sometime in the near future, gold should follow silver and confirm its negative 'Rising Expanding Wedge' technical pattern.

Charts provided courtesy of TradingView.com
Gold's Price Resistance and
Support Levels
Gold's Resistance Levels
$1375.00
$1350.00
Gold's Support Levels
$1310.00
$1295.00
Thank You for Your Time.
Have a Great Week and God Bless,
Steve
'Click Here' see all of the prior Blog posts,
Thank You for Your Time!
|
Investment/Information Disclaimer: All content provided by the Free-Bullion-Investment-Guide.com is for informational purposes only. The comments on this blog should not be construed in any manner whatsoever as recommendations to buy or sell any asset(s) or any other financial instrument at any time. The Free-Bullion-Investment-Guide.com is not liable for any losses, injuries, or damages from the display or use of this information. These terms and conditions of use are subject to change at anytime and without notice. |
The Dollar's Dead Cat Bounce Blog Post
|
Support this Guide & Paypal Thank You for Your Support |
|
|
 | |||||

Recent Articles
-
Newsletter of the Free Bullion Investment Guide - April 2026
Apr 05, 26 04:44 PM
 The April 2026 newsletter of the Free Bullion Investment Guide provides the latest updates, fundamental and technical gold and silver market analysis, the best articles from last month, and a list of…
 -
Newsletter of the Free Bullion Investment Guide - February 2026
Feb 07, 26 02:12 PM
 The February 2026 newsletter of the Free Bullion Investment Guide provides the latest updates, fundamental and technical gold and silver market analysis, the best articles from last month, and a list…
 -
Newsletter of the Free Bullion Investment Guide - January 2026
Jan 07, 26 04:07 PM
 The January 2026 newsletter of the Free Bullion Investment Guide provides the latest updates, fundamental and technical gold and silver market analysis, the best articles from last month, and a list o…
 -
Newsletter of the Free Bullion Investment Guide - December 2025
Dec 07, 25 04:35 PM
 The December 2025 newsletter of the Free Bullion Investment Guide provides the latest updates, fundamental and technical gold and silver market analysis, the best articles from last month, and a list…
 -
Newsletter of the Free Bullion Investment Guide - November 2025
Nov 08, 25 01:58 PM
 The November 2025 newsletter of the Free Bullion Investment Guide provides the latest updates, fundamental and technical gold and silver market analysis, the best articles from last month, and a list…

18W LED Security Light (Dusk to Dawn & Motion Sensor) - $32.99
from:
 LED Lighting

) (as of March 11, 2011)")
This website is best viewed on a desktop computer.
Keep this Guide Online
& Paypal
Thank You for
Your Support
with Feedly
Search the Guide
| search engine by freefind | advanced |

Give a lasting gift of the iconic Silver Maple Leaf bullion coin [More]
Free Shipping on Orders over $100 (CDN/USA)
The Sovereign 2026 Gold Bullion Coin in Card

Britian's
Royal Mint

Daily
Newsletter
Mintages & Photos
|

|
Silver Panda |

Mintages
for
2024
Gold, Silver, & Platinum
Austrian Philharmonic Bullion Coins

|
Silver Philharmonics  |
Platinum Philharmonics

Platinum and Palladium Bullion


Mintages
for
2025
Gold & Silver Mexican Libertad
|
Gold Libertads |


Updated Mintages for
American Gold Buffalo
American Gold Eagle
American Silver Eagle
2024 & 2025
Jerusalem of Gold Bullion
Coin photos
(bottom of page)
 Obverse side")


Help Us Expand our Audience by forwarding our link
www.free-bullion-investment-guide.com.
Thank You!
Last Month's

In No Particular Order
April 2026
|
All Articles were Originally Posted on the Homepage Gold Nanoparticle Cancer ResearchSona Nanotech’s Hyperthermia Platform Boosts Immunotherapy Response in Colorectal Cancer Study - Tipranks Sona Nanotech Showcases Cancer Therapy Results At Prestigious Industry Cancer Conferences - Financial Times Development of gold nanostars coated with mesoporous silica for chemo-photothermal therapy - Published Research Paper - Journal of Drug Delivery Science and Technology (Science Direct) |
All Articles were Originally Posted on the Homepage