Homepage / Archived News or Quarterly News / 4th Quarter 2015
4th Quarter - 2015
Charts, Bullion News & Commentary
Date Posted: 3/08/2016 @ 2:14am
This page provides a comprehensive overview of gold, silver, platinum, and palladium during the quarter.
For each of the precious metals, you'll find charts. Below the charts, you will find Bullion News Headlines from the 4th Quarter of 2015. Every news link was originally posted on this guide's homepage.
When investing in any market, a good way to judge price movement in the future is to learn from the past.
The charts below are provided by the courtesy of
Order of Analysis and Commentary
1) US Dollar Charts - 4th Qtr 2015
3) Silver Charts - 4th Qtr 2015
4) Platinum Charts - 4th Qtr 2015
5) Palladium Charts - 4th Qtr 2015
6) 4th Quarter - 2015 Bullion News & Commentary
US Dollar Charts - 4th qtr. of 2015
In the 4th quarter of 2015, the Federal Reserve (the Fed) and European Central Bank (ECB) dictated the US Dollar's movement.
Just like last quarter,
I used dotted lines in the chart below to indicate when the Fed and ECB
made their announcements to show you how it moved the US Dollar.
When you look at the U.S. dollar chart, you're not only looking at a currency chart, but you are also looking at a tug-of-war game played by the World's Central Banks to weaken their currencies against the U.S. Dollar.
This is also known as "Currency Wars." A currency war is also referred to as "the race to the bottom" for currencies, and that is the current climate we find ourselves in.
Currency wars happen when a country's central bank devalues its currency against other foreign currencies, making its exports more competitive by making them cheaper to foreigners. (continued...)
US Dollar Price Chart - 3rd Quarter - (Oct 1st, 2015 - Dec. 31st, 2015)

US Dollar
The quarterly chart (above) gives the impression that the US Dollar was falling at the beginning of the quarter, but actually, the US Dollar had been moving in a choppy sideways trade since May of 2015.
The first dotted line on this quarterly chart (above) indicates when the Federal Reserve chose not to raise rates at its October meeting. They stated that they did not want to raise rates due to volatility in global markets.
After the Fed didn't raise rates in October, the heat was on them from Wall Street to raise rates in December. (continued...)
US Dollar Price Chart - (Oct. 1st, 2014 - Dec. 31st, 2015)

The US dollar rose after the Fed's October meeting until the ECB announced that they were not going to extend their version of QE (quantitative easing) as long as economists and investors had predicted.
See Article: ECB Day: Markets tumble as Draghi disappoints investors - as it happened
Before the ECB's announcement, the U.S. dollar broke above the $99.00 resistance level, but after the ECB's decision, the U.S. dollar lost a lot of strength, falling back below $99.00.
US Dollar Price Chart - (Oct 1st, 2012 - Dec. 31st, 2015)

After the Fed failed to raise rates in October, the market expected two things to happen in December.
- For the ECB to weaken the Euro more than they did in December
- The Fed to raise Interest Rate in December.
After the U.S. dollar fell in response to the ECB's announcement, it stayed above the $97.00 support level for the rest of the year.
The US Dollar's long-term resistance level currently sits at $101.00 and its support levels currently sit at $93.00 and $90.00.
US Dollar Price Chart - (Jan 1st, 2006 - Dec. 31st, 2015)

Back to Order of Analysis and Commentary
Gold Price Charts - 4th qtr. of 2015
Gold Price
Gold hit new lows in the 4th quarter of 2015; for the last two years, gold's price has been dictated by the Fed's decision, or lack thereof, to raise interest rates.
Since the Federal Reserve ended Quantitative Easing (QE) in October of 2014, Wall Street has been expecting an interest rate hike, but the Fed failed to act.
Dovish talk from the Federal Reserve caused gold to rise in the
first few weeks of the quarter. The price of gold rose so much that it briefly broke above the $1180 price resistance level.
After failing to raise rates in October, the Federal Reserve shifted its stance and began advocating for a rate hike in December.
Gold Price Chart - (Oct 1st, 2015 - Dec. 31st, 2015)

In early December the markets expected the ECB (European Central Bank) to increase Quantitative Easing at a December 3rd meeting. The ECB's announcement disappointed markets which caused a small spike in the price of gold.
Following the Fed's announcement that it was raising rates by 25 basis points (0.25%), gold traded sideways for the rest of the year. In its sideways movement, gold's price briefly touched the $1045 price level twice while staying above it, making it a new support level.
Gold Price Chart - (Oct 1st, 2014 - Dec. 31st, 2015)

Gold's price support levels currently sit at $1045 and $1000, and its price resistance levels sit at $1180 and $1350.
Gold Price Chart - 10year - (Jan 1st, 2006 - Dec. 31st, 2015)

Back to Order of Analysis and Commentary
Silver Price Charts - 4th qtr. of 2015
Silver Price
Silver's price chart for the 4th quarter of 2015 looks almost identical to gold's price chart and the rest of the precious metals.
Like gold, silver's movement was mostly dictated by the actions of central banks.
Silver Price Chart - 3rd Quarter - (Oct 1st, 2015 - Dec. 31st, 2015)

In mid-November the price of silver fell to its support level of $14.00 a troy ounce.
The $14.00 price support level for silver was identified in last quarter's silver charts here: Silver Charts - 3rd Qtr 2015
Silver Price Chart - (Oct 1st, 2015 - Dec 31st, 2015)

Bullion News
Highlighted in the 10-year chart below are Silver's long and short-term support and resistance levels.
Silver Price 10-year Chart - (Jan 1st, 2006 - Dec. 31st, 2015)

Bullion News
Back to Order of Analysis and Commentary
Platinum Price Charts -
4th qtr. of 2015
Platinum Price
Although Platinum and Palladium are more affected by industrial market forces than gold and silver, all the quarterly charts for the precious metals look very similar.
The reason for this has everything to do with the Federal Reserve and ECB (European Central Bank). (continued...)
Platinum Price Chart - 4t Quarter - (Oct. 1st, 2015 - Dec. 31st, 2015)

Bullion News
Although the price of Platinum moved to a high of $1020 and fell briefly below $840, it started and ended the 4th quarter of 2015 in the low $890s.
Platinum's resistance level sits at $1040 a troy ounce. In the 1-year chart (below), we see that the price of Platinum continues to make lower lows and it seems that it has not found a bottom yet.
So, we need to look at a longer-term chart to find a solid support price for the price of platinum. In the 10-year chart below, Platinum's support level sits at its 2008 low of $750 a troy ounce.
Perhaps if the price of Platinum hasn't found its bottom yet, it will find it somewhere between where it is now and $750.00.
Platinum Price Chart - (Oct 1st, 2014 - Dec. 31st, 2015)

Platinum Price Chart - (January 1st, 2006 - December 31st, 2015)

Bullion News
Back to Order of Analysis and Commentary
Free Shipping on Orders $199+ | 5.0 star Customer Reviews
Palladium Price Charts -
4th qtr. of 2015
Palladium Price
The Federal Reserve and the ECB's actions, indicated in the chart below, dictated palladium's price in this quarter.
Palladium is primarily an industrial metal, which is why this movement in palladium is rare, because supply and demand factors usually affect these metals more so than monetary factors. (continued...)
Palladium Price Chart - 4th Quarter - (Oct. 1st, 2015 - Dec. 31st, 2015)

Bullion News
Palladium Price Chart - (October 1st, 2012 - December 31st, 2015)

The charts above are provided by the courtesy of StockCharts.com.
Back to Order of Analysis and Commentary
4th Quarter - 2015
Bullion News & Commentary
The Quarterly News starts with the end of the quarter articles, first.
Please note that not all of the links below work; the links are kept because the headlines provide insight into how the markets were moving at the time.
12/31/2015 - Bullion News
HAPPY NEW YEAR!
VIDEO : CNBC - Santelli Exchange: Disappointing Chicago PMI
CHARTS : McClellan Financial - Dallas Fed’s Signs of Recession
CHARTS : NIA - U.S. Dollar Finishes 2015 as World’s Second Most Overvalued Currency
Sunshine Profits - November U.S. Consumer Spending and Gold
Pension Partners - When to Fear High Yield
Dana Lyon's Tumblr - The Good, The Bad & The Ugly of 2015
INFO~GRAPHICs : Visual Capitalist - Visual Capitalist’s Top 15 Infographics of 2015
12/30/2015 - Bullion News
FXStreet - 'Fed to Rein Back on Expectations of Tightening, Could Constrain USD Strength in 2016'
CATO Institute - The War against Cash, Part II
INFO~GRAPHIC : Value Walk - Keynesian vs. Austrian Economics
Bullion Vault - Fed Goes Crackers as 2016 Begins
TECHNICAL ANALYSIS : Investing - Silver To Lead Gold In 2016
CNBC - The bond market is sending off a troubling signal
TECHNICAL ANALYSIS : Lance Roberts - Technically Speaking: 2016 Outlook
Barrons - WSJ: Are Streaming Deals Drying Up for Mining Companies?
IRD - Why The Government Hates Gold
The BRICS POST - Despite US pressure, Philippines to sign on to new China-led bank
12/29/2015 - Bullion News
Motley Fool - These Billionaires Are Betting Big on Gold in 2016
Paul Nathan - Looking Forward: 2016 A Year Of Resolution
News Fulton County - India: Love for Gold Increases with Buying Spree - India’s gold imports are set to surpass 1,000 tons, in 2015 following a slide in global prices in recent months, according to the All India Gems and Jewellery Trade Federation.
Bullion Vault - The Cost of Mining Gold Globally Can't Bear $1000 Per Ounce...
The Gold Report - 2015: A Year of Investing Perspective
SAXO Group - COT: All commodity sectors but metals sold following US rate hike
TECHNICAL ANALYSIS : Trader Dan's World - Precious Metals COTs Feature Short Covering
Daily Wealth - Junk Bonds are the Canary in the Coal Mine
Bloomberg - U.S. Companies Led the World in 2015 Debt Defaults, S&P Says
Business Insider - The Bond Market Exodus is Accelerating
Zero Hedge - The Big Short's Michael Burry Warns "The Little Guy Will Pay" For The Next Crisis
Profit Confidential - Inflation in U.S. Economy: IS a Stock Market Correction Coming in 2016?
Market Watch - Peter Lynch, 25 years later: it’s not just ‘invest in what you know’
12/28/2015 - Bullion News
Market Watch - Opinion: Fed Gradualism sets Us Up for Another Financial Crisis
Sunshine Profits - The U.S. Junk Bond Market and Gold
Money Metals Exchange - Money Metals Issues 2016 Gold/Silver Forecast
CATO Institute - The War against Cash, Part I
VIDEO : CNBC - Santelli Exchange: Manufacturing the Canary in the Coal Mine?
Alhambra Investment Partners - US Trade Data Shows Unites Foreign And Domestic Production In Recession
INFO~GRAPHIC : Fix the Debt - Washington Digs a Deeper Debt Hole
Financial Sense - Jeff Christian Offers his Thoughts on the Gold Market in 2016
The Deviant Investor - Gold & Silver or Meth & Madness
TECHNICAL ANALYSIS : The Gold and Oil Guy - When Will They Bottom? Oil, SP500, then Exxon Mobil
VIDEO : Visual Capitalist - How the U.S. Dollar Spread Across the World
Daily Mail - Gold plates and coins among valuable haul unearthed by archaeologists at 2,000-year-old royal tombs in China
Daily Wealth - Why I Forgave a Big Debt
12/27/2015 - Bullion News
TECHNICAL ANALYSIS : Decision Point - S&P 500 Q3 Earnings Results: Market Overvalued
TECHNICAL ANALYSIS : Lance Roberts - Technically Speaking: It’s Now Or Never For Santa
Zero Hedge - The Credit Crunch Is Back: Banks Scramble To Collateralize Loans To Record Levels
Forbes - The History of "Gold" Is Really The History Of The Gold/Silver Complex
Inside Futures - Silver is Giving Off Mixed Messages...
Business Standard - World Silver Council to Set Silver Standard in India Soon
FAKE GOLD ALERT : KSLA (Texas) - Texas Man sells Counterfeit Money and Fake Gold Coins on Craigslist
CoinWeek - The Platinum American Eagle: A Study in Nobility
Zero Hedge - Exclusive: "And It's Gone... It's All Gone" - The One Gold Scandal That Goes To The Very Top
CoinWorld - Top 10 Stories of 2015: Another American Eagle silver sales record
AUDIO : Financial Sense - Jim Puplava’s Big Picture: Look-Back 2015
The Daily Reckoning - What is the Impossible Trinity?
CHARTS : The Speculative Investor - Precious Metal Related - Charts of Interest
The New York Times - In Sweden, a Cash-Free Future Nears
The Independent - 13 bad habits you should break in 2016 to be more productive
12/25/2015 - Bullion News
MERRY CHRISTMAS!
12/24/2015 - Bullion News
Zero Hedge - The Fed Has Created A "Monster" And Just Made A "Dangerous Mistake," Stephen Roach Warns
GoldMoney - Why the Fed Will Never Succeed
GoldReporter.de - Russia secures gold from - Google Translation Link
VIDEO : CNBC - Rick Santelli Offers Some Insight on Commodities
TECHNICAL ANALYSIS : TheGoldandOilGuy - Closed Another Winning Trade And New Forecast
CHART : Dana Lyon's Tumblr - 140 Year Old Stock Streak In Jeopardy
CARTOON : Hedgeye - Ebenezer Screwed
Ron Paul Institute - Do We Need the Fed?
CHARTS : ValueWalk - Which President Wins the Jobs Per Debt Picture?
OP-ED : The New York Times - AMERICA’S equity markets are broken
12/23/2015 - Bullion News
TECHNICAL ANALYSIS : Notes from the Rabbit Hole - Precious Metals: A Positive Big Picture View of Risk vs. Reward
VIDEO : CNBC - Santelli Exchange: Fed's forward guidance
Doug Short - NYSE Margin Debt Rose Fractionally in November
Market Watch - Most Americans have less than $1,000 in savings
AUDIO : Jay Taylor - David McAlvany - Can We Depend on Fed Omniscience into 2016?
Bullion Vault - 2016 Team Change at the US Fed
VIDEO : Bloomberg - Wells Fargo Managing Director George Bory and HSBC Precious Metals Analyst James Steel discuss the global jewelry business and precious metals
Scrap Monster - India’s Silver bar imports surged 38% in November
AUDIO : McAlvany Weekly Commentary - Your Questions Answered 2015 – Part 3
Notes from Underground - Notes From Underground: All Quiet On The Western Front … Not
INFO~GRAPHIC : Visual Capitalist - The World’s Strangest Currencies
12/22/2015 - Bullion News
Junk Bond Crisis Starts to Metastasize w/ John Rubino
A Must See for Those Who Want to Understand
How the Junk Bond Market will Effect Us...
Sure Money Investor - Sorry, Barron’s… The High Yield Bond Rout Is Just Beginning
VIDEO : CNBC - Rick Santelli speaks to James Grant, Grant's Interest Rate Observer, about the impact of low interest rates on the economy.
VIDEO : Kitco - Why Jim Rickards Thinks The Fed Will Ease Next Year
Financial Express - India : Gold remains up on global cues, jewellers buying
The Deviant Investor - Silver: May the 100 Year Force Be With You
BullionStar - Australia Gold Export To China In August A Record 13t
CHART : SoberLook - Are US house prices once again growing at an unsustainable rate (>6% YoY)?
The New York Times - Crony Capitalism at Work - Sued Over Old Debt, and Blocked From Suing Back
Smithsonian - From Teeth to Toilets, This Dazziling Exhibit of Gold Artifacts Has the Midas Touch

BGASC - Customer Reviews link
12/21/2015 - Bullion News
PLATA - Is Bloomberg Hiding Something?
Zero Hedge - Step Aside Gold: There Is Something Else The Hedge Fund Community Hates Even More
Sunshine Profits - Is Recent U.S. Economic Data Positive for Gold?
SAXO Group - Gold jumps as hedge funds exit shorts and ETP buyers return
Hedgeye - Repeat After Me: Deflation Is Not Transitory
Non-Dollar Report - Junk Bond Crisis or Opportunity?
Numismaster - Do Grams or Ounces Win?
GOLD & SILVER NANO : Photonics - Plasmons, Confocal Microscopy Produce 3D Images of Neurons
Alhambra Investment Partners - The Confidence Game Is Ending
Hussman Funds - Reversing the Speculative Effect of QE Overnight
Dollar Collapse - The Dominoes Keep Falling: Leftward Lurches And EM Defaults
Money Metals Exchange - Republicans Deliver for Obama, Betray Sound Money Voters
Mirror - Playboy poker ace Nigel Goldman convicted of eBay gold coin con at centre of Spanish fraud probe
12/20/2015 - Bullion News
Business Insider - Here's What You Need to Know about High-Yield Bonds — and Why They're Freaking Everyone Out
VIDEO : Fox Business - Congress - the New Facilitator of QE
AUDIO : Financial Sense - Jim Puplava’s Big Picture: Back to Ground Zero
VIDEO : Yahoo Finance - Jim Rickards: The Fed made a historic mistake
AUDIO : Peak Prosperity - Dan Amerman: Financial Repression & The New Interest Rate Hike
BullionStar - The Chinese Gold Market Essentials Guide
jmydigitalfc - Temples weigh gold monetisation, but 'melting' a dampener
SoberLook - Negative Interest Rates for Canada?
12/18/2015 - Bullion News
The Felder Report - Why You Should Be Worried About The Junk Bond Rout
Sunshine Profits - Do Inflation Indicators Drive the Prices of Gold?
McClellan Financial - Fed Still Behind The Power Curve
INFO~GRAPHIC : Visual Capitalist - All of the World’s Money and Markets in One Visualization
PDF : Gold Standard Inst. - December Journal Issue of the Gold Standard Institute
Wealth Daily - Bank Welfare: The Rate Hike
RIP-OFF ALERT : 3News (Las Vegas) - New con artists find wealth in old coins
Money Metal Exchange - Silly Myths about Gold during Rising Interest Rates
Market Watch - Why Fed interest-rate hike may not melt gold
Sovereign Man - In a free country, Martin Shkreli Should be Free to Act Like a Complete Asshole.
12/17/2015 - Bullion News
The Daily Reckoning - The Market's Gamblers Are Pumping Air
TECHNICAL ANALYSIS : Kimble Charting - Fed make a mistake yesterday? This might answer that question!
VIDEO : CNBC - Cashin: The spill out from the Fed rate hike still to come
Bloomberg - The Accidental Distressed Debt Fund
The New York Sun - Rube Goldberg’s Fed?
VIDEO : ERCI - Interview on Implications of Fed Rate Hike
Wall Street on Parade - What Caused the Stock Market to Rally on a Rate Hike
The Deviant Investor - Gold Thrives, Paper Dies
SRSrocco Report - U.S. Silver Production Plunges
Casey Research - Is the “Easy Money Era” Over?
AUDIO : BullionStar - Interview Koos Jansen By Lars Schall, November 2015
GoldReporter.de - The Russian VTB Bank has agreed with the China Construction Bank co-operation, which should boost the gold trade between the countries.
CoinWeek - Bullion Sales Tax Series, State by State: Pt. 1
12/16/2015 - Bullion News
United States Mint - UNITED STATES MINT AMERICAN EAGLE SILVER BULLION COIN SALES REACH ALL-TIME HIGH
Alhambra Investment Partners - Same Institution, Different Worlds: Fed Set To Declare Full Recovery On Same Day It Declares Recession Through IP
Market Watch - Bernanke says Fed Likely to Add Negative Interest Rates to Recession-Fighting Tool Kit
Market Watch - Bernanke says Fed likely to add negative interest rates to recession-fighting tool kit
INFO~GRAPHIC : Visual Capitalist - The Properties of Money
Reuters - Gold rises more than 1 percent ahead of Fed rate hike decision
CHARTS : NIA - We Are at End of Dollar Rally – Not the Beginning!
TECHNICAL ANALYSIS : Market Anthropology - Chasing Mavericks
AUDIO : McAlvany Weekly Commentary - Rates Rise, Who Dies? Complements of Yellen
CHARTS : Advisor Perspectives - Brace Yourself: Our Latest Look at Student Debt
VIDEO : SAXO Group - Outrageous Predictions 2016: Hansen - Gold Fades in the Glare from Silver
Bloomberg - This Junk Bond Derivative Index Is Saying Something Scary About Defaults
AUDIO : Peak Prosperity - Grant Williams: The End Of The Road
CoinWeek - NGC Signs Coin Designer and Ex US Mint Chief Engraver John M. Mercanti to Exclusive Signature Label Deal
12/15/2015 - Bullion News
CoinNews - Silver Lowest Since July 2009; Silver Eagle Record Tops 46.6M
Alhambra Investment Partners - Inventory Out of Control Everywhere
AUDIO : FSN - John Rubino – Look Out Below: The Junk Bond Market is Imploding
Daily Reckoning - Tomorrow Will Be a Watershed Moment for Financial Markets
The Technical Traders - The Crash of Junk Bonds is Indicating Something that Has Yet to Happen in the Stock Market!
GoldBroker - Gold: “The Canary of the Currency Markets”
CoinWeek - Oh, Canada: Canadian Coins “Natural” Alternative to U.S. Coins, Pt. 2
MoneyBeat (WSJ) - The Government’s Financial Watchdog Just Warned Us That Another Third Avenue-Style Bond Fund Run Is Likely
Juggling Dynamite - Canada’s New Mortgage Rules Offer Teachable Moment
Zero Hedge - Foreigners Sell A Record $55.2 Billion In US Treasuries In October
CHARTS : Advisor Perspectives - The Fed's Financial Accounts: What Is Uncle Sam's Largest Asset?
VIDEO : MoneyBeat (WSJ) - The Risks Facing the Fed
The Deviant Investor - Silver: Until Paper Currencies Stop Losing Value
The Speculative Investor - Unintended Consequences
International Man - Should You Think Like an Indian?
12/14/2015 - Bullion News
Hussman Funds - Deja Vu: The Fed's Real "Policy Error" Was To Encourage Years of Speculation
The Felder Report - Owning Stocks Today Is Risking Dollars To Make Pennies
TECHNICAL ANALYSIS : Northman Trader - Get High Or Else!
VIDEO : Hedgeye - Why Raising Rates (Even One Basis Point) Right Now Is a Really Bad Idea
Sure Money - Who’s Ready for the Fed to Chicken Out Tomorrow?
CHARTS : twitter - Gold Shorts hit Extremes
Money Metals Exchange - Why Are Gold/Silver Prices Falling Despite Demand?
The Cobden Centre - Paper Money versus the Gold Standard
Reuters - India's Gold Jewelers Delay Purchases, Waiting on Fed Move
12/13/2015 - Bullion News
CHARTS : BAWERK - How Peak Debt Constrain the Fed from Moving Rates Higher
TECHNICAL ANALYSIS : Clive Maund - THE GREAT TRAIN WRECK OF 2016...
TECHNICAL ANALYSIS : Kimble Charting - Eiffel Tower pattern, could impact stocks big time, says Joe
CHARTS : GoldSeek - The Effect of a Fed Rate Hike on Precious Metals
AUDIO : Financial Sense - Jim Puplava’s Big Picture: One and Shut Up
TECHNICAL ANALYSIS : Mella - twitter : Gold - When Will You Get Out of Bed?
Mises Institute - Why Gold-Backed Money Doesn’t Bring Booms and Busts
The Speculative Investor - The Ridiculous and Relentless Fuss Over the COMEX Gold Inventory
AUDIO : Money Metals Exchange - Global Supply Deficit Widens Dangerously; David Smith Says Soon “Could Be Too Late to Take Advantage”
Value Walk - The Misunderstanding Of Peter Lynch’s Investment Style
12/11/2015 - Bullion News
"The Fed is Completely Screwed and in a Box it Cannot get Out of." - Peter Boockvar of The Lindsey Group
Bloomberg - Yum's Bonds Cut to Junk at Standard & Poor's on Buyback Plan
Market Watch - Why the junk bond selloff is getting very scary
CHARTS : SRSrocco Report - IMPORTANT SILVER KEY FACTORS: 3 Must See Charts
McClellan Financial - Is this 2012, or 2008?
Sunshine Profits - Does Employment Situation Report Move the Gold Price?
GoldReporter.de - Austria's Central Bank Announces Closing: 1,200 gold bars arrived
CoinWorld - China modifies weights for Panda bullion coins beginning in 2016
12/10/2015 - Bullion News
Daily Reckoning - The Fed’s Painted Itself Into The Most Dangerous Corner In History - Why There Will Soon Be A Riot In The Casino by David Stockman
Alhambra Investment Partners - A Very Disturbed Global ‘Dollar’
PDF : Leuthold Weeden - DJ Transports: Still Sounding Broad Market Warning
CARTOON : Hedgeye - Over The Cliff?
Bloomberg - JPMorgan: The Fed Could Trigger a 'Massive Stop Loss Order' in the S&P 500 if Liftoff Goes Awry
CoinNews - US Mint Sales: Saratoga Quarter and Coin Products Debut
Diamond World - India - IBJA to launch first physical gold exchange by next year
GoldMoney - The Indian government made headlines recently with its attempts to obtain possession of the gold held by its citizens
CHARTS : Advisor Perspectives - What Would It Take for the Prime U.S. Workforce to Fully Recover?
12/09/2015 - Bullion News
U.S. Global Investors - An Illustrated Timeline of the Gold Standard in the U.S.
Gold-Eagle - Rising Interest Rates? Watch for Higher Gold Prices
Sunshine Profits - U.S. Senate Agrees on Highway Bill. Will It Affect Gold?
CHARTS : Zero Hedge - Carnage In Currency-Land - Dollar Dump Sparks Stock Slump
Dana Lyons - Good News: Gold Speculators Haven’t Been This Gloomy In 13 Years
VIDEO : Bloomberg - Credit Worries: The Divergence Between Stocks, High Yield
CoinNews - Gold Edges Up; 2015 Silver Eagles Pad Record Atop 45.7M
CHARTS : Perth Mint Research - China Accelerates Gold Reserves Accumulation
TECHNICAL ANALYSIS : The Street - One Chart Reveals a Possible Positive Future for Gold
AUDIO : McAlvany Weekly Commentary - Marc Faber: Precious Metals represent the Best Value Today
Deviant Investor - Dishonest Money Will Die – I Hope
Mises Institute - Government Debt Is Not Like Private Debt
Zero Hedge - The IMF Just Entered The Cold War, Forgives Ukraine's Debt To Russia
12/08/2015 - Bullion News
CoinWeek - U.S. Mint May Now Change Coin Silver Composition Thanks to New Law
CoinNews - US Mint to Stop Making 90% Silver Coins
TECHNICAL ANALYSIS : Kimble Charting - Double Top in the S&P 500 in play, repeating 2000 & 2007 pattern?
GOLD~NANO : dvids - Camouflaged Nano-Sniper Targets Deadly Toxins
GoldReporter.de - Perth Mint Gets Competition
Reuters - Indian industry group to launch first physical gold exchange
NewsMax - US Mint Silver Bullion Coin Sales Sets New Record
Peak Prosperity - The Screaming Fundamentals For Owning Gold
Numismaster - Avoid Scams, Know Options
CoinWeek - United States Wins 2016 Coin of the Year Award
12/07/2015 - Bullion News
Market Watch - The Fed’s Argument for Higher Interest Rates Doesn’t Add Up
CHARTS : Hambone's Stuff - Federal Deficit Spending, Fed Funds Rates + QE, & Recessions
Hussman Funds - From Risk to Guarded Expectation of Recession
Kitco - For The Second Consecutive Week, Hedge Funds Hold Record Short Bets In Gold – CFTC
Zero Hedge - BIS Warns of ‘Uneasy Calm’ in Markets Before Possible Debt Storm
GOLD~NANO : Imperial College - Scientists are investigating whether microscopic gold beads could make chemotherapy more effective, and reduce side effects for patients.
Notes from Underground - Unemployment Report Spot-On and Meaningless; Draghi Doesn’t Disappoint
VIDEO : CNBC - Santelli Exchange: China's bleeding FX reserves
GoldReporter.de - China increased gold reserves in November on strong
BullionStar - China’s Gold Army
International Man - Weimar Greece - The Effects of a Currency Collapse
COOL : Controlled Environments - GOLD NANO~PARTICLES : Stained Glass Could Change Colors at Flip of a Switch
12/06/2015 - Bullion News
Thoughtful Cynic - The Central Bankers are Doubling Down, either on Stupid or on Malicious
CHART : twitter - Eric Pomboy : Gold - Largest Short Covering Episode on Record
TECHNICAL ANALYSIS : Decision Point - Is Gold Starting New Rally...?
Wall Street on Parade - Junk Bonds Having Worst Year Since 2008 Crisis: Three Red Flags
CHART : NIA - U.S. Corporate Debt Crisis
Zero Hedge - "Hollow Markets"
CARTOON : Hedgeye - The Little Engine that Should'nt
TECHNICAL ANALYSIS : Trader Dan's World - Gold …The Why Behind the Pop .
Global Financial Intelligence - Interview with Jim Rogers - I'll buy gold before the bubble bursts Dollar - Google Translation Link
Reuters - Uneasy calm in markets about upcoming U.S. rate increase, BIS says
The Guardian - Holy Grail of Shipwrecks Caught in Three-Way Court Battle
Free Shipping on Orders $199+ | 4.9 star Customer Reviews
Affiliate Ad
12/04/2015 - Bullion News
Gold-Eagle - Cash & Gold: The Next Best Investments
CHARTS : Juggling Dynamite - Friday Funnies
The Telegraph - Gold has lost its lustre over the past couple of years, but some professional investors are hanging on – here they explain why
CoinWorld - Demand drives silver American Eagle to new heights, new record
Liberty BlitzKrieg - Indian Government Fails to Get Citizens’ Gold, So it Shifts Focus to Temple Stash
Profit Confidential - Interview with SilverGoldBull Managing Partner - Mihali Belandis
GoldReporter.de - Representatives of Islam are planning jointly with the World Gold Council, a new legal framework for the Sharia-compliant use of gold as part of investments and financial transactions
TECHNICAL ANALYSIS : Market Anthropology - Connecting the Dots - 12/4/15
BullionStar - Renminbi Internationalization And China’s Gold Strategy
VIDEO : Kitco - Adding Chinese Yuan To SDR Basket Is A ‘Mistake’ By IMF Says Professor
Wealth Daily - China Hits the Big Time
12/03/2015 - Bullion News
Money and Markets - ECB’s Draghi Fails to Deliver Enough Monetary Drugs; What Next for Markets?
INFO~GRAPHIC : Visual Capitalist - How are Silver and Gold Bullion Premiums Calculated?
CHARTS : McClellan Financial - Positive Signs in Gold's Dreary Charts
BUSTED : Santa Monica Mirror - Santa Monica Company (Merit Gold and Silver/ Merit Financial) Busted For Tricking Customers Into Buying Overpriced Coins
CoinNews - Gold and Silver Bounce from Multi-Year Lows
VIDEO : ABCnews (Australia) - Extended interview with Jim Rickards about China, SDRs and Gold
Market Watch - Bill Gross thinks Fed, ECB are ‘casinos’ printing money
GOLD~NANO : Light 2015 Blog - Radiation and Gold Nanoparticles Working Together for the Image-Guided Radiotherapy
The Deviant Investor - Silver: We NEED it!
AUDIO : McAlvany Weekly Commentary - Your Questions Answered 2015 – Part 2
VIDEO : CNBC - Rick Santelli discusses the latest action in the bond market, and the U.S. dollar after the ECB's announcement on QE and interest rates.
CHART : Perth Mint - November 2015 - Monthly Sales
Numismatic News - Big Changes for Mint bullion coin sales
China - A Woman Accused of Trying to Smuggle Thousands of Gold and Silver Commemorative Coins from Hong Kong into Shanghai
12/02/2015 - Bullion News
Sunshine Profits - Will It Be a Volatile Week for Gold?
VIDEO : Hedgeye - The Astonishing Audacity of Central Planners
Market Watch - Yellen moves Fed to brink of December rate hike - She said Fed officials would review all of the data released up until the meeting starts. But she nonetheless left little room for doubt that she will support an interest-rate increase.
ECRI - Macroeconomic Sightings
GoldCore - Gold Is Real Money That Protects The Wealth of Nations
TECHNICAL ANALYSIS : Clive Maund - Latest Gold COTs MOST BULLISH FOR 14 YEARS, and call for a sizeable tradable rally soon...
The Sovereign Investor - Prepare for Negative Interest Rates With Gold
CANCER RESEARCH : Science Newsline - Liquid Metal 'Nano-terminators' Target Cancer Cells
Bloomberg - Dollar Risks Grow as Hedge Funds Make Greenback Most Favored Bet
CNBC - Companies' mad dash for debt hitting record levels
BullionStar - Silver Maple Leaf Sales Surge 76 % Y/Y
Perth Mint Research - Gold and silver coin sale diverge
Reuters - Indian Government official floats idea of national gold exchange
Mirror - 'Murder' mystery of mother and son found dead just weeks after inheriting a $500,000 gold bar
12/01/2015 - Bullion News
CoinNews - Gold Dips, Saratoga 5 Oz Bullion Coin Sells Out
CoinWorld - Mint sells last of 2015 American Eagle 1-ounce gold bullion coins
VIDEO : CNBC - Santelli Exchange: How raising rates is like melting ice cream
BullionVault - Western Gold & Silver Investment Turns Asian
Kitco - CFTC Data Show Funds Still Adding Short Positions; Analysts See Short-Covering Potential
GOLD~NANO : NanoScale Research Letters - Gold Nanoparticle Conjugates as Potential Therapeutic Agents for the Treatment of Acute Myeloid Leukemia
The Deviant Investor - NEW Fiction: Who Killed Doctor Silver Cartwheel?
CHARTS : NIA - Warning Signs are Showing Up on Some Economic Charts
News Moving Markets - Puerto Rico Avoids Defaulting On Guaranteed Debt, But "Claws Back Revenues Pledged To Specific Bonds"
Bloomberg - Five China Bond Deadlines to Watch
Brookings - China's Gold Star - in this essay by Ben Bernanke he reveals some weaknesses that could arise in the U.S. Dollar, if things don't go as he thinks
Finance Magnates - Chinese Yuan a Few Steps Closer to Global Reserve Currency Status
BullionStar - What Happened To The Shanghai International Gold Exchange?
11/30/2015 - Bullion News
SAXO Group - Read Your History – The Dollar Will Fall After the Hike
munKNEE - Once Gold & Silver Bottom Which Will Be the Better Investment?
CoinNews - Gold, Silver Plunge in November; US Mint Coin Sales Surge
VIDEO : CNBC - Rick Santelli explains what Today's Chicago PMI by the Numbers Mean
The Felder Report - Margin Debt-to-GDP Rises Back To The Level Of Prior Bull Market Peaks
CHARTS : Doug Short - NYSE Margin Debt Rose in October
Notes from Underground - All My Words Come Back To Me
The Speculative Investor - The Fed’s Massive and Unprecedented Shift
CEO.CA - Gold Futures Speculators Capitulate
The Economist - CHINA’S Domestic Bond Market has Never Been Riskier
Bloomberg - U.S. Junk Bonds See Highest Distressed Ratio Since '09, S&P Says
CoinWeek - The Coin Analyst: The American Silver Eagle Turns 30
Money Metals Exchange - Treasury Secretary Makes Sad Admission about Coinage Devaluation
Reuters - IMF gives China's currency prized reserve asset status
The New York Times - With Shipwreck Treasure Easier to Reach, a Duel Is On
11/29/2015 - Bullion News
BAWERK - Unintended Consequences of Lift-Off in a World of Excess Reserves
AUDIO : ValueWalk - How Paul Volcker Beat Inflation Of The 1970s - Includes a Interview with Volcker
CHARTS : Alhambra Investment Partners - Bond Complacency
CHARTS : NIA - Record Low Bond Market Liquidity
CHART : The Short Side of Long - Next Move For US Treasury Rates
VIDEO : Gordon T. Long - FALSE PERCEPTION OF LIVING IN A WORLD OF INFINITE CREDIT - FRA w/Alasdair Macleod
The Buffalo News - Ellicottville Artist’s Image for 'America the Beautiful' Coin chosen by U.S. Mint
AUDIO : Financial Sense - Felix Zulauf and Marc Chandler Weigh in on Currency Wars and the Chinese Devaluation
CNBC - IMF expected to include yuan in SDR currency basket
Perth Mint Research - The Beer Economy
Casey Research - The World’s First Cashless Society Is Here - A Totalitarian’s Dream Come True
Market Watch - Should I convert my traditional IRA to a Roth?
11/27/2015 - Bullion News
The Speculative Investor - Stealing Deflation
Zero Hedge - Gold Plunges Below "Crucial Level", Lowest Since Oct 2009 On $2 Billion Notional Flush
What Investment - Why we have bought 'a little bit of' gold for our portfolios, by veteran investor
CHARTS : Doug Short - Market Cap to GDP: A Fractional Decline in the Buffett Valuation Indicator
Market Watch - A tribute to Richard Russell, who edited Dow Theory Letters for 57 years
GoldReporter - India: record gold imports expected from 1,000 tons
AUDIO : Money Metals Exchange - Special David Morgan Interview on Manipulation, Fiat Money Unraveling, and Silver
11/26/2015 - Bullion News
Zero Hedge - Giving "Thanks" To The Fed - Holiday Dinner Has Never Been More Expensive
CHARTS : McClellan Financial - Debt vs. Equity
MoneyBeat - Why 2015 Might Be Like 1937 for Stocks
TECHNICAL ANALYSIS : COMMERZBANK - PDF : Bullion Market Technical Analysis
Cobden Centre - Money supply versus money demand
GOLD-NANO : Medical Daily - Using Enzymes Attached To Nanoparticles, New Technology Could Diagnose Stroke In 10 Minutes
CHARD - 19 Ways to Identify a Fake Coin
FXEmpire - Gold, Silver & Platinum Fundamental Analysis – November 26
SRSrocco Report - Silver Eagle Sales To Hit Record… U.S. Mint 2015 Production To Halt Dec 11th
Royal Canadian Mint - Royal Canadian Mint Bullion and Numismatic Sales Continue to Drive Business Line Profits in the Third Quarter
AUDIO : McAlvany Weekly Commentary - Your Questions Answered 2015 – Part 1
Reuters - Indian gold demand seen falling to eight-year low in festive quarter
MINING - Platinum, palladium prices break fall
11/25/2015 - Bullion News
Library of Economics & Liberty - The Fed is Above the Law
EconMatters - The Federal Researve - A Break-down of its Current Situation
VIDEO : Hedgeye - McCullough: What QE Actually Did Was Pay The Few And Crush The Many
VIDEO : The Daily Bell - Dysfunction at the Fed
VIDEO : CNBC - Rick Santelli says "Fed Policy Needs an Upgrade"
Zero Hedge - Atlanta Fed Slashes Q4 GDP Forecast
GOLD~NANO : HNGN - Researchers Develop Breakthrough Sensors For Artificial Skin That Can Heal Itself
CoinWorld - 1996 American Eagle silver coin popular, now: Making Moderns
CoinNews - 2015 Proof Platinum Eagles on Dec. 3, No Bullion Edition
PHYS.org - A New Form of Real Gold, Almost as Light as Air
Money Morning - The Best Way to Buy Gold Coins
Action News Now - Scammers trying to sell fake gold in San Francisco Bay Area
11/24/2015 - Bullion News
CoinNews - 2016 American Silver Eagle Release, Last 2015’s for Record
Bullion Vault - The Myth of Gold Standard 'Deflation'
AUDIO : CoinWeek - CoinWeek Podcast : Mexican Libertad Gold and Silver Bullion Coins of 2015
CHARTS : NIA - Fed vs. ECB Shadow Rate
Cobden Centre - Zero Hedge: What Will Happen To Corporate Profits If The Fed Hikes In December
The Deviant Investor - You Can’t Eat Gold or a Debt Sandwich
TECHNICAL ANALYSIS : Clive Maund - PM SECTOR BIG GREEN LIGHT and LOW RISK ENTRY SETUP...
Bullion Star - Switzerland Gold Export China October 29t, +34% m/m
MINING - Most copper producers in Chile barely breaking even
Bloomberg - R.I.P. - Richard Russell, Publisher of Dow Theory Letters, Dies at 91
Real Time Economics (WSJ) - Should Treasury Ditch the Penny? It’s Under Review
The Daily Mail - A very decadent treat! Gold leaf Kit Kats to go on sale, costing $16 PER FINGER (but you have to live in Japan to taste one)
11/23/2015 - Bullion News
Dana Lyons' Tumblr - Global Shipping Rates Run Aground
Sunshine Profits - Baltic Dry Index and Gold
CHARTS : McClellan Financial - Housing Starts - Lumber’s Message
VIDEO : Juggling Dynamite - Commodities Slump as Greenback Ramps
Zero Hedge - Swiss Bank "Goes There", Applies Negative Rates To Retail Deposits
CoinNews - Gold, Silver at Multi-Year Lows; US Mint Coin Sales Robust
CHNGC - Analysis Edition Panda gold and silver commemorative coins 2016 outlook - Google Translation Link
New York Post - Fed’s ‘expedited meeting’ sends shivers through Wall Street
VIDEO : CNBC - Rick Santelli discusses the impact normalization could have on private and public markets.
Hussman Funds - Dispersion Dynamics
Adam H Grimes - Don't be This Guy...Pissing in the Wind
Bloomberg - Hedge Funds Are Back to Bearish on Gold as Price Slump Deepens
GoldReporter - Russia 18 tonnes of gold only treat in October - Google Translation Link
BullionStar - Reuters Spreads False Information Regarding The Chinese Gold Lease Market
The Daily Mail - Cops Search Property for Dead Body, Instead Discover $220,000 Fortune in Silver Bullion Bars and Coins
11/22/2015 - Bullion News
TribuneLive - Sketchy Bullion Retailers Pray on Un-Knowlegable Buyers
PDF : The Gold Standard Institute - Journal - November 2015
The New York Times - Eastern Gold Investing and The Glow of 24-Karat Gold Jewelry
GoldSeek - COT Gold, Silver and US Dollar Index Report - November 20, 2015
Yahoo Finance - Earnings haven't done this since the financial crisis
Zero Hedge - Here Is The Complete Scenario In Which The Fed Hikes Rates, Starts A Recession, And Launches QE4
BAWERK - What a Negative SWAP Spread Really Means
CoinNews - Gold Falls for 5th Week; US Mint Gold Sales Hit 12-Week High
Wealth Daily - Inflation and the Fed
Sunshine Profits - Is the Yield Curve a Driver of Gold Prices?
dna India - At paltry Rs 150 crore, gold bonds scheme fails to glitter
Numismatic News - Quarter, Tenth Bullion Gold Eagles Gone
VIDEO : Yahoo Finance - Gold and silver mines drowning: Silver Wheaton CEO
11/20/2015 - Bullion News
Reuters - Euro (and Gold) Weakens vs Dollar as Comments from ECB's Draghi Weigh
The Sovereign Investor - Prepare for the Bear
CHARTS : The Short Side of Long - Charts Gundlach Thinks Fed Should Worry About
VIDEO : CNBC - Rick Santelli Discusses the Impact of Jobs on the Bond Market with the Lindsey Group Chief Market Analyst Peter Boockvar
ECRI - Flashback to “Simple Math: ½% + ½% = 1%”
The Felder Report - Leveraged Loans Betray The Rally In Stocks
The Daily Bell - Egon von Greyerz on The Great Hiking Debate
VIDEO : RT - Interview with James Rickards on China, SDR and the End of the Business Cycle
Zero Hedge - Subprime Auto Lending Soars As Fed Report Shows Spike In Loans To Underqualified Borrowers
Sovereign Man - It’s happening: more US allies join the anti-dollar alliance
India RealTime - Modi’s Drive to Monetize Gold Doesn’t Shine
The Speculative Investor - Gold’s “commercial” traders are different because gold is different
U.S. Global Investors - 5 World Currencies That Are Closely Tied to Commodities
11/19/2015 - Bullion News
CoinNews - Gold Posts Gains; US Mint Gold Sales Continue Rally
MineWeb - Silver is Finding it Impossible to Decouple From the Pressure Experienced by Gold and Industrial Metals
VIDEO : Fox Business - Recon Capital CIO Kevin Kelly, Hedgeye Risk Management CEO Keith McCullough and FBN’s Dagen McDowell on the economy, markets and Federal Reserve policy.
Bloomberg - Money Managers Now Have a Record Proportion of Their Portfolio Dedicated to Corporate Bonds
Zero Hedge - "This Isn't Going To End Well" - Junk Bonds Under Pressure
Reuters - Modi's gold deposit scheme attracts only 400 grams so far
GOLD~NANO : News Medical - Simple MicroRNA Sensor Holds Promise for Prognosis, Treatment of Pancreatic and Other Cancers
GRAPHIC : ValueWalk - Most Americans Hit “Peak Income” More Than 15 Years Ago
Bloomberg - Chinese Savers Turn to Gold as Rest of the World Exits Holdings
McAlvany Weekly Commentary - Tragedy in Paris & Our Crucial Response
The Deviant Investor - Gold and the Reverse Goldfinger Effect
TECHNICAL ANALYSIS : Market Anthropology - Connecting the Dots
VIDEO : Sprott Global - Tekoa Da Silva Interviews GoldMoney's James Turk
Coin Update - Behind the Scenes at the U.S. Mint: “You Are There!”
11/18/2015 - Bullion News
CoinWorld - 2015 American Eagle Tenth-Ounce Gold Bullion Coin Sells Out
CoinNews - Gold Little Changed; US Mint Gold Sales Soaring
CHART : ECRI - Multiple Jobholders Boost “Full-time” Employment
VIDEO : Hedgeye - McCullough: Fed Needs An Economic Reality Check
Zero Hedge - FOMC Minutes Show Fed Is All-In For December Rate Hike (But Depends On Data)
CHART : Business Insider - GUNDLACH: This Could Be 'The Beginning of Something Big'
GOLD~NANO : AZO NANO - Gold Nanoprisms Based Sensor Can Detect Early-Stage Pancreatic Cancer
GoldReporter.de - Largest Gold Fund: These Big Banks Bought Vigorously
VIDEO : CNBC - Rick Santelli & James Grant : Rate Hike & Your Savings
The Deviant Investor - A Half-Century of Gold, War, and Costs
The Daily Reckoning - The Fed Will Not Kill Gold
TECHNICAL ANALYSIS : CEO.CA - A Seasonal Trade In Silver
The Fiscal Times - Americans Now Owe $1 Trillion in Car Loans
Vanguard - Gold Coins and Golden Hoofs Found in 2,000-yr-old Tomb
BBC - Hoard of precious clippings shaved from silver coins by 16th century crook found in Gloucestershire
11/17/2015 - Bullion News
VIDEO : CNBC - David Stockman tells CNBC what He thinks about the Markets
The New York Sun - The Yellen Letter Her letter is whiny, inaccurate, and threatening all at once, evincing an “it’s my ball and you can’t play with it” attitude.
CoinNews - Gold, Silver Hit Lows After Inflation Data
NIA - Stocks vs. Gold During Fed Rate Hike Cycles
ValueWalk - The Poisonous Cocktail Of Main Street Woes And Federal Reserve Liftoff
The Felder Report - History Rhymes: A Look At A Pair Of Popular Stock Market Analogs
11/16/2015 - Bullion News
The Daily Reckoning - The Shadow Rate Casts Gloom
VIDEO : CNBC - Jim Steel, Chief Commodities Analyst, HSBC : Gives His Analysis on Gold
FAKE BULLION ALERT : CoinWeek - Australia 2012 Year of the Dragon Silver Dollar
CoinNews - US Mint Limits Weekly Silver Eagle Sales to 900,000
Juggling Dynamite - Executives using buybacks to ‘exit stage left’
Bloomberg - Debt Market Distortions Go Global as Nothing Makes Sense Anymore
Zero Hedge - The Last Time Bond Bears Were This Short, Treasury Yields Collapsed
CoinNews - Gold, Silver Bounce from Lows; US Mint Bullion Sales Climb
BullionStar - SGE Withdrawals Break Yearly Record. World Gold Council Continues To Hide Insatiable Chinese Gold Demand.
Money Metals Exchange - Undeniable Truths about Precious Metals (Don't Forget These...)
GoldReporter.de - Discussed gold standard on Fed Meeting
The Guardian - How and Why we're flushing £13m of Gold Down the Plughole Each Year
Visual Capitalist - The Psychology of Prices
11/15/2015 - Bullion News
BAWERK - How the Fed gave away its independence – Interest Rate Sensitivity at ZLB
Hussman Funds - The Bubble Right In Front Of Our Faces
CoinWorld - Saratoga 5-ounce silver quarter dollar bullion coins next up
ECRI - 2008 Flashback: The Risk of Redefining Recession
Sunshine Profits - Do Credit Spreads Move the Gold Price?
Zero Hedge - What Hath The Fed Wrought?
TECHNICAL ANALYSIS : SOLARCYCLES - Approaching Resolution
The Non-Dollar Report - U.S. Dollar - Undeniably Strong… but for How Long?
The Telegraph - Gold Remains the Best Insurance for a Crisis
Reuters - China's yuan takes leap toward joining IMF currency basket
Bloomberg - What the Rise of the Yuan Means for the Global Economy
The New York Post - Raising minimum wage would cost a million people their jobs
11/13/2015 - Bullion News
CoinNews - 2015 $10 American Eagle Gold Bullion Coin Sells Out
CHARTS : Advisor Perspectives - ECRI Weekly Leading Index: "The Case of the Wage Inflation Deception"
VIDEO : CNBC - Rick Santelli speaks to Chip Dickson, Discern Investment Analytics, about global growth, central bank policy around the globe and consumer spending
VIDEO : CNBC - Cashin: Fed may have missed window mightily
CARTOON : Hedgeye - (Blind) Eye of the Storm
GOLD~NANO : Bentham Science - VIDEO : Nuclear Targeting of Gold Nanoparticles for Improved Therapeutics
Perth Mint Blog - WGC Reports Surge In Gold Demand During Q3 2015
VIDEO : CoinWorld - Here's what 1.7 million ounces of gold looks like
VIDEO : Gordon T Long - WHAT TO EXPECT FROM THE FED w/ Charles Hugh Smith & Rick Ackerman
TECHNICAL ANALYSIS : Market Anthropology - Connecting the Dots
VIDEO : CNBC - Rick Santelli : The Fed's Quandary
The Economist - The world is entering a third stage of a rolling debt crisis
11/12/2015 - Bullion News
Silver Coins Today - 2015 American Silver Eagle Bullion Sales Continue at Record Pace
Business Insider - Gold coin sales haven't been this high since the financial crisis
Zero Hedge - The Amazing Chart Showing What All The Debt Issued This Century Has Been Used For
Daily Reckoning - Four Market Signals That the Crack-Up’s Begun
GoldSilverWorlds - Jim Rickards: What Will The Fed Decide in 2016?
The Deviant Investor - Another Day Older and Deeper in Debt
VIDEO : CNBC - THIS indicator is signaling a recession
GoldReporter.de - Jim Rogers: The next crash will be worse than ever
The Telegraph - Gold price fall and market panic sparks bullion 'buying spree' in China
BullionStar - Record UK Gold Export To China In September, Chinese Gold Import Reaches 156t
CEO.CA - Second in a series: Currency printing and why a flash default is the way to go
Numismaster - Deceptive fake coin, holder identified
Daily Mail - Anyone need change? TWO MILLION copper coins weighing a whopping 10 tonnes found inside 2,000-year-old tomb
11/11/2015 - Bullion News
CoinNews - Gold Ends at 5-3/4-Year Low, Silver Marks 11-Week Low
AUDIO : McAlvany Weekly Commentary - Fed’s Next Interest Rate Move, Deadly Decoy?
Market Watch - Sheep-like thinking over a Fed move could send investors over a cliff
South China Morning Post - SDR Inclusion Far from Enough to Increase Yuan’s Allure to Investors
CoinWorld - How does the bullion market work?: Precious metals basics
GOLD~NANO : LUND University - The Effect of Protein Corona on Gold Nanoparticles Aggregation
BullionStar - Largest Ever Chinese Gold Deposit Has Been Found 2,000m Undersea In Shandong
CoinWorld - Positive case being made for gold in current precious metals market
The Sovereign Investor - Has Gold Hit a Bottom?
The Corner - Now comes the really hard part for Greece
The Telegraph - End QE now or risk a new financial crisis, warn Germany's 'Wise Men"
WolfStreet - We’re in the Early Stages of Largest Debt Default in US History
11/10/2015 - Bullion News
Bloomberg - Goldman Sachs Says Corporate America Has Quietly Re-levered more than Double Pre-Crisis Levels.
VIDEO : CNBC - Rick Santelli shares his view of Federal Reserve monetary policy based on current economic data
Wealth Daily - Chinese Exports and Gold Reserves
twitter - Magic Words for Metal Longs
(Hint: Do the Opposite of what this Man says...)
CoinWorld - Mint sells most of American Eagle silver coin allocation Nov. 9
CNSnews - $944,143,000,000: Social Security Administration Spending Hit Record in FY2015; $6,345 For Every American With a Job
GOLD~NANO : AL.com - Big demand for UAH undergraduate paper about disease detection device
Bloomberg - Goldman Contrarian Joins Chorus Warning on Bond-Market Liquidity
Casey Research - Why Higher Rates Could Kill the Bull Market in Stocks
The Deviant Investor - Silly Season and Silly Fiscal Policy
Monetary Metals - Gold Price Drop of 6 Nov: Drilling Down
The Speculative Investor - Martin Armstrong botches a critique of Austrian Economics
The Guardian - The Long Read : Inside the Bank of England
11/09/2015 - Bullion News
Hussman Funds - Psychological Whiplash
Wall Street Examiner - Debt Star! US Debt Is Over 3 Times What You THINK It is!
CoinNews - US Mint Limits Weekly Silver Eagle Sales to 1.1 Million
Bloomberg - China to Allow Direct Conversion Between Yuan and Swiss Franc
VIDEO : Bloomberg - James Grant "The Federal Reserve is a Relic"
BullionStar - COMEX Deliveries vs SGE Withdrawals
Perth Mint Research - Indian Gold Monetisation Schemes
Money Metals Exchange - Key Indicator of Future Commodity Demand Turns Up
Sovereign Man - Astonishing report from the Fed says US banks are not “sound”
CHARTS : Visual Capitalist - Japan Officially Gets Leapfrogged by the Four Asian Tigers
11/08/2015 - Bullion News
Dr. Ed's Blog - The Grand Delusion
GoldSeek - COT Gold, Silver and US Dollar Index Report
TECHNICAL ANALYSIS : Investing - Bull Box In The Gold Market
TECHNICAL ANALYSIS : CEO.CA - Gold Breaches Support After Positive U.S. Monthly Employment Report
The Telegraph - UN Wants New Global Currency to Replace Dollar
BullionStar - The LBMA Conference And The ‘Confusion’ About Gold Round Tripping
Zero Hedge - China Buys Another 14 Tons Of Gold In October As FX Reserves Unexpectedly Rebound
Reuters - Chinese trade disappoints, clouding economic outlook
Business Standard - India : All that glitters is paper gold

Affiliate Ad
11/06/2015 - Bullion News
Sunshine Profits - Does Bond Market Drive the Gold Price?
Reuters - Gold's medium-term outlook brightens on China, India
SafeHaven - Strong Payroll Bounce +271,000; December Rate Hike Likely
CARTOON : Hedgeye - Ready For Liftoff?
AUDIO : Money Metals Exchange - Exclusive Interview with Frank Holmes on Forces Moving Gold Market, Global Economy
VIDEO : Bloomberg - Are Markets Leading the Federal Reserve?
Casey Research - The Fed Says Negative Interest Rates are “On the Table”
Perth Mint Blog - LBMA Grants The Perth Mint A Full Member
World Mint Blog - UK Launches 2016 Range of Britannia Bullion Coins
Wealth Daily - National Debt Disgrace
Market Watch - Fed's Brainard: 'Greater caution than normal' needed on interest-rate policy
CNBC - Transcript: Federal Reserve Bank of Chicago President Charles Evans Speaks with CNBC
Reuters - Treasury's Lew, China's Wang discuss yuan joining IMF currency basket
11/05/2015 - Bullion News
Reuters - Yellen and the Fed are Playing Fire a.k.a Confidence
MoneyBeat (WSJ) - Market Falls In Line With Yellen, But Now Fed Credibility at Stake
Kitco - Gold Market To Eye U.S. Nonfarm Payrolls For Next Clue On Fed Monetary Policy
JM Bullion - JM Bullion tops Dallas 100 ranking of fastest-growing companies
Market Watch - The Real Impact of a Decade of Low Interest Rates
CARTOON : Hedgeye - Rate Shock Ahead?
TECHNICAL CHARTS : Northman Trader - Charts Indicate a Change is Coming...
CHART : Perth Mint Blog - Perth Mint - October 2015 - Gold & Silver Sales Chart
The Deviant Investor - The Discipline of Silver
TECHNICAL ANALYSIS : Market Anthropology - Yen/Nikkei : Gold/Yen : Silver to Gold Ratio
Business Insider - This is how a central bank could kill off cash and bring in negative interest rates on your savings
Reuters - Modi calls on Indians to mobilize idle gold, cut imports
CHART : Inside Futures - GOLD COMPARED TO EUROFX
Zero Hedge - There Are Now 293 Ounces Of Paper Gold For Every Ounce Of Physical As Comex Registered Gold Hits New Low
INFO~GRAPHIC : Visual Capitalist - The World’s Most Famous Diamonds
11/04/2015 - Bullion News
CNBC - Santelli Exchange: Fed Supervision
Notes from Underground - ECB = Every Corrupt Banker
Zero Hedge - Yellen Says Negative Rates On The Table "If Outlook Worsened"
Money Metals Exchange - Rock, Paper, Scissors: Why Gold and Silver Will Always Prevail
CoinWeek - The Coin Analyst: 2016 Panda Coins and the Switch to Metric Weights
AUDIO : McAlvany Weekly Commentary - On this Week: Druckenmiller and his “modest” $300 million dollar gold purchase, Italian bonds pay negative interest rates & Paper gold ratio to real gold hits 231:1 in October!
First Post - India's New Gold Scheme has A Lot of Obstacles to Overcome...
Casey Research - Why the U.S. Debt Ceiling is a Farce
CARTOON : Hedgeye - Rate Hike Off the Table?
AUDIO : Library of Economics & Liberty - Michael Matheson Miller on Poverty, Inc
11/03/2015 - Bullion News
Perth Mint Blog - 1oz Australian Kookaburra Bullion Coin Available From Today
Newswire - United States Mint to Launch America the Beautiful Quarters® Program Coin Honoring Saratoga National Historical Park Nov. 17
Notes from Underground - The King of Hearts Syndrome Dominates the Markets
BARRON's - How Low Can Gold Go?
Bullion Star - Why Austria Is Repatriating Gold From London
The Deviant Investor - The Circle of Gold
11/02/2015 - Bullion News
The Felder Report - Bond Market To Stocks: “Last Call!”
Hussman Funds - Last Gasp Saloon
Bloomberg - These Charts Suggest the Market May Have Had Enough of Share Buybacks
The Daily Reckoning - Ignorance is Far less Dangerous than False Knowledge
CoinNews - American Silver Eagle Sales Limit Rises for Second Week
TECHNICAL ANALYSIS : King One Eye - Will Gold Retest Its Uptrend? Odds Favor It
AUDIO : FSN - John Rubino – Can the Us Raise Rates When Everyone Else is Cutting Them?
Bloomberg - Here's How Much QE Helped Wall Street Steamroll Main Street
CEO.CA - The big print: 18 trillion reasons to fire up the presses
The Gold Report - Four Reasons Investment Strategist Joe McAlinden Likes Hard Assets, Especially Gold
SilverSeek - Is Martin Armstrong Both Right and Wrong About Gold & Silver Manipulation?
11/01/2015 - Bullion News
StarTribune - Interest rates: There's a Looming Problem with the Fed's Way of Thinking - Good Read
FXEMPIRE - Precious Metals Fundamental Analysis – November 2 – November 6, 2015 Forecast – Gold, Silver & Platinum
CoinNews - Gold, Silver Soar in October; US Mint Bullion Sales Weaken
What Investment - Why I am buying gold for portfolio right now, by manager of £1 billion of assets
GOLD~NANO : Dovepress - Tumor-Targeted and pH-Controlled Delivery of Doxorubicin Using Gold Nanorods for Lung Cancer Therapy
GoldSeek - COT Gold, Silver and US Dollar Index Report - October 30, 2015
CHART : McClellan Financial - COT Data For Gold At Topworthy Level
TECHNICAL ANALYSIS : Trader Dan's World - Silver COTs Downright Scary…Trick or Treat?
GoldMoney - Fiat Money Quantity Update
Bloomberg - Bonds Send Same Ominous Signs No Matter Where in World You Look
TECHNICAL ANALYSIS : SOLARCYCLES - Selective Rally
Myhighplains - Firms Vying to Help Texas Build Gold Depository
10/30/2015 - Bullion News
Bullion Vault - The Fed Really, Really Means It This Time!
TECHNICAL ANALYSIS : Kitco - A Longer-Term Examination of Gold from a Fibonacci Perspective
NewsMax - United States Mint Silver Bullion Sales Headed for New Record
CHARTS : BAWERK - The Yield Curve and GDP – a Causal Relationship?
CHART : Hedgeye - Disappointing U.S. Data Eerily Reminiscent Of 2006-2007
AUDIO : Money Metals Exchange - Congress Gives Obama Unlimited Debt, Author Tom Woods Discusses War on Savers and Gold Standard
GOLD~NANO : Science Alert - New electronic sensor can detect ovarian cancer in your breath
The New York Sun - Santelli Wins the Debate
Market Watch - Opinion: A bottoming of gold prices might be closer than you think
CoinWorld - U.S. Mint's American Eagle bullion coins: Precious metals basics
Times of India - Gold bonds on sale from Nov 26
BullionStar - Russia’s VTB Bank Joins As SGE Member. Chinese Direct Gold Imports Increase
Nikkei Asian Review - Chinese demand propping up soft gold prices
The Union - Plea agreement accepted in counterfeit gold case
10/29/2015 - Bullion News
Investment Week - US Rate Hike in Doubt as GDP Growth Slows to 1.5%
CHARTS : dshort - Visualizing GDP: A Closer Look Inside the Q3 Advance Estimate
CHARTS : dshort - Market Cap to GDP: The Buffett Valuation Indicator Eases a Bit
Dana Lyons' Tumblr - No Silver Lining As Smart Money Heavily Short This Precious Metal
Silver Phoenix 500 - Higher Silver Prices: The Fundamental Case
Perth Mint Blog - GFMS Gold Survey Q3 2015
The National - India gold monetisation move to be launched ahead of Diwali
The Deviant Investor - Gold Analogue: Then and Now
TECHNICAL ANALYSIS : Yahoo Finance - USD Struggles to Hold Fed-Driven Rally as GDP, Home Sales Disappoint
VIDEO : Kitco - Austrian Mint Tour: Inside Look At The Vienna Philharmonic Coin
CEO.CA - Interview: Jim Rogers on gold, Wall Street and the “backwater” of finance
Mish Shedlock - Courage to Act; Reflections on Fed Hubris; What if Whatever it Takes is Not Enough? Fed Troika?
AUDIO : McAlvany Weekly Commentary - Zimbabwe Hyperinflation: “How We Survived”
Market Watch - Man reportedly saves half a million pennies over 40 years
10/28/2015 - Bullion News
VIDEO : Hedgeye - Replay : Fed Day Live with Keith McCullough
CNBC - Comparing Fed Statements - What Changed in the New Fed Statement
MINING - Gold price drops $30 after Fed
Wall Street Examiner - Why Are We Speculating About When The Fed Will Raise Rates When The Real Issue Is How – Revisited
CHARTS : The New York Times - The Fed's Economic Projections
Midas Letter - Fed Holds Steady – No Date Given for Rate Rise
Sunshine Profits - Is U.S. Heading for Recession?
GOLD~NANO : NATURE - RESEARCH : Finding Tumors with Florescent Gold Nano-Particles
VIDEO : Modern Wall Street - Jim Rickards: Recession will force Fed to ease in 2016
SNL Conference Chatter - Gold Demand Robust and Rising
Investing - Russia And China Increase Gold Holdings
VIDEO : BullionStar - Torgny Persson, CEO, on Gold Trends & The New Gold Rush
MINING - These Countries are Winning at Gold Mining
Financial Review - Venezuela selling gold to cover bond payments
PHYS.org - Cleaning up the Precious Metals Industry
10/27/2015 - Bullion News
Bullion Vault - China Gold Demand 'Not So Bleak', US Fed 'More Important'
Bonner & Partners - The Latest (and Dumbest) Central Bank Fraud
AUDIO : The Korelin Economics Report - Rick Ackerman commenting on today’s stock markets: “Even the rubes can smell the hoax!”
The New York Times - Ex-Goldman Banker and Fed Employee Will Plead Guilty in Document Leak
Reuters - Gold demand rises in Q3 on surge in coin, bar buying - GFMS
Acting Man - Can the Fed Print Money?
TIME - Ireland Is Doing Away With the Penny
Sputnik News - Iran Planning to the Abolish Cash, Introduce Electronic Payment Systems
The Deviant Investor - Green Light Silver – Part 2
GoldReporter.de - Saving behavior of the Germans: 15 percent rely on precious metals
The Telegraph - Buying motorbikes, art, gold and fossils - loopholes used by the wealthy to avoid tax
Western Daily Press - US 1794 'penny' coin found in plastic bag in Dorset sells for 1.7 MILLION times more than a cent
VIDEO : Daily Reckoning - Ron Paul : The Benefits of Buying Gold
10/26/2015 - Bullion News
Money Metals Exchange - Big News This Week on the Fed, Debt Ceiling, and Physical Silver Premiums
CoinWorld - Counterfeit Detection Advances
CoinWeek - Chinese Panda Coins- A Weighty Decision
CHARTS : Acting Man - Where Is All The Gold Going?
SAXO Group - COT: Bulls bet on precious metals, energy slumps
Kitco - Large Speculators Raise Gold Net Long To Highest Level Since February—CFTC Data
twitter - James Rickard's Thoughts on the Capital Markets
GOLD~NANO : Nature - Three dimensional imaging of gold-nanoparticles tagged samples using phase retrieval with two focus planes
VIDEO : GoldBroker - Bill Holter: The Fed, The Dollar and Gold
MineWeb - Gold – a better investment than cash?
McKinsey & Company - Are share buybacks jeopardizing future growth?
Mauldin Economics - Someone Is Spending Your Pension Money
NewsMax - Marc Faber: China Has Credit Bubble of 'Epic Proportions'
RED MEAT : News Medical - Scientific Evidence Does Not Support Causal Relationship Between Red Meat and Cancer Risk
10/25/2015 - Bullion News
Market Watch - Fed set to remain on pause as GDP data expected to show slowdown
GoldSeek - COT Gold, Silver and US Dollar Index Report
Monetary Metals - Little Change to Supply and Demand Report 25 Oct, 2015
CoinWorld - Check your 1998 American Eagles; they might be on wrong planchet - The Only American Silver Eagle Bullion Error Coin Sells for $50,000
NDTV - PM Modi on Mann ki Baat: Gold Monetisation Scheme to be Ready in Coming Weeks
VIDEO : Zero Hedge - Overstock Holds 3 Months Of Food, $10 Million In Gold For Employees In Preparation For The Next Collapse
TECHNICAL ANALYSIS : zentrader - Euro Weakness = Dollar Strength
VIDEO : U.S. Global Investors - The “Oprah Effect” and Gold
The New York Times - The Central Bank Skeptic Who Helped Give Birth to the Fed
10/24/2015 - Bullion News
Wealth Daily - The CPI vs. Real Inflation
TECHNICAL ANALYSIS : Inside Futures - The Silver Chart Looks Interesting
Bloomberg - What Will It Mean If the Yuan Gets Reserve-Currency Status?
The New York Sun - Whitewashing the Fed
AUDIO : Financial Sense - Bull Markets – It’s All About Liquidity
BAWERK - The Great Unwind
AUDIO : Money Metals Exchange - Analyst John Rubino: Explosive Demand Factors Setting up Possible "Perfect Storm" in Silver
GoldSilverWorlds - How Much Paper Gold Is Being Traded Daily?
Zero Hedge - You Know It's Bad When...
Free Market Cafe - Pity Goldman Sachs
Profit Confidential - U.S. National Debt: As It Rises, This Investment Will Soar
Sovereign Man - What your high school chemistry teacher never taught you about gold
10/23/2015 - Bullion News
VIDEO : Money Show - A Perspective on Gold vs. Gold Mining Shares
TECHNICAL ANALYSIS : Live Trading News - Technical Look A Gold Pattern: A Bullish Flag Breakout Targets 1200+
TECHNICAL ANALYSIS : King One Eye - US Dollar -- Breakout or Fakeout?
Armstrong Economics - Quantitative Easing & the Nightmare It Has Created
TECHNICAL ANALYSIS : Trader Dan's World - "Funny isn’t it how we have Seen Our Entire Global Financial System Reduced to a Barrage of Words Coming Out of the Mouths of Central Bankers" “PATHETIC” is more like it.
VIDEO : CNBC - Rick Santelli speaks to Peter Eliades, Stock Market Cycles Management, about his bearish technical view on the market.
Notes from Underground - Mario Draghi Declares War On German Economic Policy
INFO~GRAPHIC : Visual Capitalist - The U.S. Debt Ceiling has Risen No Matter Who is in Office
Bloomberg - IMF Said to Give China Strong Signs of Reserve-Currency Nod
NewsMax - US Mint's Gold-Bullion Coin Sales Rebound
Market Watch - Silver bullion coins are scarce, but prices don’t show it
The Daily Reckoning - Don't Follow the Crowd, Lead the Way
10/22/2015 - Bullion News
Mish's Blog - As Draghi Hints at More QE, German Bond Yields Hit Record Low Negative Yields; Economic Madness
VIDEO : Bloomberg - Video of Mario Draghi's Remarks
GoldReporter.de - Goldman Sachs sees "risks" that the price of gold continues to rise
MINING - Venezuela ready to dump 80 tonnes of gold
Money Metals Exchange - The Seven Biggest Lies Told (and Believed) about Gold
GOLD~NANO : NanoTechnology Now - New Step towards Smart Treatment of Breast Cancer by Gold Nanoparticles
CoinNews - Gold Dips, Silver and US Mint Silver Eagles Gain
Zero Hedge - Auto Loan Market "Reminds Me Of What Happened Right Before The Crisis", Top Regulator Warns
NIA - IS - Putin Preparing for Russian Gold Standard?
SRSrocco Report - 2015 RECORD SILVER INVESTMENT RATIO: 1% = 30%
The Bullion Desk - China Construction Bank joins London gold price auction
Zero Hedge - Finance Professor "Invests" In Jim Cramer's "Buy Right Now" Portfolio, Loses Money On 72% Of Stock Picks

SD Bullion - 4.8 star Customer Reviews
10/21/2015 - Bullion News
Market Realist - LBMA Conference Projections... Part 1 thru 5
SAXO Group - Tocqueville Gold Strategy Investor Letter Third Quarter 2015
SAXO Group - Markets jittery before Draghi tomorrow, Poloz first
Bloomberg - These Are the Fed's Three Weapons If the Economy Falters
Mint News Blog - A Look at Cumulative U.S. Mint Bullion Sales
GoldReporter.de - First Indian gold bullion coin: Here are the details
VIDEO : Kitco - HSBC Remains ‘Cautiously Bullish’ On Gold, Calling For $1,205 Year-End Price
TECHNICAL ANALYSIS : The Deviant Investor - Dollar Decline Cycle
DISCOVERY - HOW MUCH GOLD DO YOU REALLY OWN?
Reuters - Platinum fails to fill breach left by gold in South Africa
Sputnik News - Russia is on Course to Global Platinum Domination
EconoTimes - Russian Central bank increases its gold reserves by 34 tons in September
VIDEO : USA Watchdog - Negative Rates for Next 10 Years-Buy Gold-Axel Merk
CoinWorld - Patriotic printers: Paul Revere, silversmith and 'Midnight Rider'
10/20/2015 - Bullion News
The Felder Report - The Latest Margin Debt Figures Send An Ominous Signal For Stocks
AUDIO : Sovereign Man - Dr Ron Paul on why the Fed's days are numbered
The Telegraph - One of the causes of the financial crisis is finally being tackled
Plata - The Fundamental Flaw of 'Mainstream Economics' by Hugo Salinas Price
GOLD~NANO : dvids - Fantastic Journey: Transporting Life Saving Drugs by Micromotors
VIDEO : Kitco - Austrian Central Bank Addresses Gold Repatriation
TECHNICAL ANALYSIS : Acting Man - Gold – A Rally No-One Really Believes in
Bloomberg - LBMA Considers Handling All Precious Metals on Regulatory Change
iStockAnalyst - The Return Of The Debt-Ceiling Follies In Washington
Sprott Money - Confusing Inevitable with Imminent - Jeff Thomas
CoinNews - 2015 US Mint Coin Production Highest Since 2007
MOTHERBOARD - How an Obsessed Billionaire Finally Bought Gold.co.uk After Seven Years
10/19/2015 - Bullion News
CHARTS : dshort - NYSE Margin Debt Is Now 11% Off Its April Record High
CHART : GoldSilverWorlds - Gold: Third Time’s The Charm? Amazing Chart
CoinNews - US Mint Sets Silver Eagle Allocation Lower to 970,000
Money Metals Exchange - Gold Shows Strength as Debt Ceiling Showdown Approaches
TECHNICAL ANALYSIS : Kimble Charting - Dow Jones – Not a good place for it to run out of gas!
VIDEO : CNBC - Treasury Secretary Jack Lew: Raise the debt limit
Zero Hedge - Traders Are Panic-Selling T-Bills After Jack Lew Warns Of "Terrible" Debt Limit Accident
Bloomberg - London Gold Market Under Scrutiny as Bullion World Gathers
Reuters - China mounts gold liquidity grab as London market reforms
Sputnik News - Self-Indebted: US-Based Investors Buyout Treasury Bonds Dumped by China
International Man - The Next “Greece”
Gold-Eagle - Bullion Billionaires Who Like GOLD
Casey Research - Find Out What Doug Casey Is Buying Today
AUDIO : Midas Letter - Quantum Funds Co-Founder Jim Rogers on Gold, Russia-U.S. Proxy War, U.S. Dollar
10/18/2015 - Bullion News
The Daily Bell - Why Most Gold Stocks Are Bad Investments
ValueWalk - Will Gold Finish 2015 With A Gain? by Frank Holmes
Calculated Risk - For Confidence Sake : Goldman Sachs (Hopes) Expects "Fed Liftoff" in December
CHARTS : BAWERK - US Dollar – the modern day Bancor
CHARTS : Visual Capitalist - Gold: Off to the Races, or Just Another False Start?
TECHNICAL ANALYSIS : ZenTrader - Welcome To Bear Market Stage 6
International Man - How to Survive the “Deep State” by Doug Casey
GoldSeek - COT Gold, Silver and US Dollar Index Report
Market Watch - Lack of economic muscle? U.S. at mercy of China, strong dollar
Mises Institute - Sanders, Trump, and John Maynard Keynes
AUDIO : Money Metals Exchange - Negative Interest Rates Signal Escalation in War on Cash
CARTOON : Zero Hedge - "We're Out Of Yellow Bricks"
10/17/2015 - Bullion News
MoneyBeat (WSJ) - Will Treasury Ever Go Negative?
Mish's Blog - Can the Fed Really Print Money? What Would Negative Interest Rates Do?
TECHNICAL ANALYSIS : King One Eye - Bombs Away in US Dollar Index -- Up Goes Gold!
TECHNICAL ANALYSIS : Market Pulse - Gold – Bullishness Grows as Fed Hike Priced Out
Coin Update - Tips for Selling Coins and Paper Money on eBay
BDlive - Fed rate delay adds to bullion price puzzle
The Peoples Bank of China - 2016 Gold & Silver Pandas - Change in Weight from Ounces to Grams - Google Translation Link
BullionStar - SGE Withdrawals At Record High 1,958t YTD
Xinhua - News Analysis: China's push to add renminbi to SDR basket nearing finish line
VIDEO : BNN - BitGold transforms into GoldMoney
GoldMoney - Silver as Money
Zero Hedge - "Its Not The Economy Stupid, It's The Dollar"
The Telegraph - Britain's biggest banks to be forced to separate retail banks from investment arms
10/16/2015 - Bullion News
SAXO Group - The Monetary Policy Dead End
PDF : Gold Standard Inst. - Gold Standard Institute - October Journal
Numismaster - Silver Eagle shortage eases a bit
TECHNICAL ANALYSIS : FXStreet - Gold Analysis : Weakness to persist, eyes 1170 on upbeat US data
Reuters - China adds more gold to reserves in September
GOLD NANO-PARTICLES : PuppyUp - Gold Nano-Particles used to Fight Prostate Cancer in Dogs
CHARTS : dshort - Deconstructing the Consumer Price Index
Daily Reckoning - Inflation Headlines vs. Reality Reveals Outright Government Fraud
AUDIO : Notes from Underground - "Gold's Inflection Point and Asset Allocation with John Butler"
Notes from Underground - The Stock Market Says, “I Think Icahn, I Think Icahn”
Alhambra Investment Partners - Gold(man) Simplicity
Perth Mint Research - China will save us
CoinWeek - FRAUD ALERT : Counterfeit Cashier’s Checks being used to by Gold
USNews - Appeals court again considering fate of rare seized Double Eagle gold coins worth $80M or more
10/15/2015 - Bullion News
CoinWeek - The Silver Shortage Hits, U.S. Mint Blank Supplier, Sunshine Minting
CoinNews - Gold Notches 4-Month High; 2015 Silver Eagles Top 38M
VIDEO : CNBC - Surprising Fed paper drops a dovish bombshell
CHARTS : StreetTalkLive - 3 Things: The Fed Is Screwed
Casey Research - The One Asset to Own When Things “Go to Hell”
Midas Letter - All Hail the Return of the Bull Market for Gold and Precious Metals
VIDEO : USA Watchdog - Financial Collapse to Wipe Away All the Lies-Rick Ackerman
Bullion Vault - Gold's Hottest Rumour at LBMA Conference 2015
VIDEO : CNBC - Commodities have found bottom: Expert
Reuters - Platinum price forecasts for 2016 lowered after third quarter plunge: poll
Bloomberg - Charting the Markets: Burberry and Bonds Not as Good as Gold
AUDIO : Sovereign Man - Yes, the US government really is bankrupt. Here’s proof...
INFO~GRAPHIC : Visual Capitalist - China vs. United States: A Tale of Two Economies
GOLD RUSH : Inquisitr - When Does Discovery's "Gold Rush" Return? and What to Expect When it Does...?
10/14/2015 - Bullion News
VIDEO : CNBC - Santelli & Art Cashin get real on the Fed
The Sovereign Investor - Good News for Gold
AUDIO : McAlvany Weekly Commentary - When Bad News is Called Good News: Think for Yourself
Bloomberg - Dollar Can't Get a Break as Economic Reports Lead to 3-Month Low
Reuters - Gold hits 3-1/2 month high on talk of delay in Fed rate rise
Free Market Cafe - The Golden Hour Is Here
VIDEO : CNBC - Santelli: Retail Sales Numbers 'Not Kind'
CHARTS : Zero Hedge - Gold Soars Into Green Year-To-Date, Breaks Above Key Technical Level
Kitco - More Market Turmoil As Fed Experiment Ends Badly Will Drive Gold Higher - Tocqueville
VIDEO : MINING - Gold Fever: 5 Surprising Uses for Gold
10/13/2015 - Bullion News
The Silver Institute - Silver Bullion Coins on Allocation at Major National Mints
Bloomberg - Silver Advances a Third Day Amid Signs of Increasing Coin Demand
CoinNews - Perth Mint Gold and Silver Sales Soar in September
Money Morning - Why You Need to Buy hard Assets
Notes from Underground - A Few Things Before the Financial Ship Sails
Bullion Desk - Gold reverses higher as dollar weakness persists
AUDIO : PhysicalGoldFund- Interview with Jim Rickards
OfTwoMinds - Where Is the First Helicopter Drop of Money Likely to Land?
CHARTS : biiwii - Gold vs...
The Deviant Investor - Gold Prices Will Rise Because...
Reuters - Shanghai Gold Exchange to name new chairman ahead of benchmark launch
dshort - Household Incomes: The Decline of the "Middle Class"
Kimble Charting - What’s It Mean When Everyone Expects A Black Swan Event?
The Washington Post - A high-society soccer dad lived a luxurious life. Now he’s going to prison.
10/12/2015 - Bullion News
CHARTS : SAXO Group - The Increasing Tyranny of King Dollar
MarketWatch - Chinese Finance Minister says U.S. Shouldn't Raise Rates
TECHNICAL ANALYSIS : The Short Side of Long - US Dollar & Emerging Markets
AUDIO : Daily Reckoning - Fed Governor's Comments Are Causing Market Mayhem
TECHNICAL ANALYSIS : Gold-Eagle - Update On The Gold Silver Ratio
TECHNICAL ANALYSIS : GoldSilverWorlds - Green Light For Silver
Money Metals Exchange - Move over ZIRP... Here Comes NIRP!
Bloomberg View - Growing Government Debt Will Test Euro-Zone Solidarity
Sovereign Man - Three obvious signs the entire system is changing
BullionStar - How Much Gold Is China Importing And Does It Still Correlates to SGE Withdrawals?
Economic Times - Why bad economic news is good for precious metals like gold, silver
The Star - Huge haul of gold bars still missing in bank-fraud case
Reuters - Mitsui to shut precious metals business in London, New York-sources
BGASC - Customer Reviews link
10/11/2015 - Bullion News
CHARTS : Ahead of the Herd - 2015 - The Year of Peak Gold..."Color Outside the Line"
The Telegraph - World Cannot Spend Its Way Out of a Slump, Warns OECD Chief
MarketWatch - Fed officials seem ready to deploy negative rates in next crisis
CARTOON : The Mess That Greenspan Made - Financial Markets and the Fed
Yahoo Finance - About liquidity ...
AUDIO : MoneyWeb - US growth is weak, Fed will ease rates – Currency Wars author James Rickards
Zero Hedge - We Are All (Almost) Japanese Now
MENA FN - India's Gold Imports Plunge 52%
Deviant Investor - Global Players at the Financial Poker Table
ProActiveInvestors - Platinum group metal production falls in South Africa
Bullion Vault - Why a Gold Standard?
10/09/2015 - Bullion News
VIDEO : CNBC - The Economic Implications of Negative Rates
IMAGES : Mint News Blog - 2017 America the Beautiful Program Design Candidates
TECHNICAL ANALYSIS : SAXO Group - WCU: Commodities Soaring with Fed Doves
Reuters - LBMA asks for bids to provide gold trading, clearing services
Alhambra Partners - The New Greater Fool
GATA - Bron Suchecki: Bundesbank's gold bar list would fail an audit
CHARTS : Zero Hedge - "It's Not A Risk-On Rally, This Is The Biggest Short Squeeze In Years" Says Bank Of America
Acting Man - Why a Gold Standard?
10/08/2015 - Bullion News
Vimeo - Larry Parks Show - Keith Weiner Interview
Silver Coins Today - American Silver Eagle Coin Sales Loosen Up
CHARTS : The Short Side of Long - Bond Markets Message: More Stimulus?
CHARTS : BAWERK - Why NIRP may trump QE4
First Rebuttal - Who’s Profited Most from 7 Years of Fed Policy…. Well the Fed of Course!
Perth Mint Research - OCC precious metal derivatives fat finger
Sovereign Man - The US government just crossed the Rubicon
Bloomberg - VW Scandal's Boost for Palladium Seen Sustained, Top Miner Says
Marc to Market - Great Graphic: Keeping Contributors to World Growth in Perspective
10/07/2015 - Bullion News
GoldSeek - Gold Money Versus Central Banks Paper Ponzi
VIDEO : Fox Business - James Rickards: Fed is lousy at seeing bubbles, they never see them
TECHNICAL ANALYSIS : SAXO Group - Gold has trended higher after NFP
KIRO TV - To Bullion Or Not
INFO~GRAPHIC : Visual Capitalist - The World Map of Debt
Reuters - RPT-China FX reserves fall in September to $3.51 trillion
The Sidney Morning Herald - Germany's Bundesbank reveals where the gold is buried
PDF : Bundesbank - The Deutsche Bundesbank’s Gold Holdings
GOLD NANO-PARTICLES : FSN - This 12-year-old came up with a way to stop allergies before they start
AUDIO : FSN - David Morgan – Silver Has Likely Bottomed
Bloomberg - Platinum Futures Rise to Two-Week High as Supply Concerns Mount
TECHNICAL ANALYSIS : The Speculative Investor - Market Stuff
CoinNews - 2015 $20 Gingerbread Man Silver Coin for $20
AL ARABIYA - Turkey arrests six over ‘minting coins for ISIS’
10/06/2015 - Bullion News
CheatSheet - Northwest Territorial Mint : The Worst Way to Buy Silver
GlassDoor - Employee Reviews : Northwest Territorial Mint
Project Syndicate - Debt Déjà Vu
CNBC - Homes as ATMs: It's starting again
MarketWatch - Most Americans have less than $1,000 in savings
TheGoldandOilGuy - Financial Repression – Governments boost their coffers and hold down interest rates
Bullion Vault - Panic into Bullion? Not Outside Coin Mark-Ups
TECHNICAL ANALYSIS : Money Metals Exchange - Key Chart Shows Silver at Critical Crossroads
Perth Mint Research - Sucking silver through a straw
Bloomberg - Yuan Overtakes Yen as World's Fourth Most-Used Payments Currency
The Deviant Investor - Gold, Silver and Choices – Good and Bad
MarketWatch - Gold may be on verge of ‘breakout’ higher as ETF holdings rise
MINING - Gold Price Momentum Builds
Kitco - Silver Market No Longer Looks Awful As Prices Push To 200-DMA
10/04/2015 - Bullion News
Bullion Vault - What Will the Next 'Lehmans' Crash Do to Gold Prices?
Notes from Underground - Weak Unemployment Report Creates A Cacophony of Market Reactions
Bloomberg - Kocherlakota Says Low Inflation Warrants Further Fed Stimulus
Clive Maund - FIAT ENDGAME - more QE, NIRP, bails-ins and Pensions Plunder...
GOLD NANO-PARTICLES : Kaleo - How Gold and Titanium Could Treat Kidney Cancer
SAXO Group - Steen's Chronicle: Meet Mr and Mrs Consensus
BullionStar - Chinese And Russian Central Bank Continue To Add Gold To Official Reserves: 16 & 31 Tonnes In August
Solidus - Fed-Engineered Jobs Failure
INO - Former Fed chief Bernanke says Wall Street executives should have gone to jail for crisis role
10/02/2015 - Bullion News
U.S. Global Investors - India Issues Its First Sovereign Gold Coin… to Curb Gold Imports
Zero Hedge - Payrolls Disaster: Only 142K Jobs Added In September With Zero Wage Growth; August Revised Much Lower
VIDEO : CNBC - Fed policy complete failure
Bloomberg - Perth Mint Silver Sales Jump As Prices Fall to Six-Year Low
Perth Mint Bullion - The Perth Mint's Monthly Sales - September 2015
Daily Reckoning - How Inflation Could Be Caused in 15 Minutes
Platts - Going for gold: London bullion market finds no clear path to increasing liquidity - On the Latest Bullion Investigation "None of the banks mentioned actually vault gold in London, the source said, noting the absence of the likes of HSBC, Scotiamocatta, JP Morgan and UBS."
Perth Mint Research - Yet Another Precious Metal Manipulation Investigation
CoinWorld - Third-quarter sales of American Eagle gold bullion coins rise
The Deviant Investor - The Great Illinois Gold Rush!
CNBC - Moon Express, a start-up that plans to mine the lunar surface for rare and precious metals, took one step closer to making its moonshot a reality on Thursday
10/01/2015 - Bullion News
CHARTS : NIA - The World’s Strongest Fiat Currency Since 1971, 2000, and in 2015
CHARTS : McClellan Financial - Spending Our Grandchildren’s Money
Free Market Cafe - The Sun Shines on Silver
CoinWeek - Another Bullion Sell Out for U.S. Mint: Bombay Hook 5 oz. Silver Bullion Coin
Kitco - U.S. Mint Posts 181% Jump In Gold Coin Sales, Silver Sales Hit 29-Year Record High In Q3
VIDEO : CNBC - Santelli: A recovery that has jobs but no productivity
Cobden Centre - From ZIRP to NIRP
TECHNICAL ANALYSIS : Market Anthropology - Connecting the Dots - 9/29/15
Bloomberg - China Boosts Gold Reserves 1% in August, Diversifying Assets
Perth Mint Blog - Bullion Buying: No ID Required For Telephone Orders Up To $5,000
Other pages, on this Guide, that you
may like...

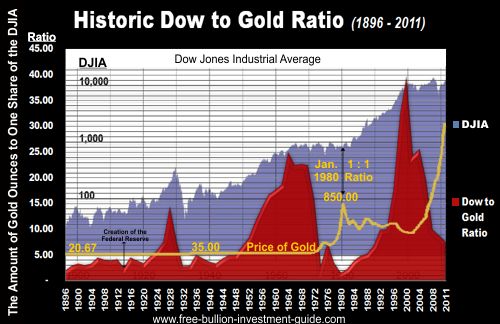


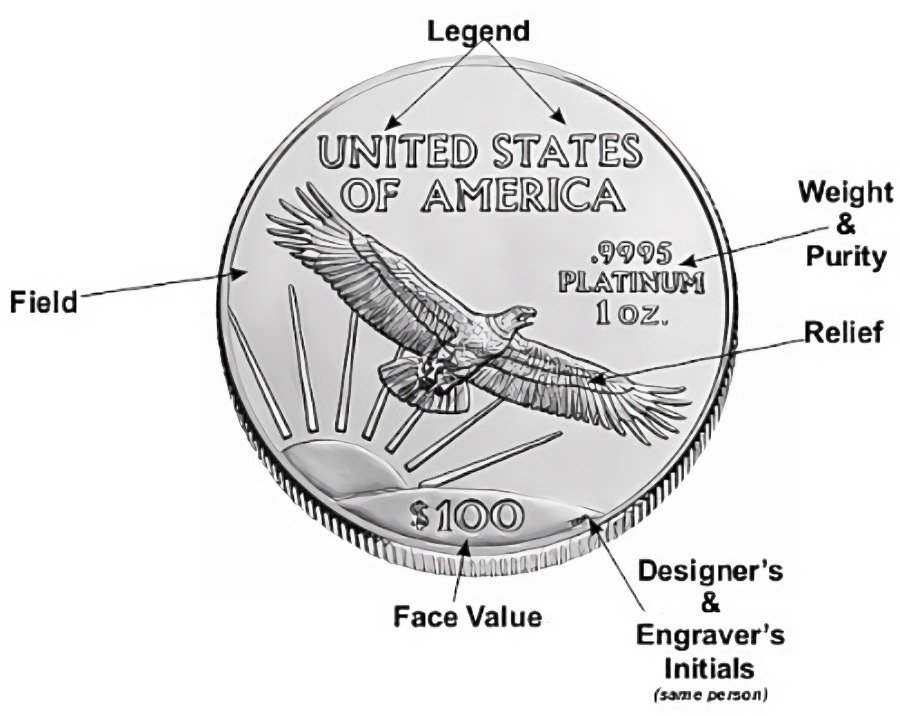


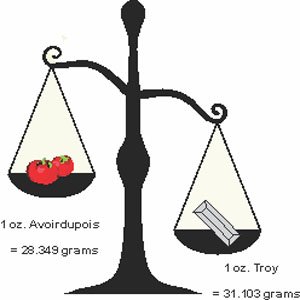

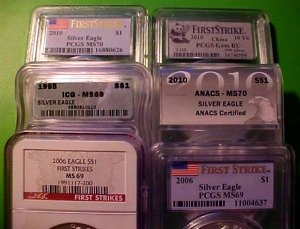


4.7 star - Customer Reviews
For Bullion Market News...
Notice:
The charts, commentary, and information on the Free-Bullion-Investment-Guide.com are in no way an endorsement of how you should invest or divest.
|
Support this Guide & Paypal Thank You for Your Support |
|
|
 | |||||

Recent Articles
-
Newsletter of the Free Bullion Investment Guide - April 2026
Apr 05, 26 04:44 PM
 The April 2026 newsletter of the Free Bullion Investment Guide provides the latest updates, fundamental and technical gold and silver market analysis, the best articles from last month, and a list of…
 -
Newsletter of the Free Bullion Investment Guide - February 2026
Feb 07, 26 02:12 PM
 The February 2026 newsletter of the Free Bullion Investment Guide provides the latest updates, fundamental and technical gold and silver market analysis, the best articles from last month, and a list…
 -
Newsletter of the Free Bullion Investment Guide - January 2026
Jan 07, 26 04:07 PM
 The January 2026 newsletter of the Free Bullion Investment Guide provides the latest updates, fundamental and technical gold and silver market analysis, the best articles from last month, and a list o…
 -
Newsletter of the Free Bullion Investment Guide - December 2025
Dec 07, 25 04:35 PM
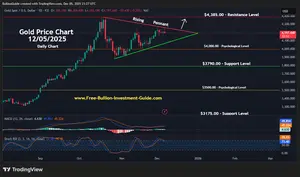 The December 2025 newsletter of the Free Bullion Investment Guide provides the latest updates, fundamental and technical gold and silver market analysis, the best articles from last month, and a list…
 -
Newsletter of the Free Bullion Investment Guide - November 2025
Nov 08, 25 01:58 PM
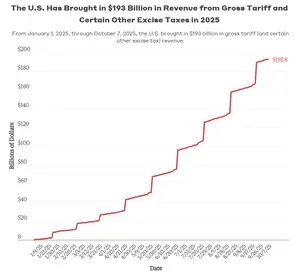 The November 2025 newsletter of the Free Bullion Investment Guide provides the latest updates, fundamental and technical gold and silver market analysis, the best articles from last month, and a list…

18W LED Security Light (Dusk to Dawn & Motion Sensor) - $32.99
from:
 LED Lighting

) (as of March 11, 2011)")
This website is best viewed on a desktop computer.
Keep this Guide Online
& Paypal
Thank You for
Your Support
with Feedly
Search the Guide
| search engine by freefind | advanced |

Give a lasting gift of the iconic Silver Maple Leaf bullion coin [More]
Free Shipping on Orders over $100 (CDN/USA)
The Sovereign 2026 Gold Bullion Coin in Card

Britian's
Royal Mint

Daily
Newsletter
Mintages & Photos
|

|
Silver Panda |

Mintages
for
2024
Gold, Silver, & Platinum
Austrian Philharmonic Bullion Coins

|
Silver Philharmonics  |
Platinum Philharmonics

Platinum and Palladium Bullion


Mintages
for
2025
Gold & Silver Mexican Libertad
|
Gold Libertads |


Updated Mintages for
American Gold Buffalo
American Gold Eagle
American Silver Eagle
2024 & 2025
Jerusalem of Gold Bullion
Coin photos
(bottom of page)
 Obverse side")


Help Us Expand our Audience by forwarding our link
www.free-bullion-investment-guide.com.
Thank You!
Last Month's

In No Particular Order
April 2026
|
All Articles were Originally Posted on the Homepage Gold Nanoparticle Cancer ResearchSona Nanotech’s Hyperthermia Platform Boosts Immunotherapy Response in Colorectal Cancer Study - Tipranks Sona Nanotech Showcases Cancer Therapy Results At Prestigious Industry Cancer Conferences - Financial Times Development of gold nanostars coated with mesoporous silica for chemo-photothermal therapy - Published Research Paper - Journal of Drug Delivery Science and Technology (Science Direct) |
All Articles were Originally Posted on the Homepage


Click Ad to Request a Free Appraisal Kit
ExpressGoldCash
Customer Reviews 4.9 stars


Give a lasting gift of the iconic Silver Maple Leaf bullion coin [More]
Free Shipping on Orders over $100 (CDN/USA)
