Gold and Silver's Positive Pattern
Gold, Silver, U.S. Dollar, Platinum, and Palladium Review & Outlook
06/19/2017 thru 06/30/2017
Originally Posted on 06/25/2017 @11:17 pm
by Steven Warrenfeltz
Subscribe to this Blog

Hello,
Thank you for visiting the Free-Bullion-Investment-Guide's latest blog, I hope that you and your family have been well.
Before we get to this week's post; below are a few of Last Week's Best News Articles that were taken from this guide's homepage.

Op-Ed: How much gold do Americans own? - Los Angeles Times
CHARTS : Bull or Bear, Four Gold Charts That Offer Something for Everyone - Bloomberg
The Fed Needs to Acknowledge Slowing Economy - Bloomberg View
9.5 Trillion Reasons Gold and Silver Are Looking More Lustrous Than Ever - The Motley Fool
The problematic way to make our national debt disappear - New York Post
'Question the Messenger' Think Twice Before Opening A Gold Or Silver IRA - Forbes
Best of the Week for Nano-Particle Cancer Research
GOLD NANOTECHNOLOGY : The Effect of shape on Cellular Uptake of Gold Nanoparticles in the forms of Stars, Rods, and Triangles - Scientific Reports
GOLD NANOTECHNOLOGY : CANCER RESEARCH : Tracking Therapeutic Cells - Advanced Science News

Gold and Silver's Positive Pattern
Last week's post was titled: The Good and the Bad in Gold & Silver's Charts; in it, I showed you two scenarios that were developing in Gold and Silver’s Charts, one good, one bad, so far the good is the one that is shining through.
This week’s charts will include Gold, Silver, U.S. Dollar, Platinum, Palladium.
Plus, I am going to start to randomly follow other charts that relate to these markets, this week's addition will be the GDX – Gold Miners ETF.
GOLD
Review
As mentioned above, last week, two charts were posted for gold, one showed a negative 'Head and Shoulders' pattern, the other showed a positive 'Inverse Head and Shoulders' pattern.
So far, it looks like Gold's 'Inverse Head and Shoulders' pattern will form, below is last week's outlook and chart.
Below, the Positive Inverse Head and Shoulders patterns in gold's chart haven’t fully developed, this is why there are question marks beside each right shoulder.
In addition, the possible 'Inverse Head and Shoulders' patterns are only found in Gold’s MACD and RSI (relative strength indicator).
In all honesty, these positive Head and Shoulders patterns would not have been included if it wasn’t for the fact that since January 2017, gold has consistently made higher lows (see chart below).
For both the Good and the Bad in gold's chart we won’t know which pattern will be confirmed until the neckline in one of the patterns is broken.
Time will tell which way gold breaks.

GOLD - This Week's Outlook
Last week gold made a new Higher Low, so this week, we should see it continue to move higher.
Its MACD is starting to change directions and the RSI (relative strength index) is showing that there is strength in the price of gold.
As you can see the right shoulder of each 'Inverse Head and Shoulders' pattern still has a question marks (?) next to it because the pattern won't been confirmed until the price breaks above the neck-line.

Charts provided courtesy of TradingView.com
Gold's Price Resistance and
Support Levels
Gold's Resistance Levels
$1300.00
$1290.00
$1265.00
Gold's Support Levels
$1250.00
$1240.00
$1225.00
SILVER
Review
Like gold, last week two charts were posted for silver, one Negative and one Positive and so far, the positive chart looks like it will be the one to be confirmed.
Below is last week's silver outlook and positive chart.
In the Silver chart below, the right shoulders of the positive 'Inverse Head and Shoulders' patterns the have question marks beside them because the pattern hasn’t formed; yet?
In addition, just like gold, we won’t know which pattern will prevail until one of the neck-lines have been broken.

SILVER - This Week
You can see in the chart below that silver's MACD and RSI are still a little behind gold's lower indicators (above), this tells us that gold is still leading the short-term trade between the two precious metals.
Silver's MACD is starting to change directions and the RSI is also giving an indication that there is strength in the price of silver.
Unlike gold, the 'Inverse Head and Shoulders' patterns in Silver's charts were found in its Candlestick chart, MACD and RSI.
However, like gold, the right shoulder of each 'Inverse Head and Shoulders' pattern still have question marks (?) next to them because the pattern will not be confirmed until they break above the neck-line.
This week we should continue to see silver's price slowly rise as it gets closer to the neck-line.
Plus, several Central Bankers are making speeches this week, so it could give the precious metals some pauses, but uncertainty is still very high in the world and this fact favors the precious metals.

charts provided courtesy of TradingView.com
Silver's Price Resistance &
Support Levels
Silver's Resistance Levels
$17.20
$17.00
Silver's Support Levels
$16.40
$16.00
US DOLLAR
Review
Below is last week's U.S. Dollar review and outlook, plus its chart.
So far, I am surprised that the US Dollar has traded in the steep channel, but for the week to come, I expect more of the same.
(continued...)

U.S. Dollar - This Week
Although the dollar traded up for most of the last week, it continued to stay within its Descending Channel.
This week the U.S. Dollar looks like it will continue to trade inside the steep Descending Channel; it also looks like it will continue to pull back in price.

Charts provided courtesy of TradingView.com
U.S. Dollar's Price Resistance and Support Levels
U.S. Dollar's Resistance Levels
$98.10
$97.80
U.S. Dollar's Support Levels
$96.50
$96.00
PLATINUM
Review
Last week, I posted the following chart and commentary for Platinum.
...it (platinum) temporarily destroyed the Descending Channel as you can see in the chart below.
Above, I purposely stated that Platinum's 'Descending Channel' was 'temporarily' destroyed because I've redrawn it as you can see in the chart below.
But, a 'Falling Wedge' has also been identified, so the price of platinum could break above it again sometime in the near future and destroy it for good.
Or when it does break the 'Falling Wedge,' it may still find resistance against the upper trend-line of the Descending Channel; time will tell.

PLATINUM - This Week
Platinum continues to trade inside the Descending Channel and the Falling Wedge.
The Descending Channel is an obvious negative pattern for the precious metal, but the Falling Wedge is a positive pattern, so in an investor's point of view they cancel each other out, unless the price of Platinum breaks above the Descending Channel, after it confirms the Falling Wedge.
Overall, Platinum's outlook won't change to the positive until it breaks above the Descending Channel.
This week, Platinum's MACD and RSI are indicating that a change in price direction is in the process, so we should see the price of platinum rise this week.
Time will be the judge as to when Platinum breaks its Falling Wedge this week or sometime in the near future.

Charts provided courtesy of TradingView.com
Platinum's Price
Resistance and Support Levels
Platinum's Resistance Levels
$945.00
$935.00
Platinum's Support Levels
$920.00
$910.00
PALLADIUM
Review
Below is last week's outlook for Palladium.
This week, I was unable to find any patterns in Palladium's chart, which maybe a blessing in disguise after my last assessment of the precious metal.
However, the price of palladium looks like it should have some pull back this week.
Plus, palladium's 'Ascending Channel' is still going on strong, so its price is expected to continue to trade inside it.

PALLADIUM - This Week
Last week, the price of palladium rose a little, then it pulled back in price near the end of last week.
In palladium's price chart (below), the year and a half long Ascending Channel is the only pattern that can be detected, at this time.
However, Palladium's MACD and RSI are indicating that more of a pullback in the precious metals price is possible this week.
Furthermore, palladium's market serves more to the industrial market than it does to the investment market, so the high price may be another reason for its latest pullback - see the article below.
Palladium price nears 16-year high - NIKKEI Asian Review
Charts provided courtesy of TradingView.com
Palladium's Price Resistance and Support Levels
Palladium's Resistance Levels
$925.00
$885.00
Palladium's Support Levels
$830.00
$800.00
GDX - Gold Miners ETF
As I mentioned above, I'm going to start to randomly follow other charts that relate to the markets above, this week's addition will be the GDX – Gold Miners ETF.
Next week, I will move on to another asset's chart, unless the GDX breaks in one way or another the pattern that I found in the chart.
However, if it doesn't I will move on, but I will come back to it when the pattern does break to show you how it moved.
So, in the GDX's chart I found a falling wedge, this is a positive pattern as seen in the definition here.
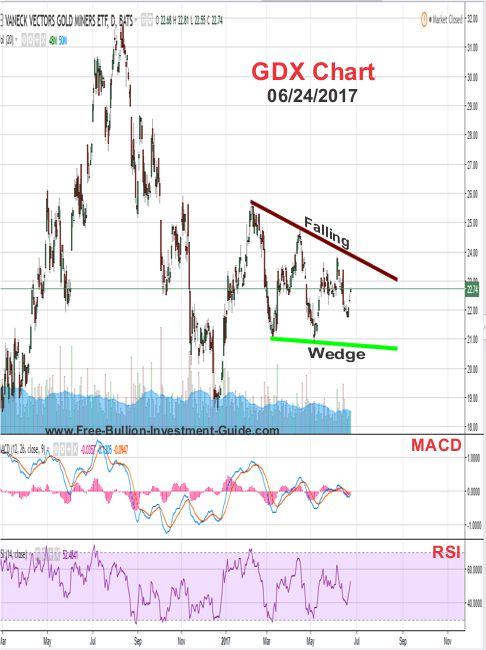
Charts provided courtesy of TradingView.com
Thank You for Your Time.
Have a Great Week.
God Bless, Steve
'Click Here' see all of the prior Blog posts,
Thank You for Your Time!
|
Support this Guide & Paypal Thank You for Your Support |
|
|
 | |||||

Recent Articles
-
Newsletter of the Free Bullion Investment Guide - May 2026
May 05, 26 02:25 PM
 The May 2026 newsletter of the Free Bullion Investment Guide provides the latest updates, fundamental and technical gold and silver market analysis, the best articles from last month, and a list of re…
 -
Newsletter of the Free Bullion Investment Guide - April 2026
Apr 05, 26 04:44 PM
 The April 2026 newsletter of the Free Bullion Investment Guide provides the latest updates, fundamental and technical gold and silver market analysis, the best articles from last month, and a list of…
 -
Newsletter of the Free Bullion Investment Guide - March 2026
Mar 04, 26 02:08 PM
 The March 2026 newsletter of the Free Bullion Investment Guide provides the latest updates, fundamental and technical gold and silver market analysis, the best articles from last month, and a list of…
 -
Newsletter of the Free Bullion Investment Guide - February 2026
Feb 07, 26 02:12 PM
 The February 2026 newsletter of the Free Bullion Investment Guide provides the latest updates, fundamental and technical gold and silver market analysis, the best articles from last month, and a list…
 -
Newsletter of the Free Bullion Investment Guide - January 2026
Jan 07, 26 04:07 PM
 The January 2026 newsletter of the Free Bullion Investment Guide provides the latest updates, fundamental and technical gold and silver market analysis, the best articles from last month, and a list o…

18W LED Security Light (Dusk to Dawn & Motion Sensor) - $32.99
from:
 LED Lighting

) (as of March 11, 2011)")
This website is best viewed on a desktop computer.
Keep this Guide Online
& Paypal
Thank You for
Your Support
with Feedly
Search the Guide
| search engine by freefind | advanced |

Give a lasting gift of the iconic Silver Maple Leaf bullion coin [More]
Free Shipping on Orders over $100 (CDN/USA)
The Sovereign 2026 Gold Bullion Coin in Card

Britian's
Royal Mint

Daily
Newsletter
Mintages & Photos
|

|
Silver Panda |

Mintages
for
2024
Gold, Silver, & Platinum
Austrian Philharmonic Bullion Coins

|
Silver Philharmonics  |
Platinum Philharmonics

Platinum and Palladium Bullion


Mintages
for
2025
Gold & Silver Mexican Libertad
|
Gold Libertads |


Updated Mintages for
American Gold Buffalo
American Gold Eagle
American Silver Eagle


Help Us Expand our Audience by forwarding our link
www.free-bullion-investment-guide.com.
Thank You!
Last Month's

In No Particular Order
April 2026
|
All Articles were Originally Posted on the Homepage Gold Nanoparticle Cancer ResearchSona Nanotech’s Hyperthermia Platform Boosts Immunotherapy Response in Colorectal Cancer Study - Tipranks Sona Nanotech Showcases Cancer Therapy Results At Prestigious Industry Cancer Conferences - Financial Times Development of gold nanostars coated with mesoporous silica for chemo-photothermal therapy - Published Research Paper - Journal of Drug Delivery Science and Technology (Science Direct) |
All Articles were Originally Posted on the Homepage