The Good and the Bad in
Gold & Silver's Charts
Gold, Silver, U.S. Dollar, Platinum, and Palladium Review & Outlook
06/05/2017 thru 06/23/2017
Originally Posted on 06/19/2017 @1:35 am
Last Edited on 06/23/2017 @9:50pm
by Steven Warrenfeltz
Subscribe to this Blog

Hello,
Thank you for visiting the Free-Bullion-Investment-Guide's latest blog, I hope that you and your family have been well since my last post.
Before we get to this week's post; below are a few of Last Week's Best News Articles that were taken from this guide's homepage.

Do Gold Bugs Secretly Love Bitcoin? - Energy and Capital
Hope for Best, Plan for Worst by Frank Holmes - Bullion Vault
Fed raises rates, unveils balance sheet cuts in sign of confidence - Reuters
Fed Officials Can't See What's Right In Front Of Them - Mises Institute
$240,418,000,000: Feds Collect Record Taxes in May; Still Run $88,246,000,000 Deficit - cnsnews
Best of the Week for Nano-Particle Cancer Research
GOLD NANOTECHNOLOGY : CANCER RESEARCH : Can this Nano-Particle Turn into Gold Standard Big C Treatment? - Business Line
GOLD NANOTECHNOLOGY : CANCER RESEARCH : Chemists Perform Surgery On Nanoparticles To Modify Its Property - Science Times

The Good and the Bad in
Gold & Silver's Charts
In this week’s gold and silver charts, I’ve recognized multiple Positive and Negative 'Head and Shoulders' Patterns.
A 'Normal Head and Shoulders' pattern is a negative for any asset, as shown in the U.S. Dollar chart below.
Normal Head and Shoulders Pattern

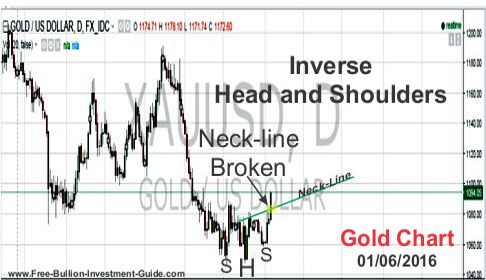
An 'Inverse Head and Shoulders' pattern is a positive sign for an asset, like it was for gold in early 2016.
Another development that has shown up in the charts that is beholden on how the ‘Head and Shoulders’ patterns are confirmed is if gold still leads silver or if silver is leading gold.
If gold confirms its possible 'Inverse Head and Shoulders’ pattern, it will be a clear sign that it is still leading the trade, but if silver confirms its negative head and shoulders pattern it will indicate that it has taken over the lead in the trade between the two precious metals.
This week’s charts and analysis include Gold, Silver, U.S. Dollar, Platinum & Palladium.
GOLD
In the gold analysis from two weeks ago, I stated the following:
“For Gold’s outlook, next week I’m going to be ‘wiping the slate’ and remove gold's long-term trend-line from its chart.
I’ve decided not to remove the trend-line, it will be kept on the charts, for now, it is represented as a dotted line because it is a broken line.
Below is the rest of the outlook from two weeks ago.
This isn’t to say that the price of gold won’t fall back below the trend-line, I almost expect it, but the line has clearly been broken and if gold does fall back below it, it shouldn't be hard for it to move back above it.
After Friday’s move, this week's gold chart is giving the impression that gold will move sideways. Plus, now that the long-term falling trend-line is broken, if gold does move up its closest resistance level is now the $1290 price level.
In Review
As you can see in the chart below, the price of gold did move further up, after breaking the long-term trend-line, reaching a high of $1296, before it fell back down below the trend-line, which was expected.

GOLD - This Week
In this week’s charts, I’ve recognized multiple Positive and Negative 'Head and Shoulders' Patterns
In the first chart below, I’ve indicated the Negative Head and Shoulders patterns in gold’s candlestick chart, MACD, and RSI.

(Edit - 6/23/2017)
The chart above has one problem, the 'Head and Shoulders' pattern in the Candlestick chart does not exist, the most recent high is slightly higher than the previous high.
See Chart Below.
Below, the Positive Inverse Head and Shoulders patterns in gold's chart haven’t fully developed, this is why there are question marks beside each right shoulder.
In addition, the possible 'Inverse Head and Shoulders' patterns are only found in Gold’s MACD and RSI (relative strength indicator).
In all honesty, these positive Head and Shoulders patterns would not have been included if it wasn’t for the fact that since January 2017, gold has consistently made higher lows (see chart below).
For both the Good and the Bad in gold's chart we won’t know which pattern will be confirmed until the neckline in one of the patterns is broken.
Time will tell which way gold breaks.

Charts provided courtesy of TradingView.com
Gold's Price Resistance and
Support Levels
Gold's Resistance Levels
$1290.00
$1265.00
Gold's Support Levels
$1250.00
$1240.00
$1225.00
SILVER
Two weeks ago, I posted the chart below for silver, it showed a confirmed 'Falling Expanding Wedge' that had been identified the previous week.

SILVER - This Week
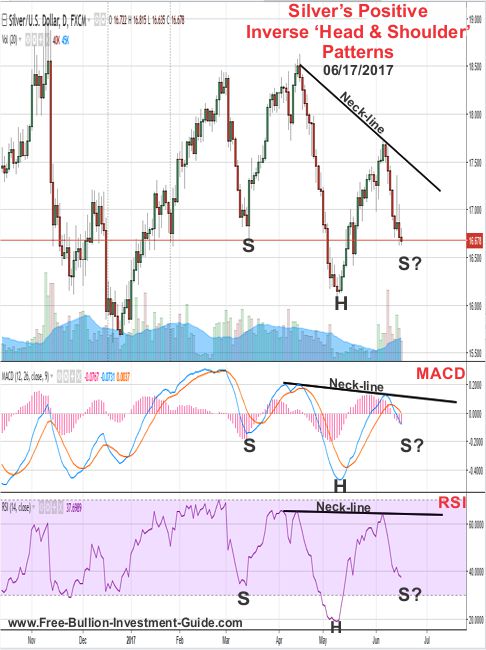
This week, like gold, silver has developed both negative and possibly positive 'Head and Shoulders' patterns in its chart.
In the silver chart below, you can see that a Negative ‘Head and Shoulders’ pattern has developed, however, unlike gold, the negative pattern has not formed in silver’s MACD or RSI (Relative Strength Index).

In the Silver chart below, the right shoulders of the positive 'Inverse Head and Shoulders' patterns the have question marks beside them because the pattern hasn’t formed; yet?
In addition, just like gold, we won’t know which pattern will prevail until one of the neck-lines have been broken.
charts provided courtesy of TradingView.com
Silver's Price Resistance &
Support Levels
Silver's Resistance Levels
$17.20
$17.00
Silver's Support Levels
$16.40
$16.00
US DOLLAR
About three weeks ago, a 'Descending Channel' was identified in the U.S. Dollar's chart.
At the time that it was drawn, I stated the following:
A descending channel is not a good sign for the dollar, but in all honestly, I will be surprised if the dollar trades in the steepness of this channel, time will tell.
So far, I am surprised that the US Dollar has traded in the steep channel, but for the week to come, I expect more of the same.

Charts provided courtesy of TradingView.com
U.S. Dollar's Price Resistance and Support Levels
U.S. Dollar's Resistance Levels
$98.10
$97.80
U.S. Dollar's Support Levels
$96.50
$96.00
PLATINUM
Below is Platinum's outlook and chart from two week ago.
For the week to come, after studying the chart, I was able to identify a 'Falling Expanding Wedge', which is a positive pattern for the precious metal.
The wedge is rather large so it may or may not take a little bit of time for it to play itself out, but once it does, the descending channel should be destroyed.
Note: In the chart below, I mistakenly left out the 'Expanding' while labeling the chart pattern (Falling Expanding Wedge).

In Review
Platinum broke above the 'Falling Expanding Wedge' shortly after I posted the blog post, and it temporarily destroyed the Descending Channel as you can see in the chart below.

PLATINUM - This Week
Above, I purposely stated that Platinum's 'Descending Channel' was 'temporarily' destroyed because I've redrawn it as you can see in the chart below.
But, a 'Falling Wedge' has also been identified, so the price of platinum could break above it again sometime in the near future and destroy it for good.
Or when it does break the 'Falling Wedge,' it may still find resistance against the upper trend-line of the Descending Channel; time will tell.

Charts provided courtesy of TradingView.com
Platinum's Price
Resistance and Support Levels
Platinum's Resistance Levels
$945.00
$935.00
Platinum's Support Levels
$920.00
$910.00
PALLADIUM
Two week’s the following outlook was posted for Palladium.
For this week's outlook, Palladium's RSI looks to be closing in on oversold territory and it should find strong resistance with the upper trend-line of the rising wedge.
So we should see some pull-back in palladium's price this week.

In Review
Two weeks ago, I couldn't have been more wrong in my outlook for palladium, it completely did the opposite of what I stated, as you can see in the chart below.
The price of palladium continued to climb in oversold territory and in the process, it broke the 'Rising Wedge' causing it to fail.

PALLADIUM - This Week
This week, I was unable to find any patterns in Palladium's chart, which maybe a blessing in disguise after my last assessment of the precious metal.
However, the price of palladium looks like it should have some pull back this week.
Plus, palladium's 'Ascending Channel' is still going on strong, so its price is expected to continue to trade inside it.

Charts provided courtesy of TradingView.com
Palladium's Price Resistance and Support Levels
Palladium's Resistance Levels
$925.00
$885.00
Palladium's Support Levels
$830.00
$800.00
Have a Great Week.
God Bless & Thank You for Your Time,
Steve
'Click Here' see all of the prior Blog posts,
Thank You for Your Time!
|
Support this Guide & Paypal Thank You for Your Support |
|
|
 | |||||

Recent Articles
-
Newsletter of the Free Bullion Investment Guide - April 2026
Apr 05, 26 04:44 PM
 The April 2026 newsletter of the Free Bullion Investment Guide provides the latest updates, fundamental and technical gold and silver market analysis, the best articles from last month, and a list of…
 -
Newsletter of the Free Bullion Investment Guide - February 2026
Feb 07, 26 02:12 PM
 The February 2026 newsletter of the Free Bullion Investment Guide provides the latest updates, fundamental and technical gold and silver market analysis, the best articles from last month, and a list…
 -
Newsletter of the Free Bullion Investment Guide - January 2026
Jan 07, 26 04:07 PM
 The January 2026 newsletter of the Free Bullion Investment Guide provides the latest updates, fundamental and technical gold and silver market analysis, the best articles from last month, and a list o…
 -
Newsletter of the Free Bullion Investment Guide - December 2025
Dec 07, 25 04:35 PM
 The December 2025 newsletter of the Free Bullion Investment Guide provides the latest updates, fundamental and technical gold and silver market analysis, the best articles from last month, and a list…
 -
Newsletter of the Free Bullion Investment Guide - November 2025
Nov 08, 25 01:58 PM
 The November 2025 newsletter of the Free Bullion Investment Guide provides the latest updates, fundamental and technical gold and silver market analysis, the best articles from last month, and a list…

18W LED Security Light (Dusk to Dawn & Motion Sensor) - $32.99
from:
 LED Lighting

) (as of March 11, 2011)")
This website is best viewed on a desktop computer.
Keep this Guide Online
& Paypal
Thank You for
Your Support
with Feedly
Search the Guide
| search engine by freefind | advanced |

Give a lasting gift of the iconic Silver Maple Leaf bullion coin [More]
Free Shipping on Orders over $100 (CDN/USA)
The Sovereign 2026 Gold Bullion Coin in Card

Britian's
Royal Mint

Daily
Newsletter
Platinum and Palladium Bullion


Mintages
for
2025
Gold & Silver Mexican Libertad
|
Gold Libertads |


Updated Mintages for
American Gold Buffalo
American Gold Eagle
American Silver Eagle
2024 & 2025
Jerusalem of Gold Bullion
Coin photos
(bottom of page)
 Obverse side")
 Obverse side")
Chinese Gold Coin Group Co.
& Chinese Bullion


Help Us Expand our Audience by forwarding our link
www.free-bullion-investment-guide.com.
Thank You!
Last Month's

In No Particular Order
March 2026
|
US Dollar Demand Soars: Dedollarization Was a Fabrication of the Bull Market - Daniel Lacalle Video: (04:51) WisdomTree CEO Is Going All In on Gold - Jonathan Steinberg, founder and CEO of WisdomTree, tells Barron’s Andy Serwer how gold and metals can be a strong alternative to the dollar and Bitcoin - BARRON'S Are Central Banks Selling Gold? - Gold holdings of Turkey's central bank are down a lot, but Turkey is an outlier in EM - Robin J. Brooks (Substack) Advisors want to bask in gold's warm glow, says Jan van Eck - Investment News (.pdf) Report: Powertrain shifts spark PGM optimism - Metals Focus American Gold Rushes: North Carolina (1799–1849) vs. California (1848–1898) - America’s resource extraction history hinges on two gold rushes with practically paradoxical origins - MINING VISUALS If The World Is On Fire, Why Is Gold Getting Cheaper? - Trefis Banks seize on precious metals trading boom - International Finance Review (IFR) Video Short: FINDING FAKE GOLD BULLION (HAVE YOUR BULLION CHECKED) - Happy Jewelers (YouTube) Gold Update : When the Dollar Wears the Crown Even Gold Steps Aside - The explanation is not that gold has lost its appeal. It simply means the market is still hoarding cash before deciding how to protect purchasing power - The Dark Side of the Boom Report: Beyond “Dr. Copper”: Copper’s Strategic Shift - Sprott What is the IRS loophole for gold? - The IRS loophole could help you save substantially on the taxes tied to your gold assets - CBS News (msn) Bargain Collector: Five-Ounce Silver Quarters, Really? - Numismatic News Report: Silver: The Forgotten Metal That Built Civilizations — 5,000 Years & The $100+ Reckoning - From Mesopotamian shekels to the $100+ supercycle: the complete, unvarnished story of the most undervalued metal on Earth - Capital Street FX Platinum is back. So why are its miners shunning growth? - mining_mx Gold CFDs Vs Silver CFDs (Contract for Difference): Which Metal Is Safer For A Small Account Scalper? - EBC Financial Group (.pdf) Charts: India Monthly Chartbook - March 2026 - Metals Focus More PGM potential for South Africa as Palladium Center returns with major new insight - MINING WEEKLY Item of the Week: Low Mintage Makes 1928 Peace Dollar a Tough Find - With a mintage under 400,000, the 1928 Peace dollar stands as the series’ lowest-production issue—though its true scarcity comes with the complexities of silver dollar history. - Numismatic News RANKED: Top 10 gold mining companies of 2025 - MINING.COM Info~Graphic: Mapped: Top Marginal Income Tax Rates by State in 2026 - Visual Capitalist |
|
All Articles were Originally Posted on the Homepage Gold Nanoparticle Cancer ResearchThe Role of Gold in Technology: 5 High-Tech Uses - Securities.io Synthesis Strategies, Therapeutic Roles, and Clinical Progress of Gold Nanoparticles in Biomedical Engineering - Nano Select Optimizing gold nanoparticles for better medical imaging, drug delivery, and cancer therapy - PHYS.org (msn) One-hour saliva test spots biomarker linked to several cancers - Medical Express (msn) Korean researchers unveil rapid diagnostic test for pancreatic cancer - Korea Joongang Daily |
All Articles were Originally Posted on the Homepage