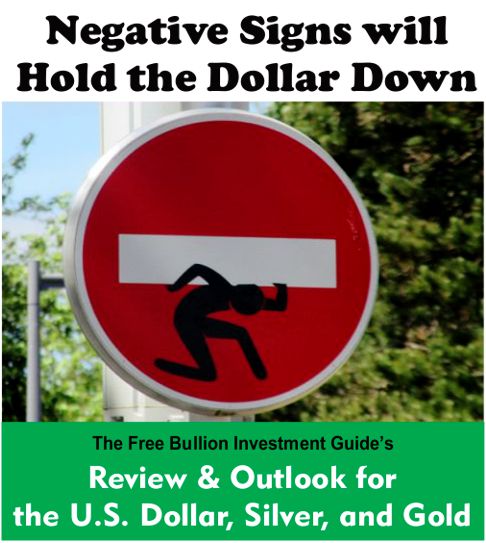
Negative Signs will
Hold the Dollar Down
Review and Outlook for the U.S. Dollar, Silver, and Gold
Originally Posted on 3/04/2018 @ 4:42 pm
by Steven Warrenfeltz
Subscribe to this Blog
Hello,
Before we get to this Review & Outlook, below are some of the Best Bullion Market-Related News articles that were taken from this guide's home page, over the past few weeks.

What The Climbing Debt Defaults Really Mean For The Economy - PYMNTS
From Copper to Gold, Metals Gaining Upper Hand vs. Stock market - Bloomberg Professional
Total U.S. Debt and Gold - GoldSeek
Inflation's Back and Commodities Will Benefit, JPMorgan Says - Bloomberg
Russia's central bank gold hoard is now bigger than China's - MINING
U.S. Debt: Financial Markets Wake Up - The Gail Foster Group
Who Is It That Wants to Buy Trillions of US Treasury's??? - Econimica
Platinum price crashes through $1,000 after German diesel ban - MINING
A Shocking Number of Americans Now Owe at Least $50,000 in Student Debt—and Many Aren't Paying It Down - Money
Best of the Week for
Gold NanoParticle Cancer Research
Gold Nanoparticle Cancer Research News #5 - Free Bullion Investment Guide
New method uses light and gold nanoparticles for highly targeted, non-invasive drug delivery - PHYS.org
Why Gold Nanoparticles Offer a Bright Future for Diagnostics and Healthcare - Technology Networks
photo provided courtesy of pixabay.com
This guide's last blog post, seen here, was about how the U.S. Dollar fell below the $91.00 price level which was a three-year-old, critical support level,
However, even though this was bad news for the dollar, all of the chart patterns for the dollar in that blog post were positive.
But now that those positive patterns have been validated and confirmed, the dollar's future isn't looking bright, which should be good news for gold and silver.
In the charts below, you will see why the title of this blog is Negative Signs will Hold the Dollar Down.
Review & Outlook
|
All the charts on this blog are Daily Charts unless noted otherwise.
US DOLLAR
In Review - 2 weeks ago
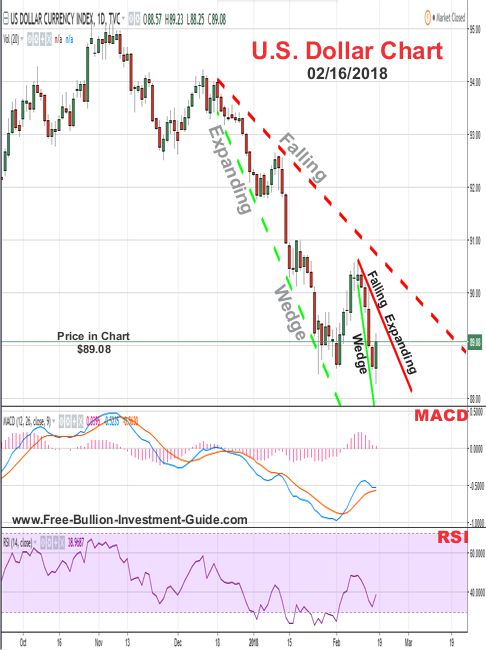
Two weeks ago, I wrote the following outlook for the U.S. Dollar and posted the chart below.
In the outlook chart below, the 'Falling Expanding Wedge' is still intact, but, I have faded its labeling and dotted its trend-lines because the positive pattern may not play-out as expected, but that scenario is doubtful.
The dollar should confirm or deny the pattern sometime in the future, the question is; When?
But now, a new 'Falling Expanding Wedge' has formed in the dollar's chart.
The new positive wedge pattern is steep and narrow, so barring any unexpected news, the dollar should confirm it sometime in the near future.
However, the dollar's MACD and RSI are giving very little indication as to which way the dollar will move, so perhaps the dollar will break the new pattern soon, or it may continue its fall inside this new pattern like it did the older one, time will tell.
In Review continued
Last Sunday I wrote the following at the top of this guide's main blog page:
2/25/2018:
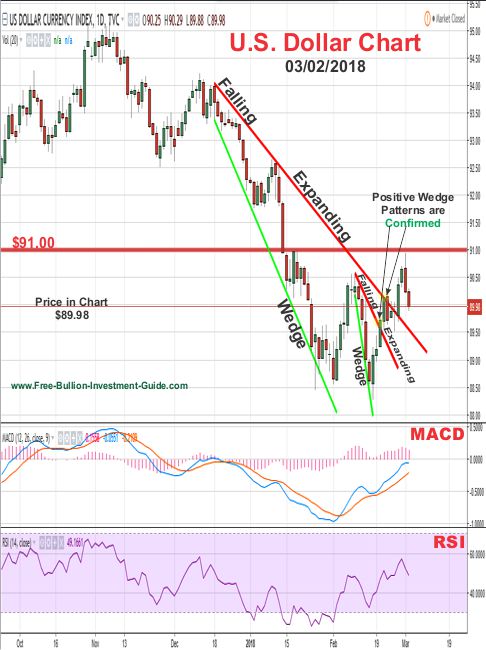
All of the chart patterns in this guide's last blog post titled: 'The Dollar Breaks a Critical Support Level' have been been broken and confirmed.
However, no new patterns have formed in the U.S. Dollar, Gold or Silver charts which is why there is no post this weekend.
In the chart below, you can see that both of the Falling Expanding Wedges were validated and confirmed several days ago.
Now, new patterns have formed in the U.S. Dollar's charts and I will show you what they are in the outlook section below.
U.S. Dollar - Outlook
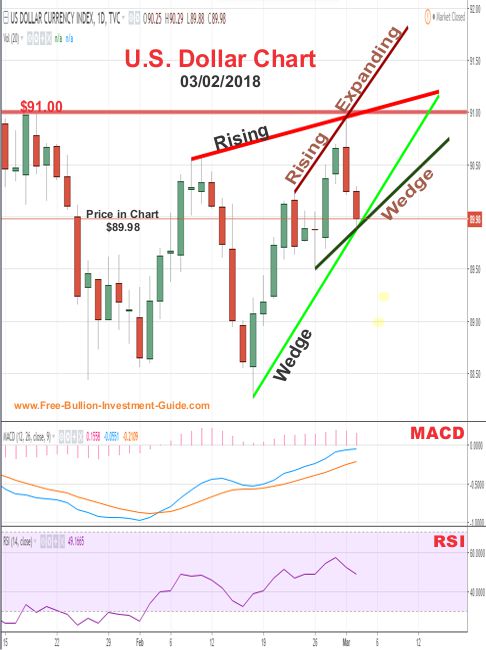
In the outlook chart below, I have identified two of the most prominent negative signs a.k.a wedge patterns in the U.S. Dollar's chart.
In all honesty, I found two other negative patterns in the U.S. Dollar's chart, but one was simply like adding gas to a fire in regards to the rising wedges and the other is only implied, we'll have to see how the dollar's price moves in the days and weeks to come, before I can identify that pattern in the charts.
Plus, had I added that other wedge it would have made the chart below cluttered and hard to read, if it isn't already.
Anyways, getting back to the outlook for the U.S. Dollar, two negative 'Wedges' have been identified in the chart.
Currently, the price of the dollar is literally sitting on the bottom trend-line of both wedges, which means they could be confirmed in the next day or two.
However, the 'Rising Wedge' in 'black letters' is the dominate wedge, so the price of the U.S. Dollar could bounce back up and trade inside it for a few days before the weight of the $91.00 resistance level helps to push the dollar below the trend-lines of the wedges, confirming them.
Charts provided courtesy of TradingView.com
U.S. Dollar's Price Resistance and Support Levels
U.S. Dollar's Resistance Levels
$91.00
$89.50
U.S. Dollar's Support Levels
$88.00
$87.00
SILVER
In Review
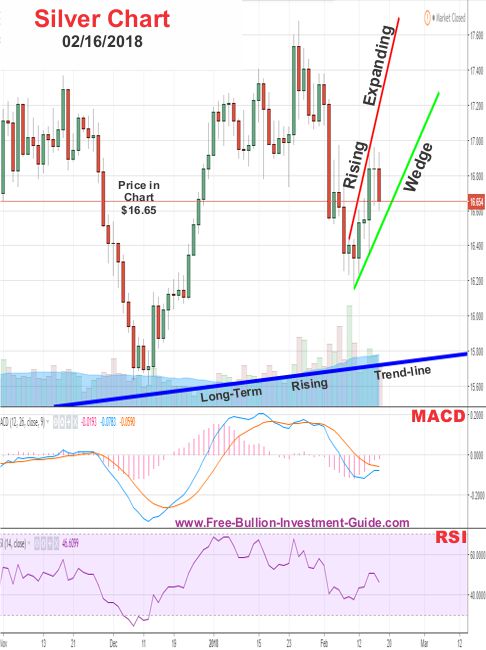
Two weeks ago, the following commentary and the chart below it, was posted for silver's outlook.
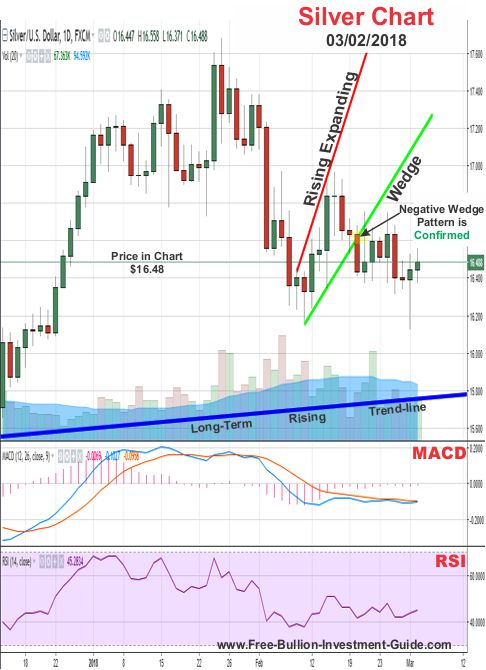
For the week to come, silver has formed a Rising Expanding Wedge.
As the chart suggests, silver's price could confirm the negative wedge pattern very soon, or we could see the price of silver bounce around inside the pattern before it confirms it.
Either way, as the negative pattern suggests, a dip in silver's price should happen sometime in its short-term trade.
In Review - continued
In the review chart below, you can see that the price of silver did confirm the 'Rising Wedge Pattern' a few days after the last blog post was published.
Silver - Outlook
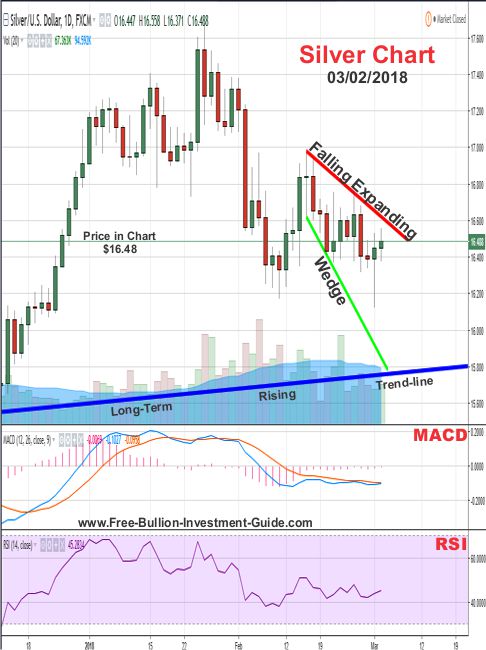
In silver's outlook chart below, a positive 'Falling Expanding Wedge' has formed.
Silver's candlestick chart and its RSI (lower indicator) are showing that silver's price is possibly going to continue to move up.
However, its MACD is giving no indication as to which way it will move and the price of silver has been very volatile, so we could see the price move in either direction in the days and weeks to come before it confirms the pattern.
One thing to know is that the Federal Reserve won't be making a decision on interest rates until March 21st, so until then, we can pretty much expect to see silver move up or down with a lot of volatility.
Charts provided courtesy of TradingView.com
Silver's Price Resistance &
Support Levels
Silver's Resistance Levels
$17.50
$17.00
Silver's Support Levels
$16.15
$16.00
GOLD
In Review
Below, is what was written in the gold outlook from two weeks ago and its corresponding gold chart is below it.
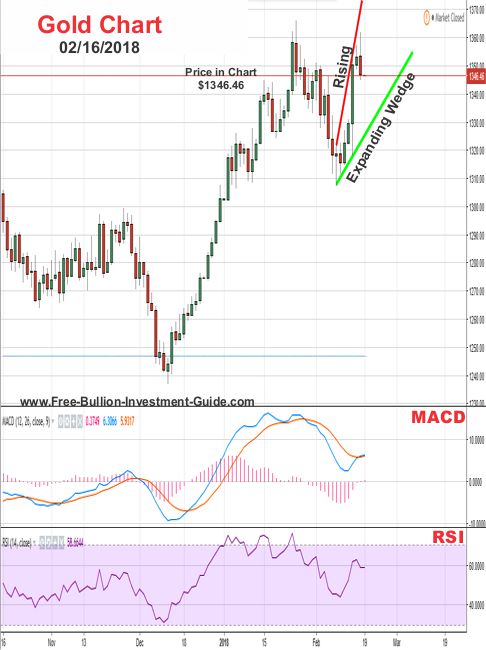
Like silver, gold has also formed a 'Rising Expanding Wedge,' it's a little broader than silver's wedge, so it isn't expected to confirm it as soon as silver is expected to confirm its negative wedge.
In addition, much like the dollar's MACD and RSI, gold's lower indicators are offering very little indication as to which way the price of gold will move in the near future.
So, for the next week or two, we should see gold's price move inside the negative wedge, before it confirms it.
In Review - continued
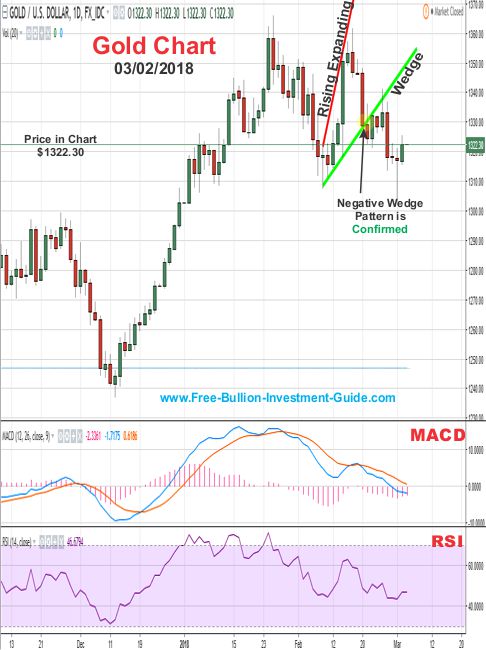
If you compare the chart above with the chart below you can see that although the pattern was confirmed, I was wrong about how gold would trade inside the wedge.
The price of gold broke the 'Rising Expanding Wedge' two days after the gold outlook chart was posted, much earlier than I stated.
Gold - Outlook
In gold's outlook chart below, you can see that like silver, gold has formed a 'Falling Expanding Wedge.'
The wedge is a positive pattern, and like silver's pattern, gold's price is currently trading near the upper trend-line of the wedge.
In addition, gold's MACD and RSI are giving a slight indication that more of a rebound could be in its near future.
In regards to the news, its hard to say which way gold will move, however the biggest thing to remember about gold is; "Uncertainty is its Best Friend."
Time will tell how soon gold will confirm its positive 'Rising Expanding Wedge.'
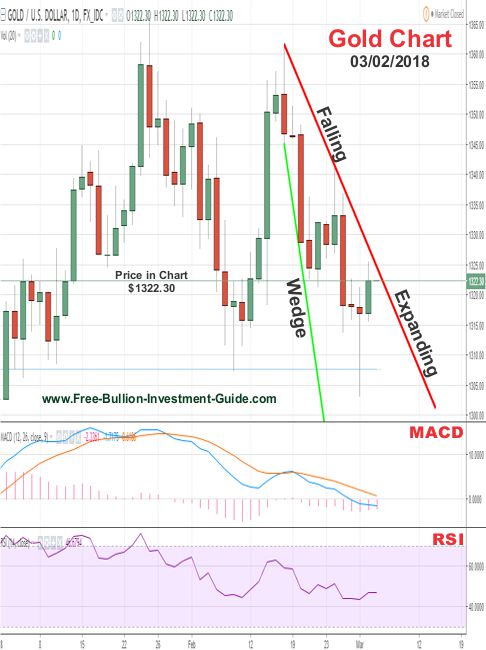
Charts provided courtesy of TradingView.com
Gold's Price Resistance and
Support Levels
Gold's Resistance Levels
$1380.00
$1350.00
Gold's Support Levels
$1300.00
$1280.00
Thank You for Your Time.
Have a Great Week and God Bless,
Steve
'Click Here' see all of the prior Blog posts,
Thank You for Your Time!
|
Investment/Information Disclaimer: All content provided by the Free-Bullion-Investment-Guide.com is for informational purposes only. The comments on this blog should not be construed in any manner whatsoever as recommendations to buy or sell any asset(s) or any other financial instrument at any time. The Free-Bullion-Investment-Guide.com is not liable for any losses, injuries, or damages from the display or use of this information. These terms and conditions of use are subject to change at anytime and without notice. |
Return from this Guide's Latest Blog Post
|
Support this Guide & Paypal Thank You for Your Support |
|
|
 | |||||
This website is best viewed on a desktop computer.
Keep this Guide Online
& Paypal
Thank You for
Your Support
with Feedly
Search the Guide
| search engine by freefind | advanced |
Premium Canadian Bullion
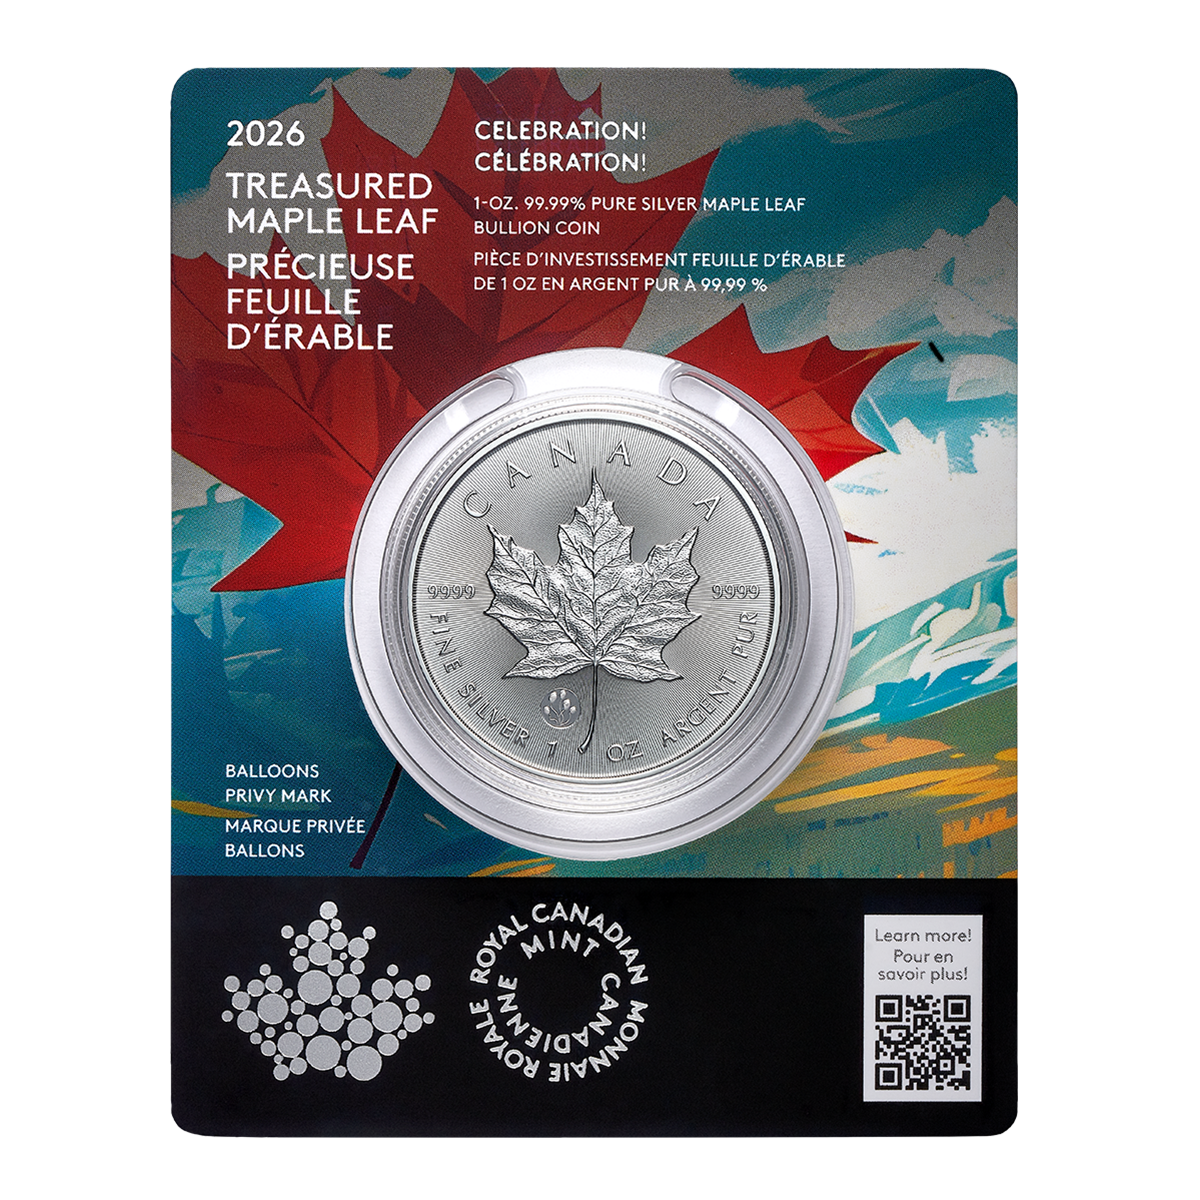
Give a lasting gift of the iconic Silver Maple Leaf bullion coin [More]
Free Shipping on Orders over $100 (CDN/USA)
or
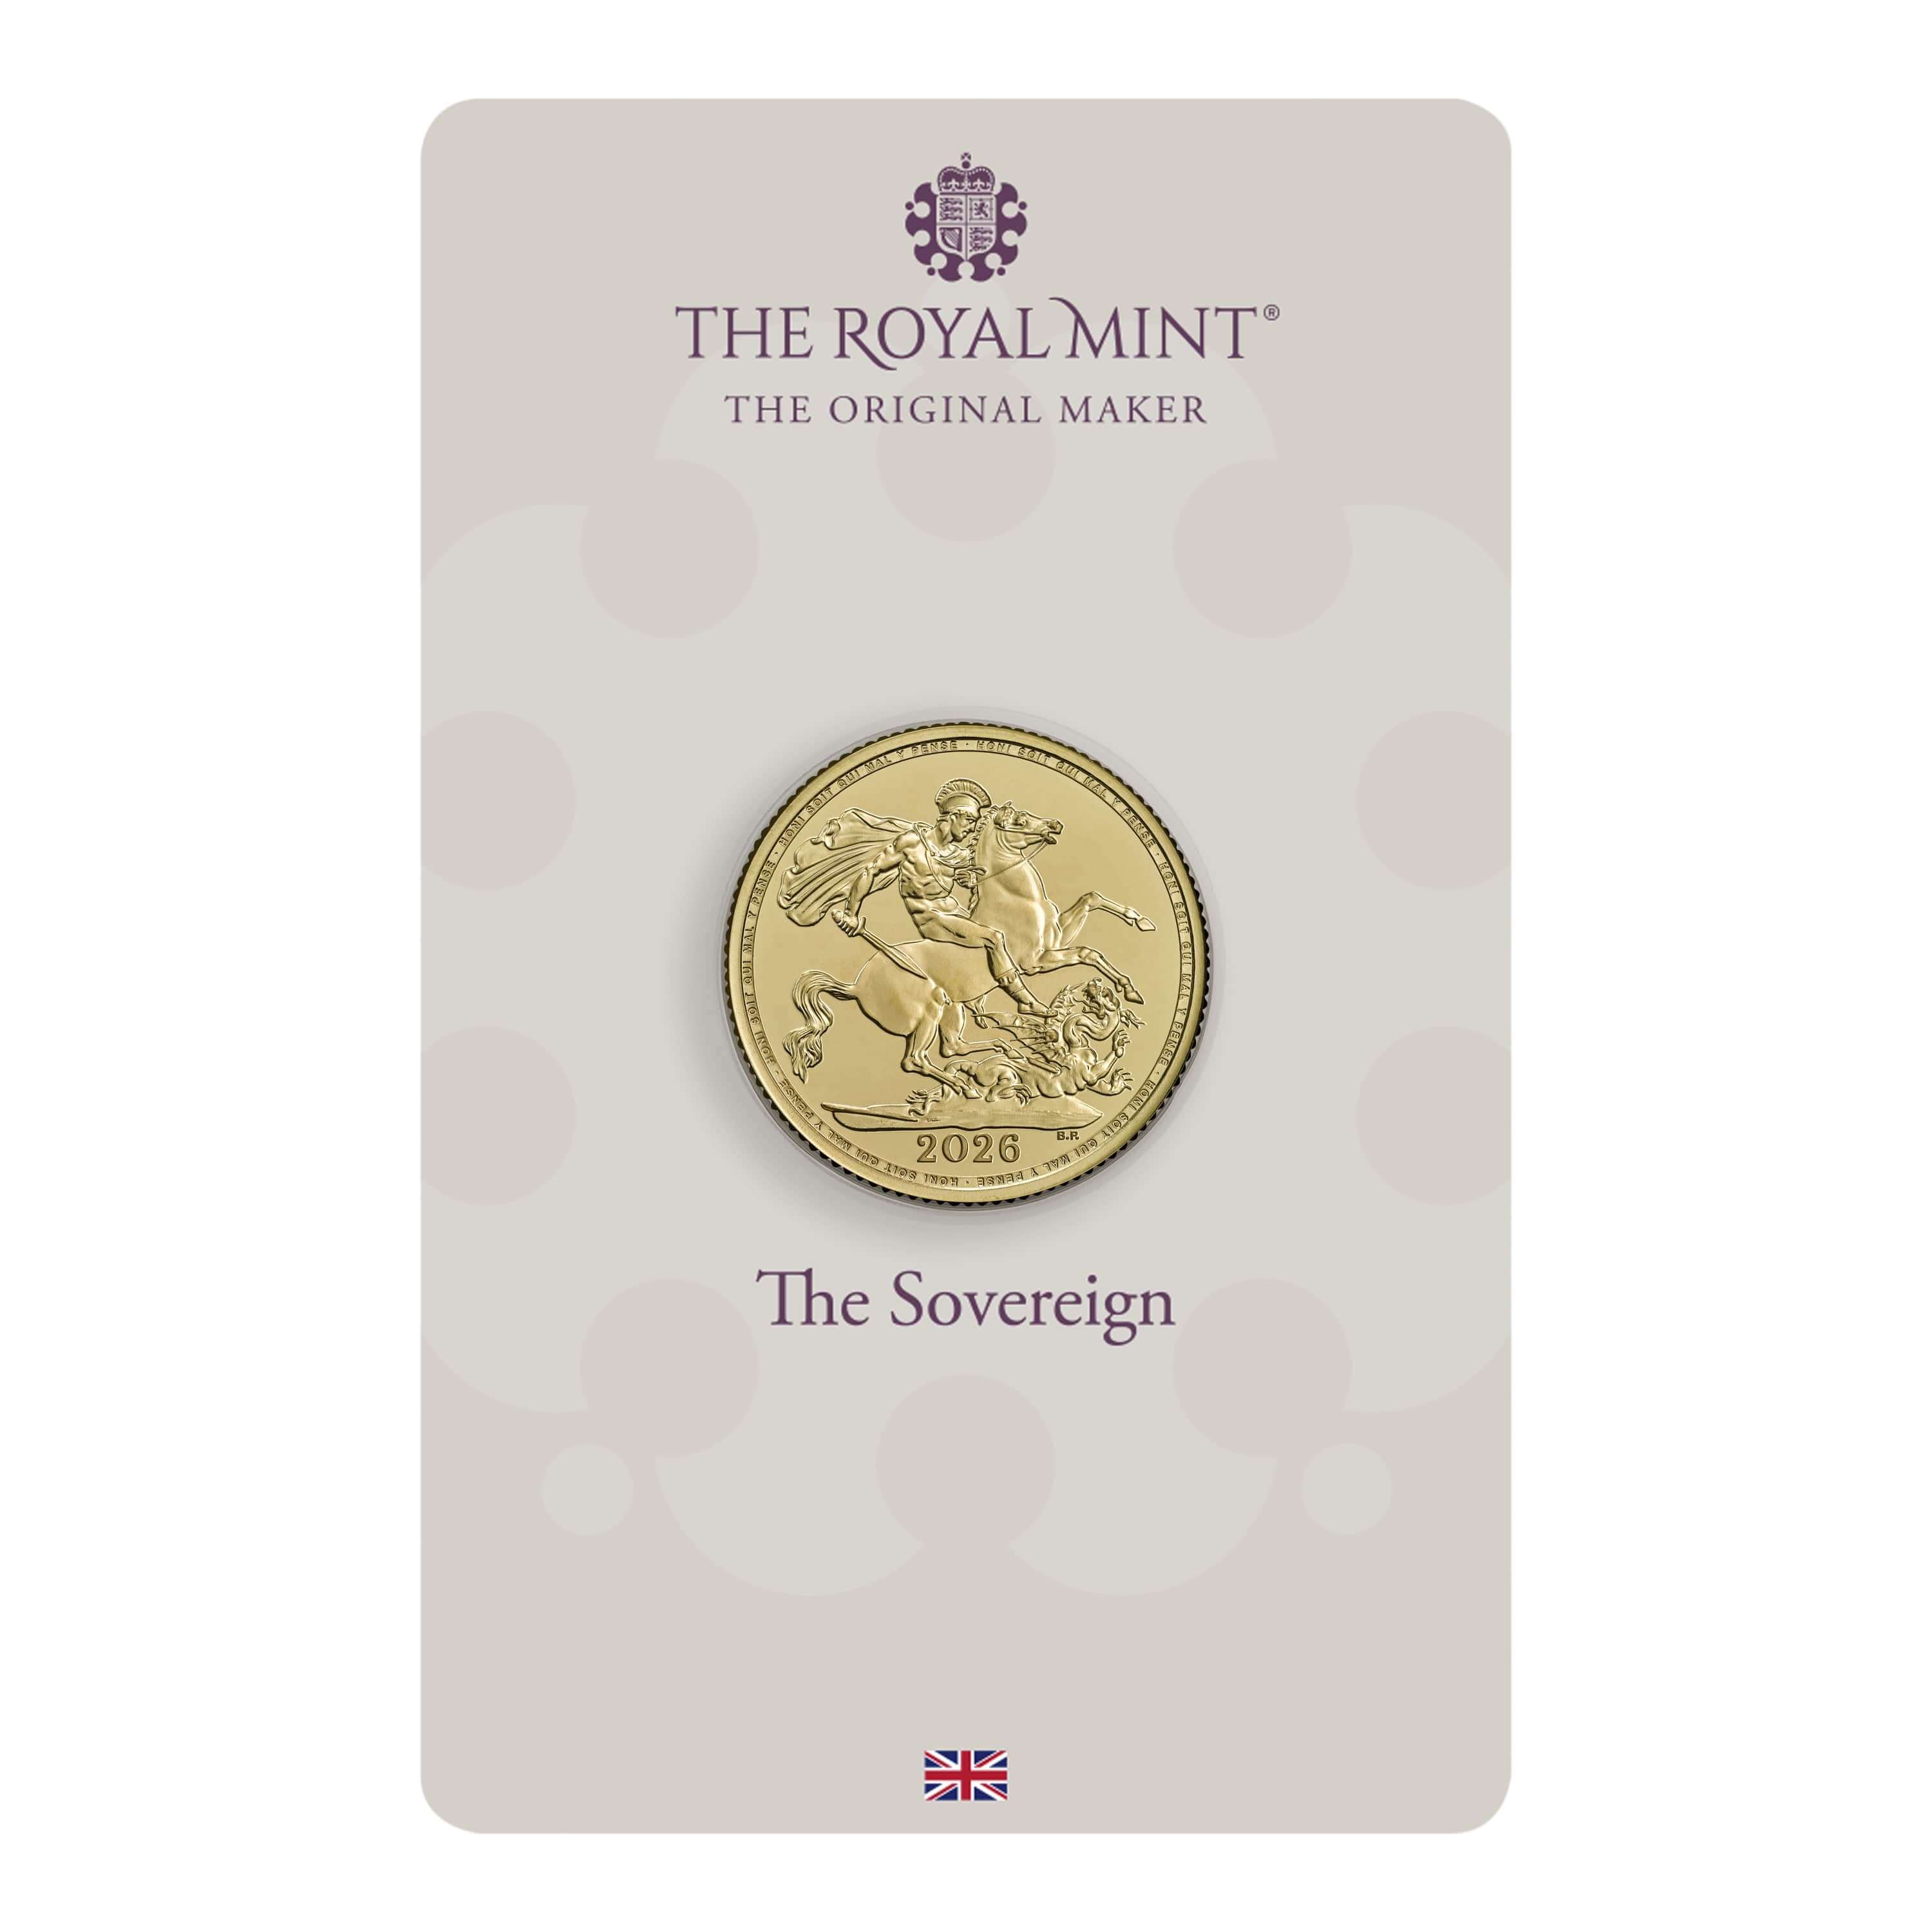
From the U.K. Royal Mint

Daily
Newsletter
Updated Mintages for
American Gold Buffalo
American Gold Eagle
American Silver Eagle
2024 & 2025
Jerusalem of Gold Bullion
Coin photos
(bottom of page)
Mintages
for
2024
Gold & Silver Mexican Libertad
|
Gold Libertads |
Chinese Gold Coin Group Co.
& Chinese Bullion
Help Us Expand our Audience by forwarding our link
www.free-bullion-investment-guide.com.
Thank You!
Last Month's

In No Particular Order
January 2026
All Articles were Originally Posted on the Homepage
