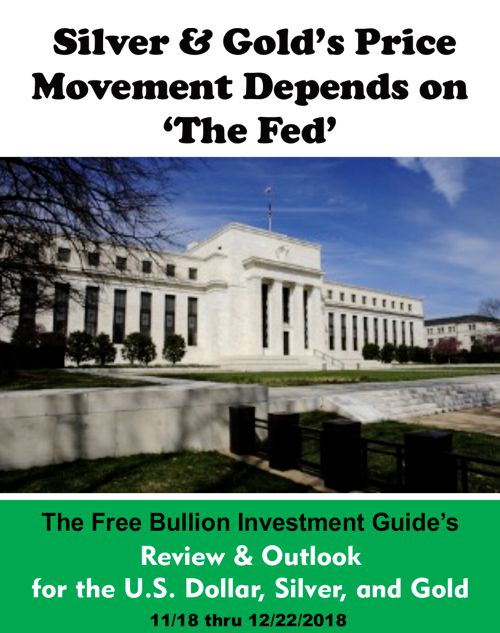
Silver and Gold's
Price Movement
Depends on
'The Fed'
'Review & Outlook'
for the U.S. Dollar, Silver, and Gold
Originally Posted on 12/09/2018 @ 6:12 pm EST
Last Updated on 12/12/2018 @ 10:55 am EST
by Steven Warrenfeltz
Subscribe to this Blog
Hello,
Thank you for visiting the Free-Bullion-Investment-Guide, every visit you make is greatly appreciated.
Before we get to this Review & Outlook, below are some of the Best Bullion Market-Related News articles that were taken from this guide's home page, over the last several weeks.

Doug Casey on Why Gold Is Money - Casey Research
A star economist is touting 4 charts that show the Fed isn't as dovish as everyone thinks - Business Insider
CHARTS: Household Debt And Credit Report: Up $219B in Q3 - Advisor Perspectives
Is It Time to Hold Gold? - BARRON'S
Fed Chairman Powell now sees current interest rate level ‘just below’ neutral - CNBC
Investors Are Going to Get Scalped - Bonner & Partners
Ray Dalio’s Faith in Gold Is Unshaken - Bloomberg
Platinum demand to increase in 2019 - Mining Review
Which Yield Curve Really Matters? - RIA
Why I am not a gold bug - Numismatic News
Banker admits gold price manipulation - LawrieOnGold
pdf: Interim Silver Market Review - Silver Industrial Demand Remains Strong – Surplus Expected for 2018 - Silver Institute
The U.S. National Debt Spiral Has Begun: How This Will End - INVESTOR'S BUSINESS DAILY
Misdiagnosing The Risk Of Margin Debt - RIA
Best of the Week for
Gold NanoParticle Cancer Research
Q and A with a Pioneer in Medical Science... Naomi J. Halas Ph.D - Free Bullion Investment Guide
Scientists develop 10-minute universal cancer test - The Guardian
Using Gold to Track down Diseases - Science and Technology Research News
Last week, I posted following statement at the top of this guide's main 'Blog page.'
|
Most of the Patterns in the Latest Blog Post titled: "A Bearish Pattern has Formed in Silver and Gold's Charts" are still Relevant. Silver briefly broke below its bearish pattern, but it moved back up into it and is trading back inside it again. If Interest rates are raised, gold and silver will likely move down. |
The news on Friday (12/07) was that the Jobs Report wasn't as good as expected because only 155,000 new jobs were created in November 2018, however, the unemployment rate is still unchanged at 3.7%.
In regards to what I wrote last weekend on the top of the 'blog page,' even though, the Jobs Report wasn't as good as expected it was still decent and wages are still growing, which is an inflationary signal.
Therefore, like the individual who wrote the IBD article above, I'm expecting the Federal Reserve to raise rates on December 19th.
Furthermore, I base this not only on the latest Jobs Report but also on on other factors.
Since 2015, the Federal Reserve has not missed a December Interest Rate hike, plus just recently the Federal Reserve Chairman, Jerome Powell, stated that Interest Rates are 'just below' neutral, not 'at' neutral.
Another variable that few seem to take into account before a December rate hike is that nearly all 'traders' will be on Christmas/New Year Vacation after Dec. 21st.
So, the big money managers will not be moving the markets so much after the rate hike, the market will have a good two weeks to digest the next rate hike before it starts trading its impacts on the economy.
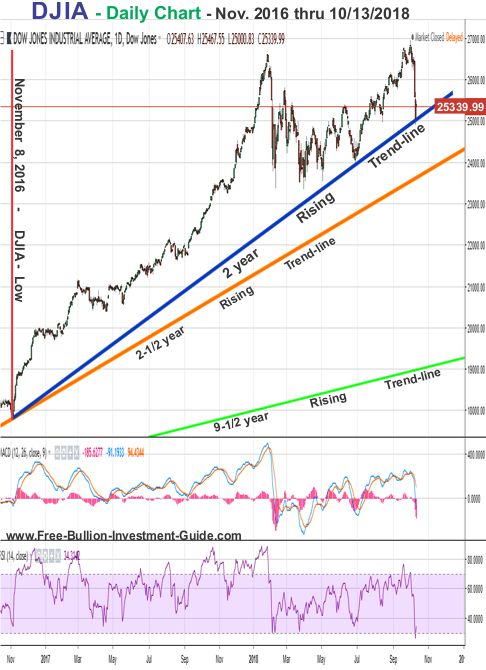
In addition, despite the fact that we are currently some seeing downward pressure on the financial markets, in a blog post from October (seen here), the following DJIA chart (below), showed the rising trend-lines to watch as the market to falls.
As you can see in the next DJIA chart, even though there has been a ton of volatility in the markets, that's been mostly due to the recent Mid-Term Election and the Trade War with China, we are still above the 2-1/2 year rising trend-line, and well above the 9-year rising trend-line, that dates back to the financial crisis of 2008.
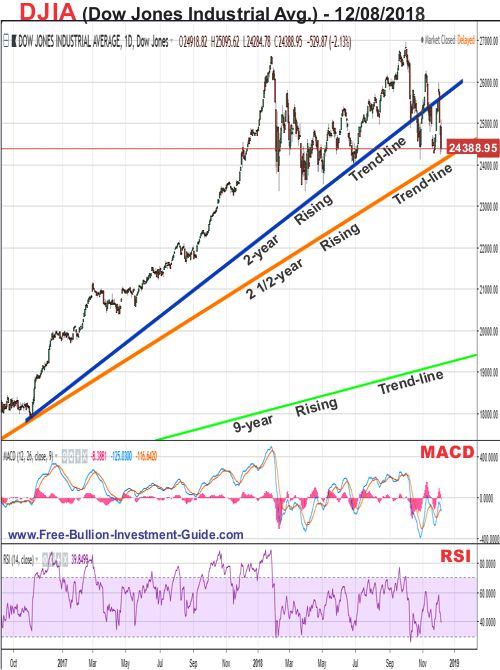
What the market doesn't like is that through interest rate hikes, the Federal Reserve is trying to tame it.
I will be surprised if they don't tame the market too much before the bottom falls out of it, but time will be the judge of that.
My prediction is that 'The Fed' will raise interest rates another quarter of a percent on December 19th, and ultimately Gold and Silver will likely be affected negatively from it.
Review & Outlook
|
All the charts on this blog are Daily Charts unless noted otherwise.
US DOLLAR
In Review
In each of the 'In Review' sections of this blog, it analyzes the last blog post's outlook. Below is the commentary and chart from the last blog's outlook for the U.S. Dollar.
The last blog post was titled 'A Bearish Pattern has Formed in Silver and Gold's Charts'
|
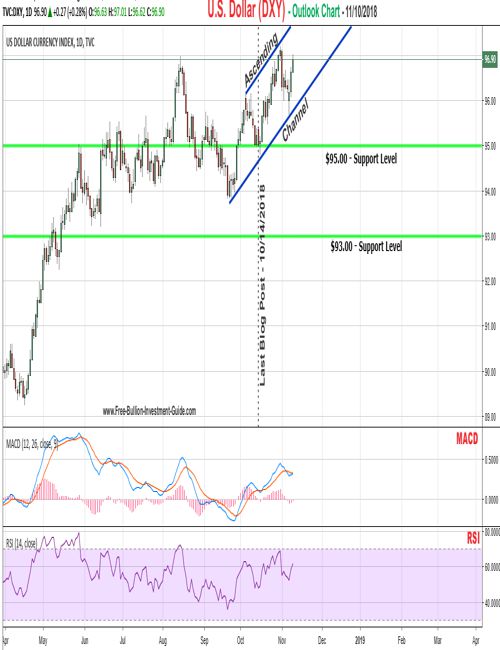
In the U.S. Dollar's outlook chart below, you can see that the dollar is currently trading inside a narrow 'Ascending Channel.' |
U.S. Dollar - In Review - continued
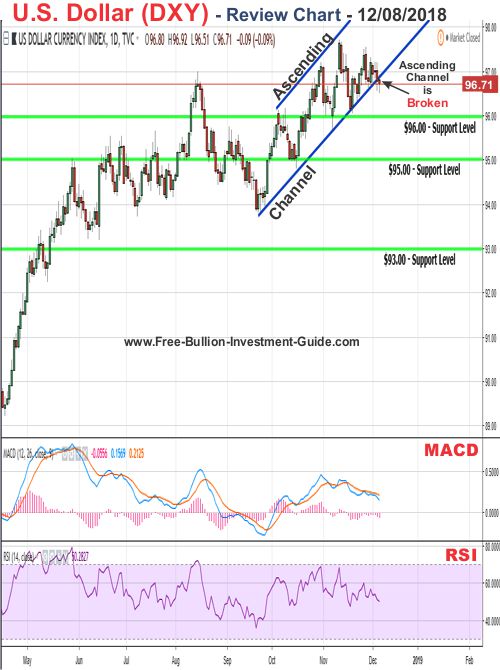
By comparing the U.S. Dollar's 'Outlook' chart below from last month with this week's 'Review' chart, you can see that the dollar did rise in the Ascending Channel.
However, as volatility in the markets climbs, the Federal Reserve has been trying to calm it by stating that it is "just below" neutral on interest rates, which has, in turn, helped the dollar fall below the channel, breaking it.
U.S. Dollar - Outlook
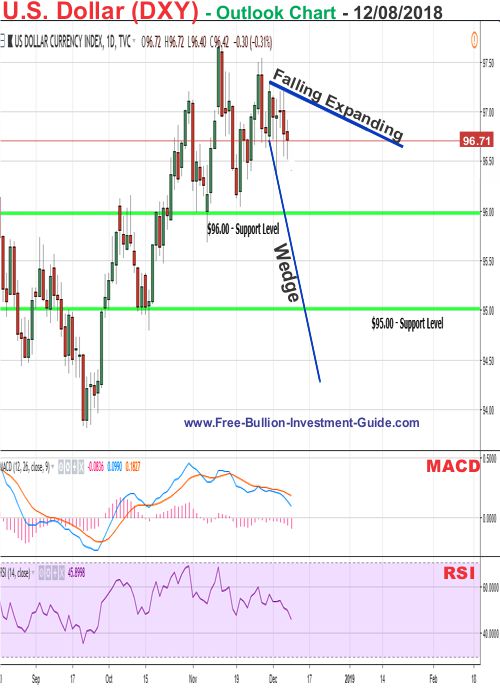
The dollar's been moving mostly sideways for the last few weeks, without much of a direction as to which way it will move.
Traders can't seem to make up their mind on what they want to do until after the Federal Reserve meeting.
The U.S. Dollar has formed a broad 'Falling Expanding Wedge' which it is expected to trade inside until after the Federal Reserve has announced what it will do in regards to Interest Rates on December, 19th.
The pattern is a positive pattern, so the dollar is expected to rise above it sometime in the near future, most likely, the pattern will either be confirmed or denied after the FOMC meeting.
Charts provided courtesy of this Guide's Affiliate - TradingView.com
U.S. Dollar's Price Resistance and Support Levels
U.S. Dollar's Resistance Levels
$98.00
$97.00
U.S. Dollar's Support Levels
$96.00
$95.00
Free Shipping on Orders $199+
SILVER
In Review
In the last blog post titled; 'A Bearish Pattern has Formed in Silver and Gold's Charts' the outlook commentary and chart below was posted for silver.
|
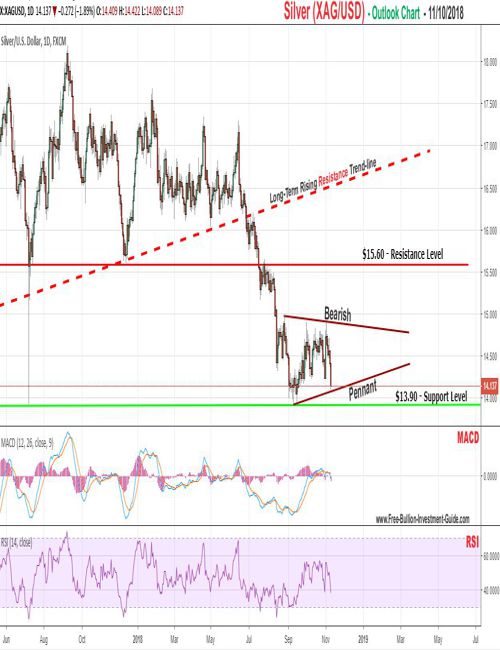
In silver's outlook chart below, you can see the 'Bearish Pattern' that has formed in its chart. |
Silver - Review - continued
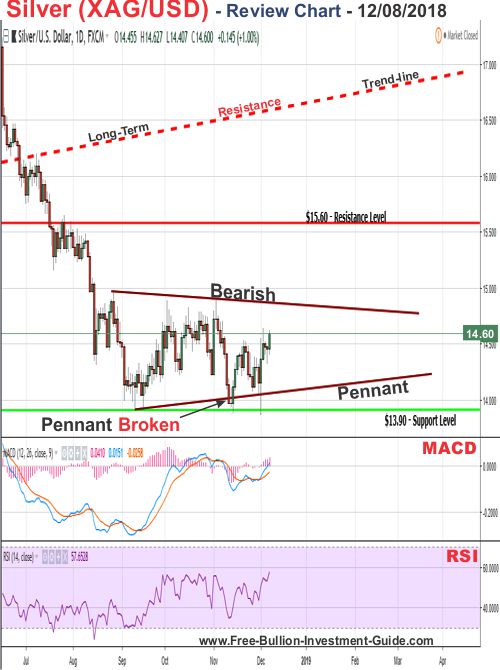
In this week's silver review chart, below, you can see that the price of silver did break below the bearish pennant and after it broke the bearish pattern it found support at the $13.90 price level and has bounced back up inside the pattern.
(The two sentences below were added on 12/12/2018 @ 10:55 am EST)
Technically, a bearish pennant is confirmed when the asset price that is trading inside it, breaks below it and continues to move down after it breaks the bottom trend-line of the negative pattern.
That did not happen in the silver chart below, therefore, even though what was stated in the last outlook happened (as shown in the previous commentary), the 'Bearish Pattern' technically was only 'broken,' not confirmed.
|
"So silver's outlook is for it to confirm the 'Bearish Pennant' in the next week or so, but it should find support between the $13.90 to $13.60 price levels." |
Silver - Outlook
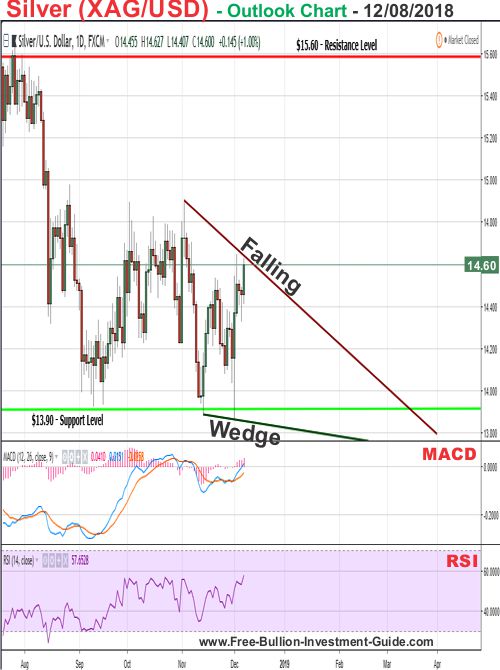
In Silver Outlook chart below, it has formed a 'Falling Wedge' pattern.
The pattern is a positive pattern, so it is expected to break it to the upside, this will likely happen before the Federal Reserve meeting on December 19th.
In all honesty, silver looks like it could break it in the next day or two, which it could, but whenever it breaks it and confirms the pattern, the overall expectation of silver at this time is for it to continue to test the $13.90 support level (shown) and the $13.60 support level (not shown).
Charts provided courtesy of TradingView.com
Silver's Price Resistance &
Support Levels
Silver's Resistance Levels
$15.60
$15.00
Silver's Support Levels
$13.90
$13.60
GOLD
In Review
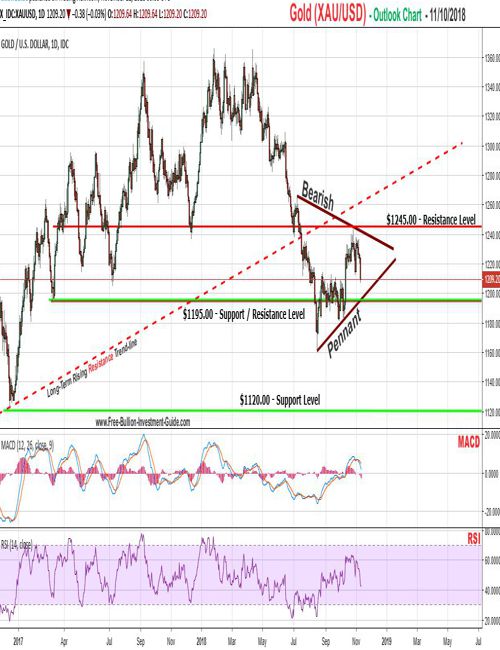
The following chart and commentary was posted in gold's last outlook.
|
In gold's outlook chart below, you can see that like silver, it has also formed a 'Bearish Pennant.' |
Gold - Review - continued
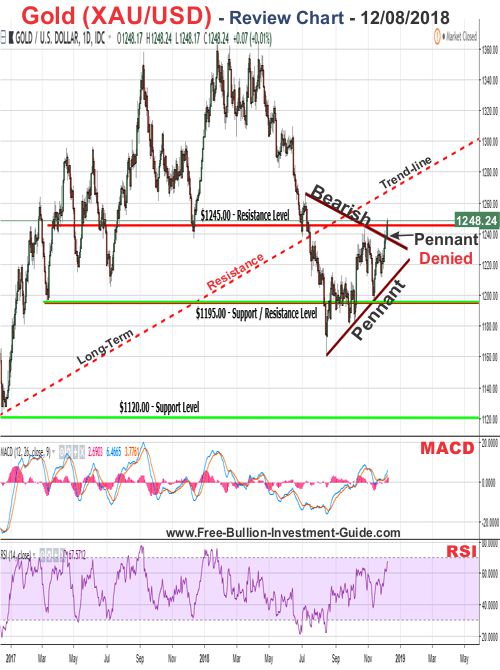
In the gold's review chart below, you can see that the 'Bearish Pennant' was denied when it broke to the upside.
Most of the reason for this action has been in regards to the increased feeling among traders that the Federal Reserve may not raise rates at its next meeting, and the possibility of an escalating Trade War with China.
Gold - Outlook
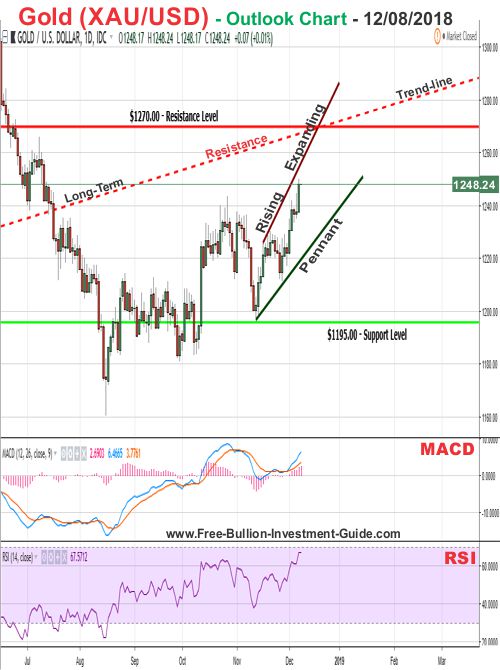
In Gold's 'Outlook' chart below, a negative 'Rising Expanding Wedge' has formed.
How long gold trades inside the negative pattern is unknown, most likely up until the Federal Reserve's meeting on December 19th, before confirms the pattern to the downside.
Charts provided courtesy of TradingView.com
Gold's Price Resistance and
Support Levels
Gold's Resistance Levels
$1270.00
Gold's Support Levels
$1195.00
$1120.00
$1045.00
Thank You for Your Time.
Take Care & God Bless,
Steve
|
Investment/Information Disclaimer: All content provided by the Free-Bullion-Investment-Guide.com is for informational purposes only. The comments on this blog should not be construed in any manner whatsoever as recommendations to buy or sell any asset(s) or any other financial instrument at any time. The Free-Bullion-Investment-Guide.com is not liable for any losses, injuries, or damages from the display or use of this information. These terms and conditions of use are subject to change at anytime and without notice. |
'Click Here' see all of the prior Blog posts,
Thank You for Your Time!
Return from this Guide's Latest Blog Post
|
Support this Guide & Paypal Thank You for Your Support |
|
|
 | |||||
This website is best viewed on a desktop computer.
Keep this Guide Online
& Paypal
Thank You for
Your Support
with Feedly
Search the Guide
| search engine by freefind | advanced |
Premium Canadian Bullion
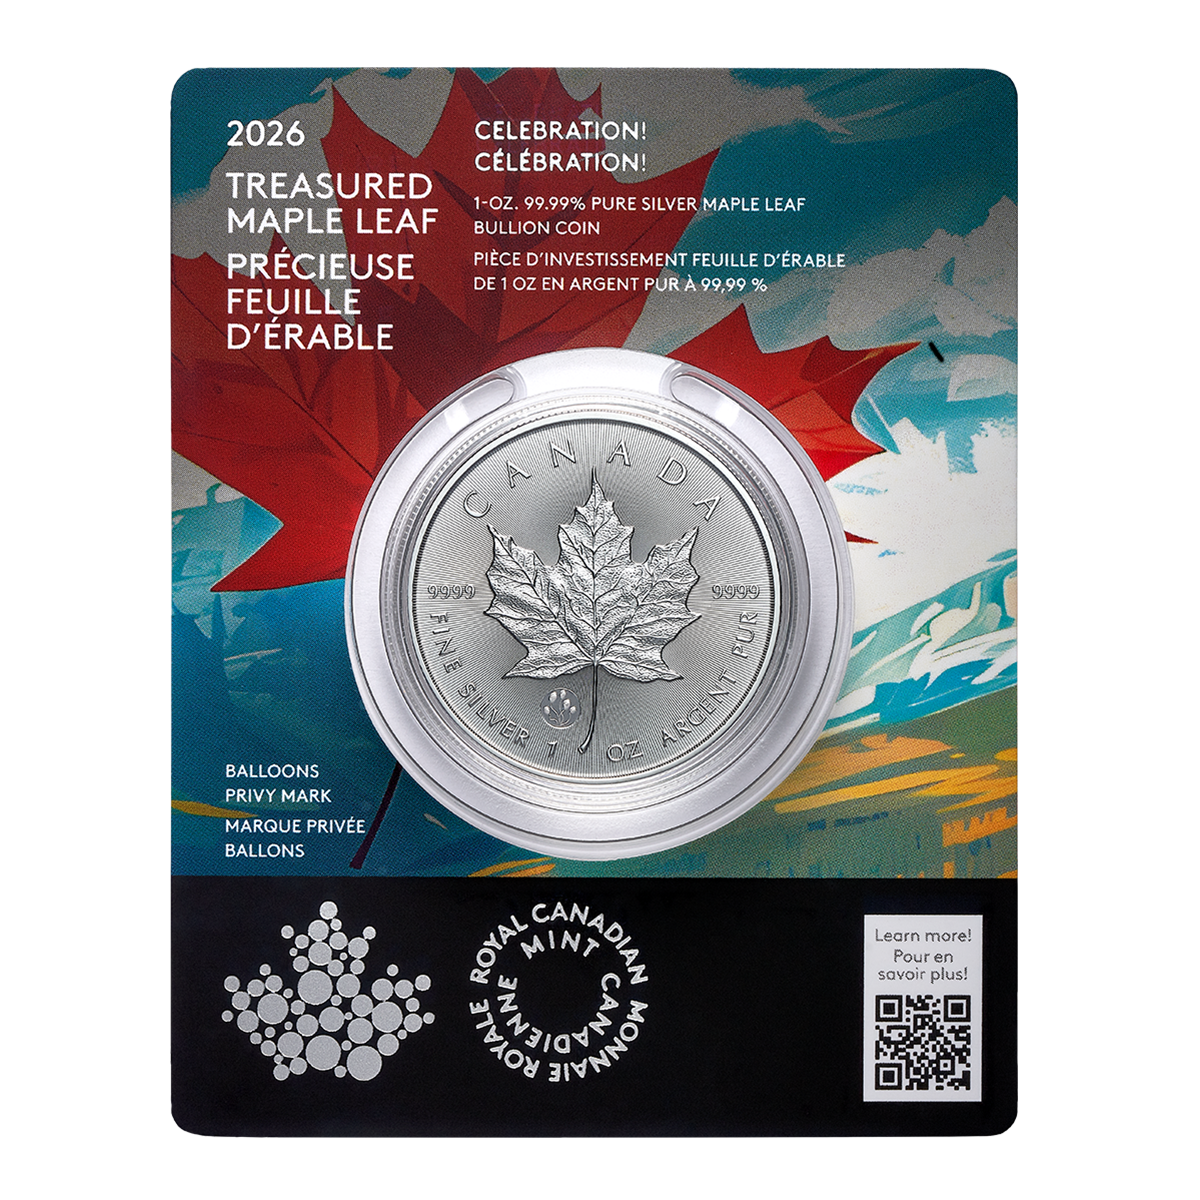
Give a lasting gift of the iconic Silver Maple Leaf bullion coin [More]
Free Shipping on Orders over $100 (CDN/USA)
or
From the U.K. Royal Mint

Daily
Newsletter
Updated Mintages for
American Gold Buffalo
American Gold Eagle
American Silver Eagle
2024 & 2025
Jerusalem of Gold Bullion
Coin photos
(bottom of page)
Mintages
for
2024
Gold & Silver Mexican Libertad
|
Gold Libertads |
Chinese Gold Coin Group Co.
& Chinese Bullion
Help Us Expand our Audience by forwarding our link
www.free-bullion-investment-guide.com.
Thank You!
Last Month's

In No Particular Order
January 2026
All Articles were Originally Posted on the Homepage
