A Large Bull Flag is
in Gold's Chart
Review and Outlook for the U.S. Dollar, Silver, and Gold
Originally Posted on 4/08/2018 @ 3:48 pm
Last Edited on 4/08/2018 @ 8:30 pm
by Steven Warrenfeltz
Subscribe to this Blog
Hello,
Thank you for visiting the Free-Bullion-Investment-Guide, every visit you make is greatly appreciated.
Before we get to this Review & Outlook, below are some of the Best Bullion Market-Related News articles that were taken from this guide's home page, over the last week.

VIDEO: Bond King Gundlach sees an unusual trend in gold. Here’s why it could soon end - CNBC
Californians Doing The Once-Unthinkable: Leaving California - Investor's Business Daily
Tale of two coin markets continues - Numismatic News
CHARTS: Margin Debt and the Market - Advisor Perspectives
Coin Finds: Bag of half dollars yields silver - Numismatic News
21 Trillion Reasons to Own Gold - Sunshine Profits
Best of the Week for
Gold NanoParticle Cancer Research
Concordia Researchers Investigate Ancient Indian Treatment - The LINK
Hybrid Magnetic Gold Nanoparticles Effective in Colorectal Cancer Treatment - RSNA
Review & Outlook
|
All the charts on this blog are Daily Charts unless noted otherwise.
US DOLLAR
In Review
Last week, I wrote the following outlook for the U.S. Dollar and posted the chart below.
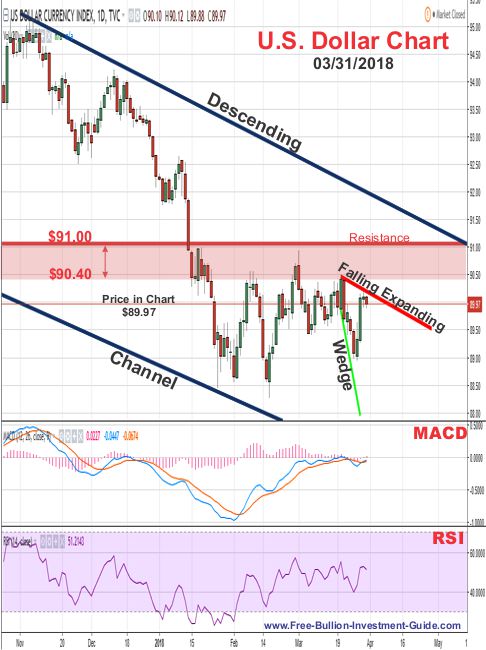
In the dollar's outlook chart below, it has created a 'Falling Expanding Wedge.'
The pattern is very broad, and even though the dollar looks like it may break it in a day or two, it could easily trade inside the wedge for a week or more.
The biggest reason why I state this has to deal with all the wavering news reports about a trade war.
If a 'Trade War' does materialize between the U.S. and China, it will hurt the dollar, but the news from last week was optimistic, stating that negotiation were set to begin, which is why the dollar rose in price.
Currently, most of the strength in the dollar hangs in the fate of these negotiations and what we hear in the news about them.
So, we're kind of in 'limbo' right now as to how the dollar will move, however, when the dollar does confirm the positive pattern in the outlook chart below, it will most likely find it very hard to trade above the $90.40 resistance zone.
The 'Descending Channel' was discussed in outlook from three weeks ago here, so until the dollar can muster the strength to break above it, it will pave the way to the dollar's overall direction.
Lastly, the $91.00 price level outlined in the chart below was discussed in detail in the following blog post: The Dollar Breaks a Critical Support Level.
U.S. Dollar - In Review - continued
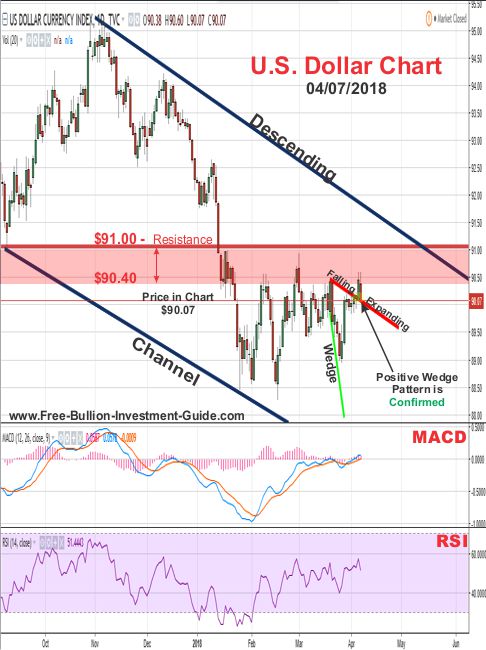
As you can see in the chart below, the U.S. Dollar confirmed the positive 'Falling Expanding Wedge' pattern.
As stated in last week's outlook above, the Dollar's movement was in 'limbo' simply because nobody knew what was going to happen with our trade relations, and nothing's really changed.
But the dollar did confirm the pattern and as also stated last week, it has had a hard time trading above the $90.40 price level.
It was able to close above it on Thursday of last week, but it was unable to stay above that level.
U.S. Dollar - Outlook
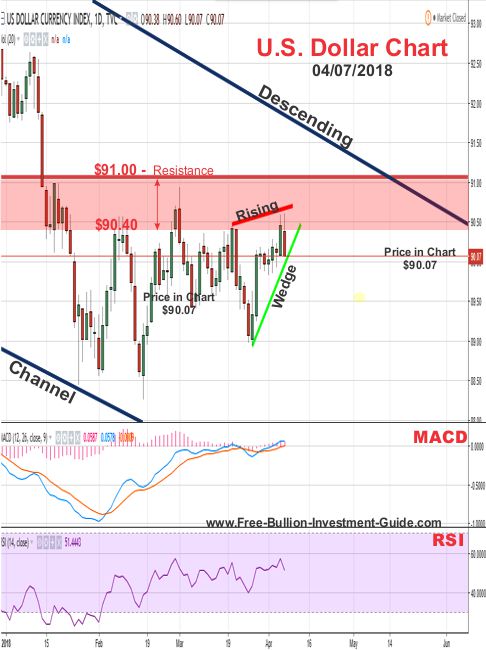
In the U.S. Dollar's outlook chart below, it has formed a negative 'Rising Wedge' pattern.
The pattern isn't expected to hold up for too long for two reasons.
First, the dollar is trading near the end of the 'Rising Wedge' pattern, and two, as we've seen for the last several weeks, the dollar can't seem to trade above the $90.40 price level for more than one day.
So, in the near future, we should have seen the dollar confirm the negative pattern below and move lower in price.
Charts provided courtesy of TradingView.com
U.S. Dollar's Price Resistance and Support Levels
U.S. Dollar's Resistance Levels
$91.00
$90.40
U.S. Dollar's Support Levels
$88.00
$87.00
SILVER
In Review
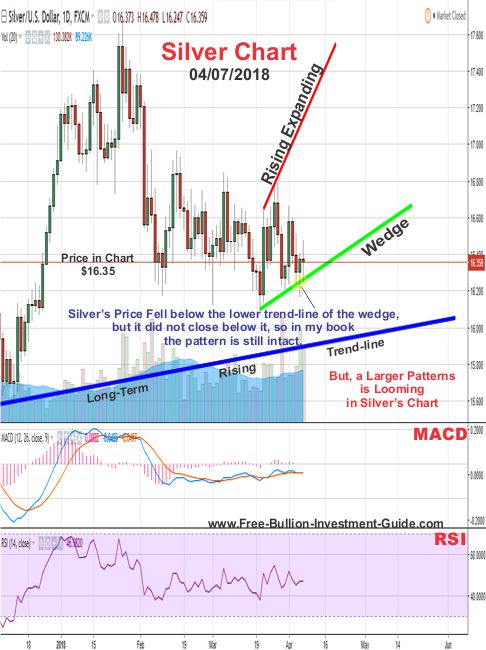
Last week, the chart and commentary below was posted for silver's outlook.
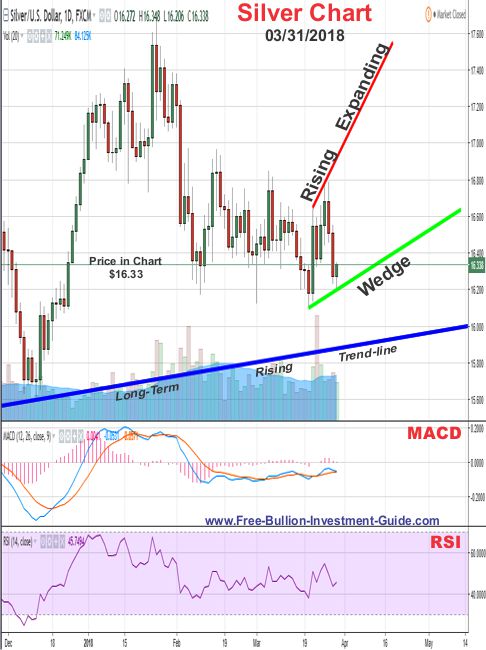
In the outlook chart below, silver has formed a negative 'Rising Expanding Wedge.'
The wedge pattern is very broad, and the price of silver could easily confirm it in a day or two.
But, uncertainty is reigning in this market and 'uncertainty' is gold and silver's best friend.
So unless good news comes out of the trade negotiations, we may see silver rise inside this broad negative wedge before it falls below the bottom trend-line of the 'Rising Expanding Wedge' confirming it.
Silver - In Review - continued
By comparing the outlook chart above and the review chart below, you can see that although silver's price had a lot of movement, it basically moved sideways.
In the middle of last week, silver's price briefly fell below the bottom trend-line of the wedge, but because it did not close a trading day below it, I've decided not to call it confirmed.
Furthermore, one thing everyone who follows silver needs to keep in mind is that silver is an industrial metal in addition to a safe haven metal and because of this reason, it will trade much more violently than gold.
Silver - Outlook
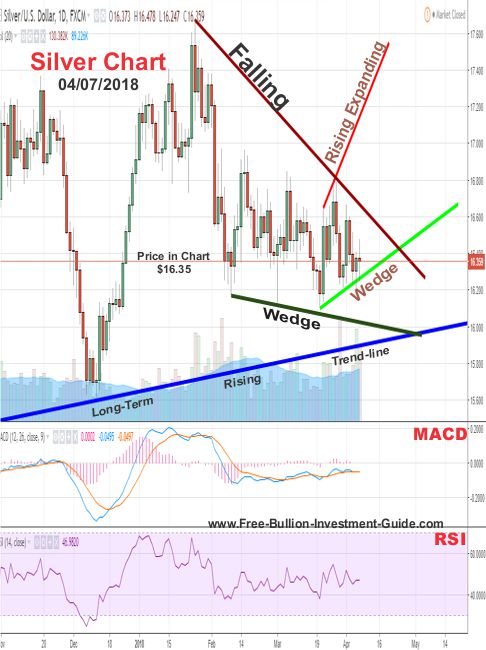
In the chart below, you can see silver now has two patterns that have been identified in its chart.
The larger of the two patterns is a positive 'Falling Wedge' pattern and the other is the same negative 'Rising Expanding Wedge' pattern in the chart above.
Both patterns are expected to be confirmed sometime in the near future, the question is; which one will be first?
If you don't already do this, I would encourage you to start following my chart set-ups on TradingView.com, their charts are free to use.
By doing this you too can see which pattern will be confirmed first; furthermore, if you are looking to buy silver, it will help you better judge when to make your investment.
For instance; if the Rising Expanding Wedge is confirmed first, then the time to buy the dip is very soon.
But, on the other hand, if silver confirms the 'Falling Wedge' first, then you know to hold off your purchase because a dip in the price of silver is most likely going to happen shortly thereafter.
Note: Tradingview.com is an affiliate of this guide, but I use the free charts to construct each blog post, you only pay when you wish to receive more of their services.
Charts provided courtesy of TradingView.com
Silver's Price Resistance &
Support Levels
Silver's Resistance Levels
$17.50
$17.00
Silver's Support Levels
$16.10
$16.00
GOLD
In Review
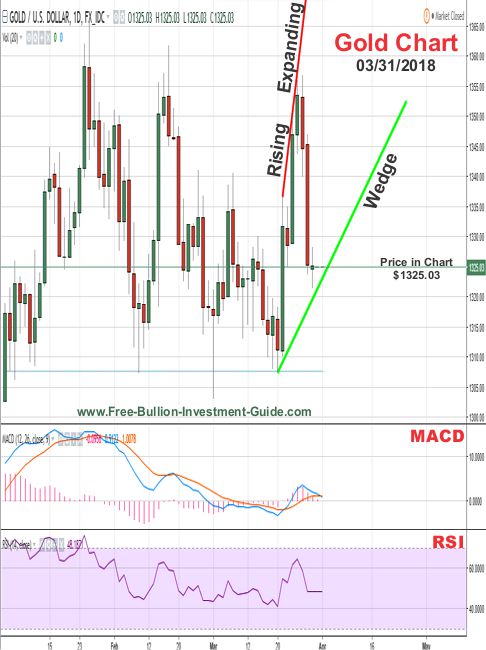
Below, is what was written last week in the gold outlook and its corresponding gold chart is below it.
In the outlook chart below, gold has formed a negative 'Rising Expanding Wedge' pattern.
Like silver, the price of gold could easily break below the bottom trend-line of the wedge this week.
But, because of the uncertainty in the markets about the trade talks, gold could rise in price inside the wedge.
Furthermore, at the end of this week (April 6th) the U.S. Non-Farm Payroll Report will be released, which if it is good, will most likely help gold and silver move higher because it will be a sign that more rate hikes could be in the future.
Because of these factors, we could see gold climb in price before it confirms the 'Rising Expanding Wedge' by falling below its lower trend-line.
In Review - continued
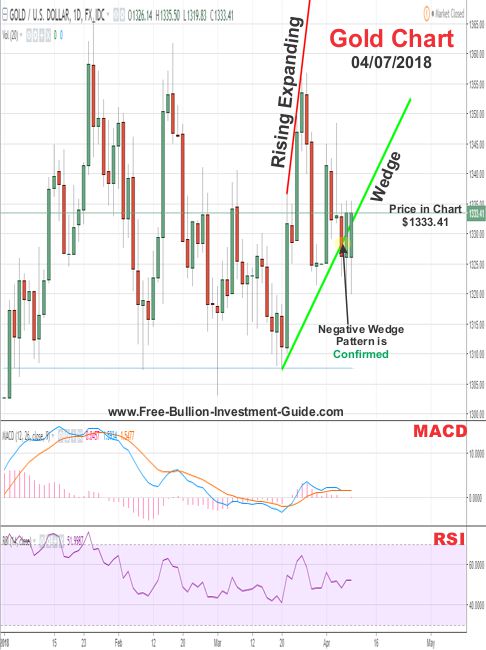
In gold's review chart below, you can see that gold chose to confirm the negative 'Rising Expanding Wedge' pattern earlier than what was hypothesized in last week's outlook above.
Gold - Outlook
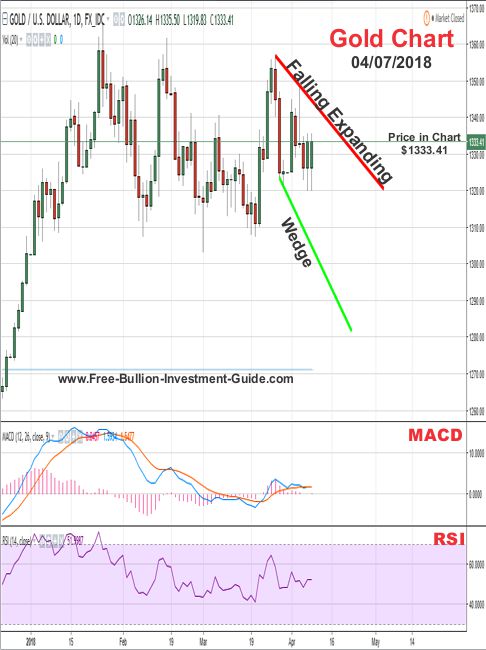
In the outlook chart below, gold has formed a positive 'Falling Expanding Wedge' pattern.
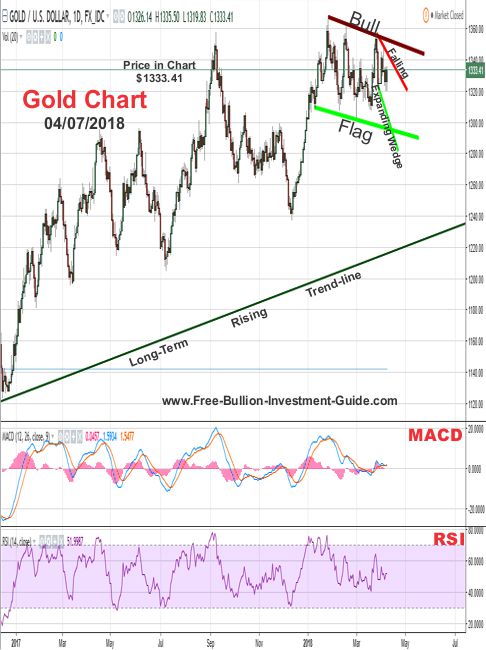
But, this week, I've added another 'Outlook Chart,' below this one, to show you a large positive pattern that has been identified in gold's chart.
Gold - Outlook - continued
Since the beginning of the year gold's been moving sideways, consolidating its price and in doing so it has created a large 'Bull Flag.'
As to when this very positive pattern will be confirmed is anyone's guess, but it may happen sometime shortly after the 'Falling Expanding Wedge' is confirmed.
However, as you can see in the chart above, the 'Falling Expanding Wedge is broad, so gold could easily trade inside it for a while before it confirms it by breaking to the upside.
In addition, the fact that the 'Bull Flag' has been identified, is a very good sign for gold.
And although it doesn't give us any idea as to how soon it will be confirmed, it does give us a very good idea as to where it is going.
Time will tell how and when these patterns are confirmed in the future.
Charts provided courtesy of TradingView.com
Gold's Price Resistance and
Support Levels
Gold's Resistance Levels
$1380.00
$1350.00
Gold's Support Levels
$1300.00
$1280.00
Thank You for Your Time.
Have a Great Week and God Bless,
Steve
'Click Here' see all of the prior Blog posts,
Thank You for Your Time!
|
Investment/Information Disclaimer: All content provided by the Free-Bullion-Investment-Guide.com is for informational purposes only. The comments on this blog should not be construed in any manner whatsoever as recommendations to buy or sell any asset(s) or any other financial instrument at any time. The Free-Bullion-Investment-Guide.com is not liable for any losses, injuries, or damages from the display or use of this information. These terms and conditions of use are subject to change at anytime and without notice. |
Return from this Guide's Latest Blog Post
|
Support this Guide & Paypal Thank You for Your Support |
|
|
 | |||||
This website is best viewed on a desktop computer.
Keep this Guide Online
& Paypal
Thank You for
Your Support
with Feedly
Search the Guide
| search engine by freefind | advanced |
Premium Canadian Bullion
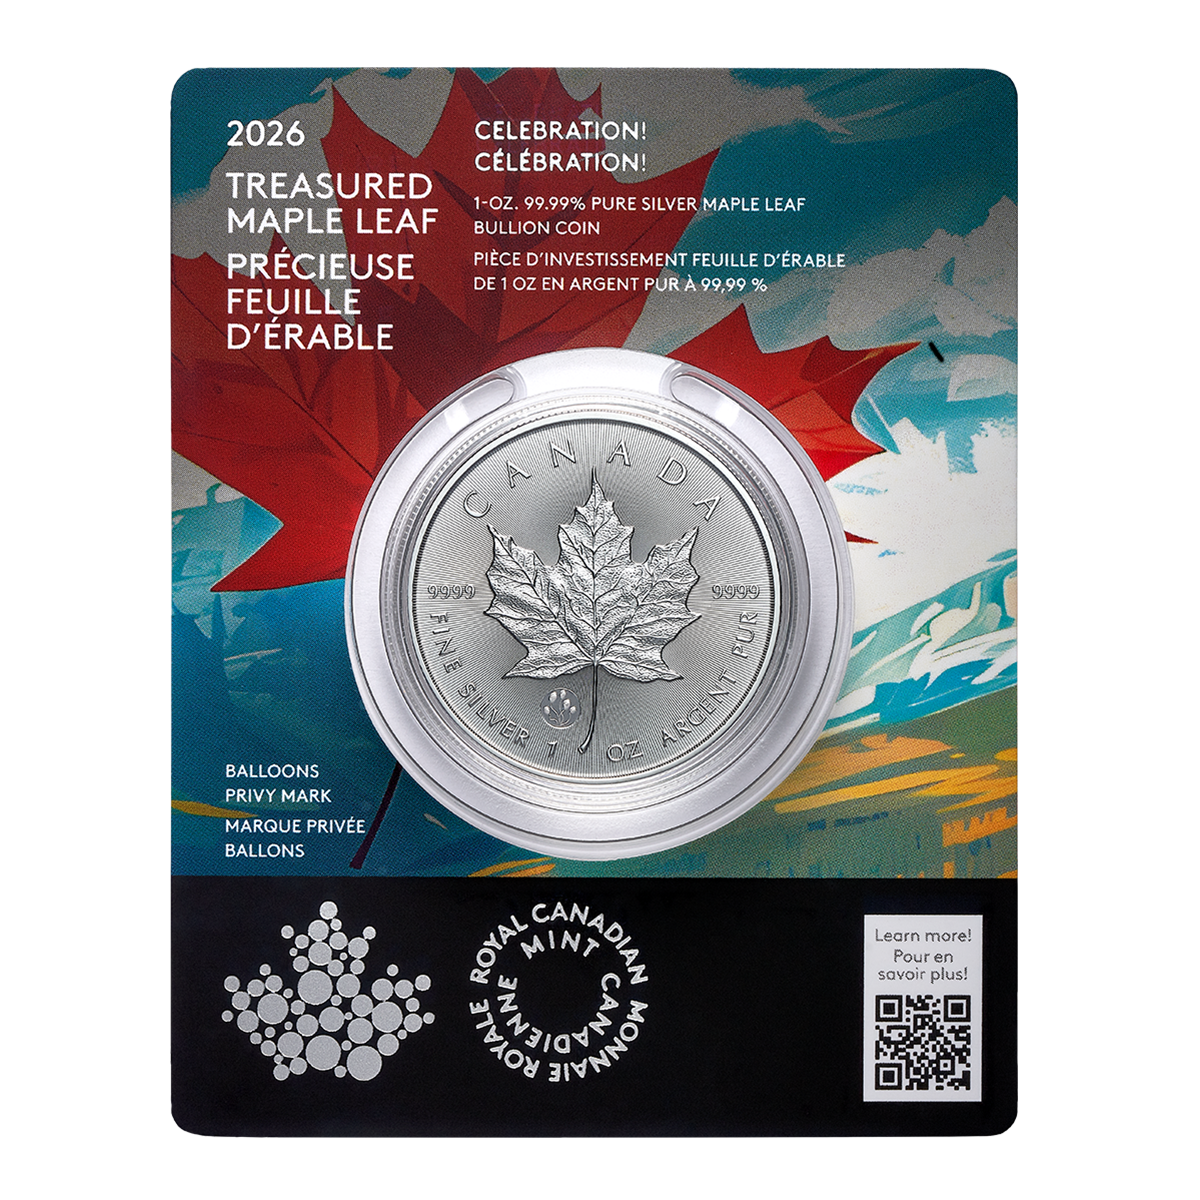
Give a lasting gift of the iconic Silver Maple Leaf bullion coin [More]
Free Shipping on Orders over $100 (CDN/USA)
or
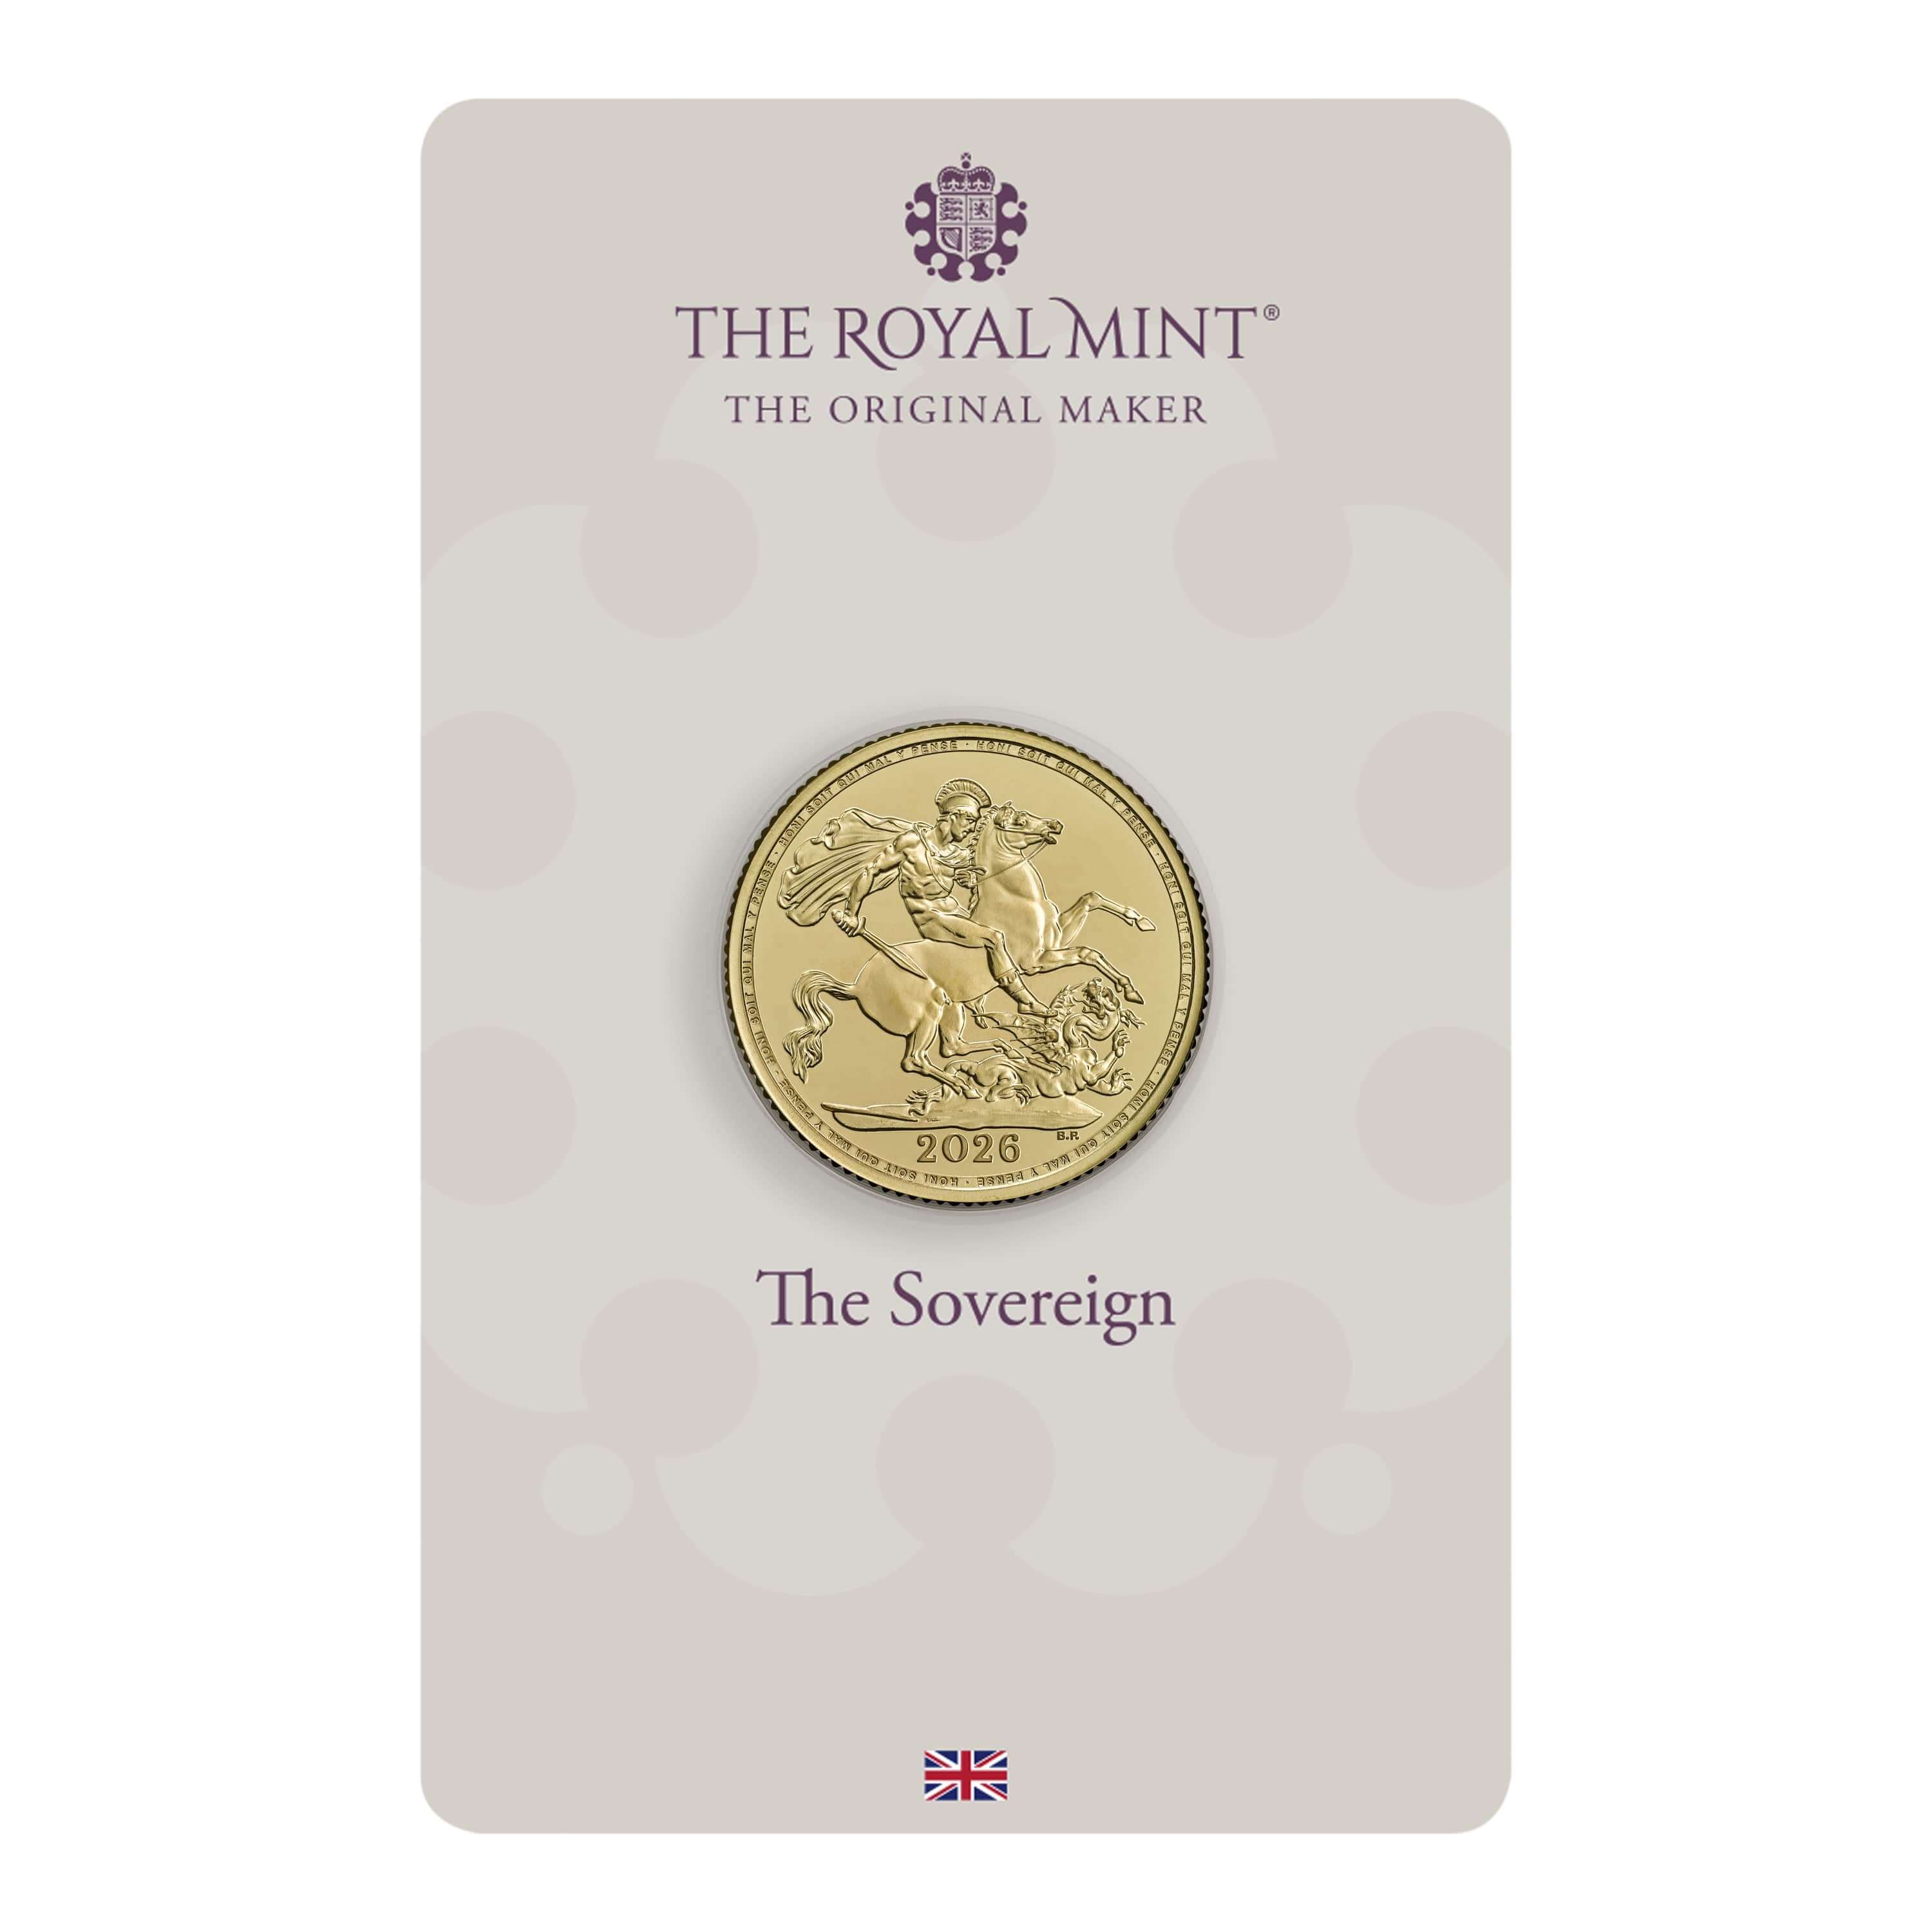
From the U.K. Royal Mint

Daily
Newsletter
Updated Mintages for
American Gold Buffalo
American Gold Eagle
American Silver Eagle
2024 & 2025
Jerusalem of Gold Bullion
Coin photos
(bottom of page)
Mintages
for
2024
Gold & Silver Mexican Libertad
|
Gold Libertads |
Chinese Gold Coin Group Co.
& Chinese Bullion
Help Us Expand our Audience by forwarding our link
www.free-bullion-investment-guide.com.
Thank You!
Last Month's

In No Particular Order
January 2026
All Articles were Originally Posted on the Homepage
