
ExpressGoldCash - 4.9 star - Customer Reviews
Fundamentals Stop Channeling
the Precious Metals
in their short-term trade
Precious Metals Review and Outlook from
9/18 thru 9/29/2017
Originally Posted on 09/25/2017 @ 8:06 am
by Steven Warrenfeltz
Subscribe to this Blog

Hello,
I hope you've been well, and Thank you for visiting the Free-Bullion-Investment-Guide's latest blog post, before we get to the precious metals review and outlook, below are some of the Best Bullion Market-Related News articles that were taken from this guide's home page.

The Dollar Could Be Starting a Multiyear Bear Market - DailyWealth
BIS Hunts for 'Missing' Global Debt, Inflation - MorningStar
The Secret Reason Why Gold Is a Buy - BanyanHill
American Palladium Eagle Bullion Coin Debuts on Sept. 25, 2017 - CoinNews
Big Trouble For The Silver Market If Mexico Monetizes Its Silver Libertad Coin - SRSrocco Report
What Jamie Dimon Got Wrong About Bitcoin & Tulips - Zero Hedge
The Precious Metal Heading For A Supply Squeeze - Oil Price
Best of the Week for Gold NanoParticle Cancer Research
GOLD NANOPARTICLE ~ CANCER RESEARCH: Nanoparticle Drones To Target Lung Cancer with Radiosensitizers And Cannabinoids - MJ Headline NewsGOLD NANOPARTILCE ~ CANCER RESEARCH: Researchers developing take home cancer test - TV6 (Upper Michigan Source)
For the two last months, fundamentals have been driving the precious metals higher.
It's been one news story after another that has been keeping uncertainty in the markets, and as we all know, uncertainty is a precious metal's best friend.
The precious metals, particularly gold, and silver, have been moving up in price since early July. There first move up from July 10th through the 28th, was mostly due to the metals rebounding after a steep sell-off.
The reasons behind the sell-off in June were explained in this blog post; Why Did Gold and Silver Fall?
After July 28th, the metals consolidated and it looked like a pullback in price could happen.
But shortly thereafter, more uncertainty entered the market, after traders started to doubt that the President could come through with his campaign promises, so we saw another move-up in the price of precious metals.
Since then we've had one current event after another fueling uncertainty in the markets.
From North Korea, stirring tensions between the U.S. and its allies to Hurricanes and Central Bankers its been a great environment for the precious metals a.k.a. safe havens.
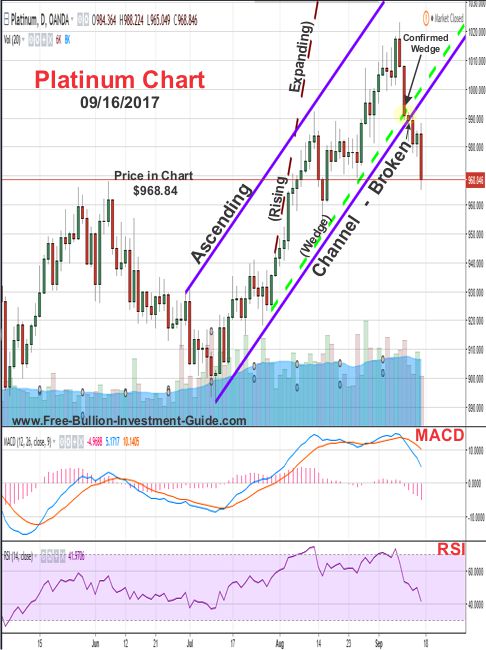
But now it seems many of these factors have subsided, at least for now, and because of this the negative technical patterns looming over the precious metals have started to demonstrate their influence.
Over the last week, most of the negative patterns that have been in the charts, most notably for gold and silver, have mostly confirmed.
In last week's blog post, I started the analysis with Platinum because I believed it was giving us a glimpse of gold and silver's future.
The chart to the right was in last week's platinum section, it is a mirror image of gold's review charts this week.
This week's review and outlook analysis includes Gold, Silver, U.S. Dollar, Platinum, Palladium and an update on the GLD ETF.
GOLD
In Review
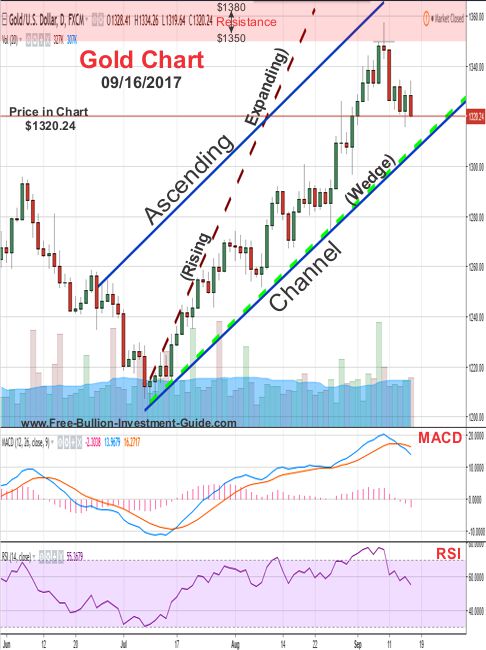
Below is the gold outlook from last weeks.
Gold has formed an 'Ascending Channel,' but the 'Rising Expanding Wedge' still hasn't been denied or confirmed, so it continues to loom over the price of gold, in a negative way.
For the week to come, it looks like gold's chart will look a lot like platinum's 'Broken Ascending Channel' chart, in the platinum section above.
Why?
Take a look at Gold's MACD and RSI (lower indicators), both are in overbought territory and both are indicating that the price has more room to pull back.
In Review - continued
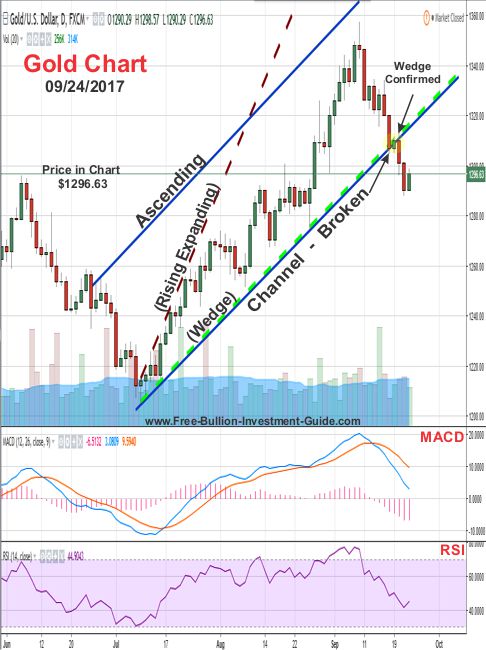
As you can see in the chart below, what looked like it was going to happen last week, happened, gold broke its narrow 'Ascending Channel' and it confirmed the 'Rising Expanding Wedge.'
Gold - This Week's Outlook
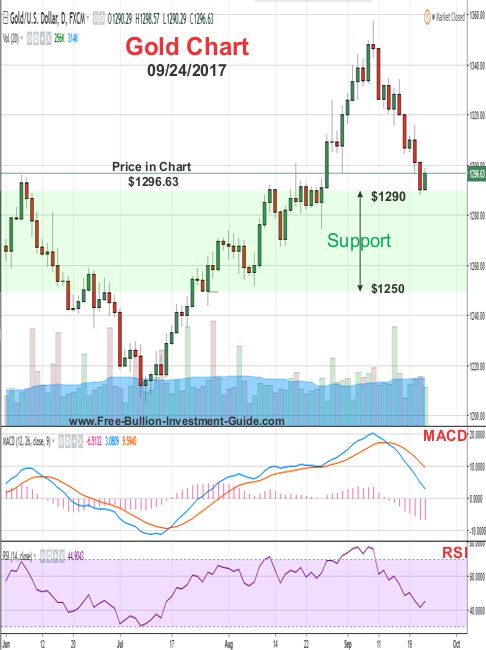
For the week to come, I could not find any definitive patterns in gold's chart, that's why the chart below looks almost bare.
So instead of showing you a pattern in this week's chart, I pointed out to you where gold should find support and either stop its fall or start to consolidate before it regroups and decides which way it wants to move.
Charts provided courtesy of TradingView.com
Gold's Price Resistance and
Support Levels
Gold's Resistance Levels
$1350.00
$1300.00
Gold's Support Levels
$1290.00
$1250.00
SILVER
In Review
Below is the silver outlook commentary and chart from last week.
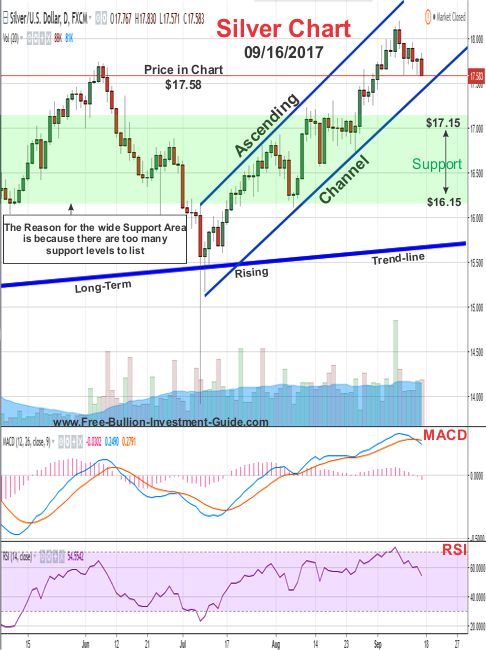
After last week's move in silver, the only pattern that I could identify in silver's charts was an 'Ascending Channel,' but I don't expect it to last.
This isn't necessarily a bad thing, with all the precious metals that have or had a narrow 'Ascending Channel' it simply means that a correction is or was due.
Unlike what you'd expect if a broad 'Ascending Channel' like Palladium's was broken which would mean something in its market had changed for the better or worse.
In addition, Silver's MACD and RSI, lower indicators, look like they have more room to fall in a price correction, however, silver has a broad range of support so we should see the price stop its fall somewhere in this area.
In Review - continued
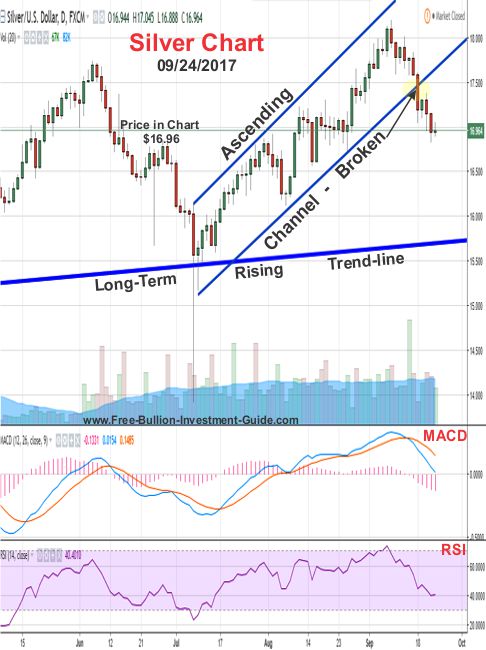
In the chart below, you can see that like gold, silver's channel was too narrow to continue its upward movement.
Plus, as mentioned in last week's outlook, silver's MACD and RSI were clearly indicating that the price of silver was just beginning its pullback in price.
Silver - This Week's Outlook
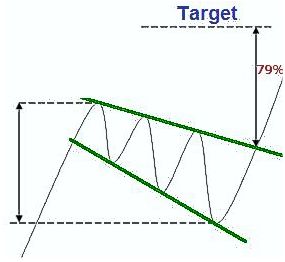
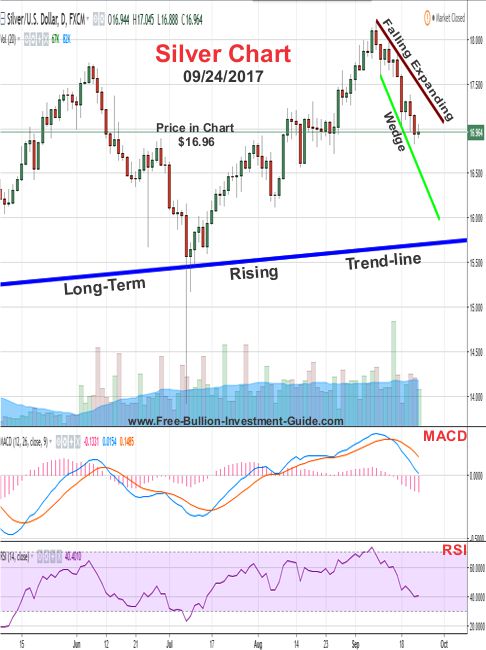
After studying the silver chart, I found a positive pattern, a 'Falling Expanding Wedge.'
How soon the wedge will be confirmed is anyone's guess, but silver's MACD and RSI look to be signaling that silver may be ready to stop falling.
So it looks like for the first part of the week we'll be looking at some consolidation in silver's price, then it will be up to the market as to how soon the wedge plays itself out.
charts provided courtesy of TradingView.com
Silver's Price Resistance &
Support Levels
Silver's Resistance Levels
$17.70
$17.25
Silver's Support Levels
$16.60
$16.15
US DOLLAR
In Review
Below is the U.S. Dollar's commentary and chart from a week ago.
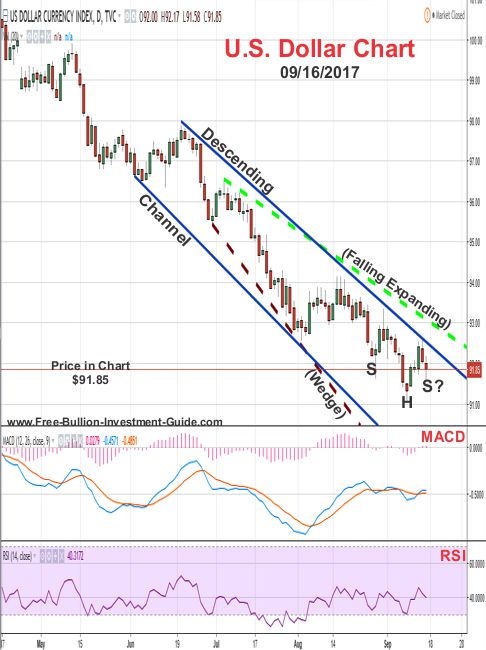
In this week's U.S. Dollar chart a lot is going on, in addition to the 'Falling Expanding Wedge,' the dollar has also formed a channel, in its case it's a 'Descending Channel,' plus an 'Inverse Head and Shoulders' pattern looks like it is forming in the chart.
All the patterns, but the channel, are positive for the U.S. Dollar, but like the channels in this week's precious metals charts, the U.S. Dollar is expected to break its channel sometime in the near future.
In addition, the positive 'Inverse Head and Shoulders' pattern is only implied, but the same pattern is also forming in the U.S. Dollar's MACD and RSI (lower indicators) so it may be confirmed very soon, time will tell.
In Review - continued
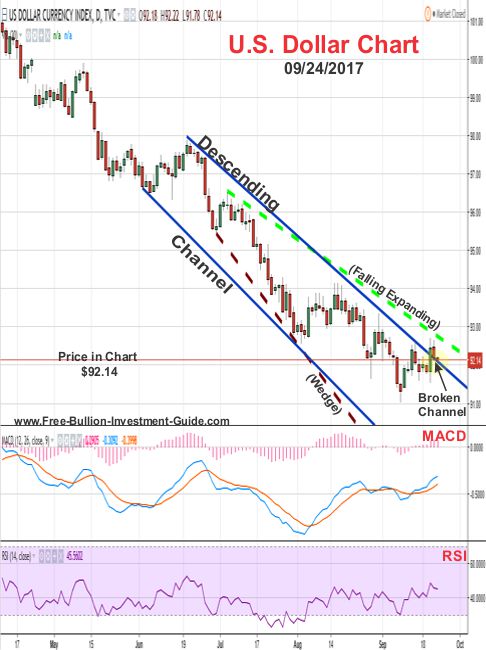
In a review of what was stated last week, the first chart below shows you that the 'Descending Channel' broke as the dollar moved up after the Federal Reserve announced on Wednesday that they intend to start to reduce their balance sheet.
In Review - continued
In the second review chart below, it shows that the implied 'Inverse Head and Shoulders' pattern in last week's outlook was also confirmed.
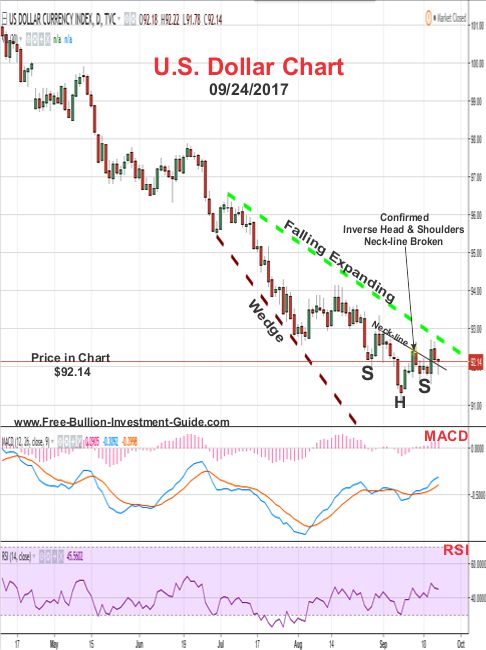
U.S. Dollar - This Week's Outlook
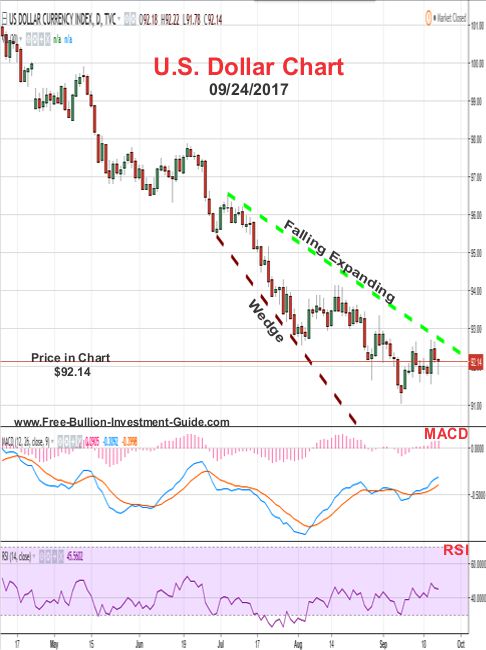
For this week's outlook, it looks like we're back at where we started back in late July when I posted this 'Falling Expanding Wedge' in the U.S. Dollar chart.
Here's the post: A Transition is Coming in Gold and Silver's short-term trade.
The candlestick chart itself isn't giving much of an indication as to which way the price of the U.S. Dollar will move, and because of this, we may just see some consolidation in the beginning of the week.
But the MACD and RSI are giving the indication that more upside will happen this week, so we may see the dollar finally confirm the 'Falling Expanding Wedge' this week; time will tell.
Charts provided courtesy of TradingView.com
U.S. Dollar's Price Resistance and Support Levels
U.S. Dollar's Resistance Levels
$94.00
$93.00
U.S. Dollar's Support Levels
$91.00
Platinum
In Review
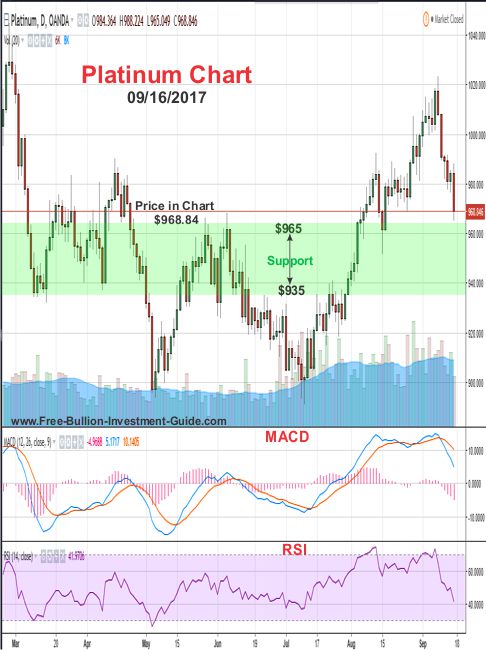
Below is the outlook chart and commentary from the Platinum section in last week's blog post.
In platinum's outlook chart below, no clear patterns could be found, in addition, although platinum is closing in on a broad support, its MACD and RSI (lower indicators) both show that more downside is probably in its future.
This simply means that although we may see some more pullback in platinum's price this week, it should stop its pullback somewhere inside the support area below.
In Review - continued
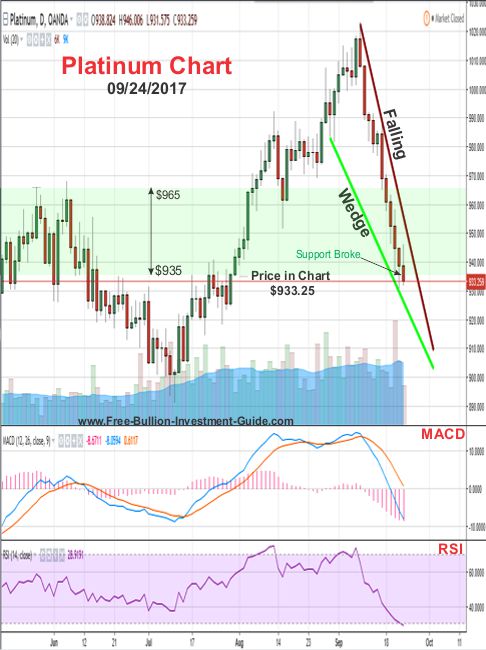
In the chart below, you can see that Platinum fell through the full support area in the chart above.
Platinum - This Week's Outlook
Although Platinum literally fell like a rock last week, its MACD and RSI look like the fall has stopped or will shortly.
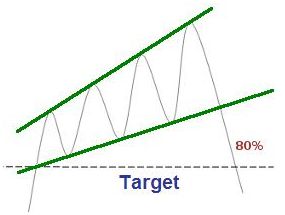
In addition, a positive 'Falling Wedge' pattern has formed in Platinum's chart, so we should see the price move up, sometime this week, confirming the wedge.
Charts provided courtesy of TradingView.com
Platinum's Price Resistance and Support Levels
Platinum's Resistance Levels
$990.00
$965.00
Platinum's Support Levels
$925.00
$900.00
Palladium
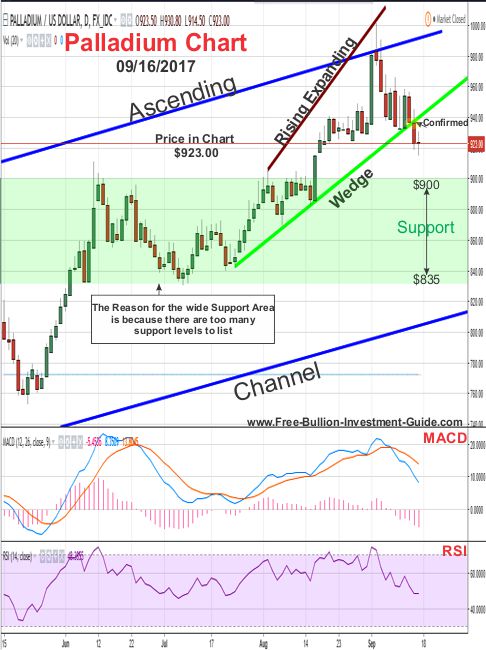
Below is the commentary and chart from last week's Palladium section.
In Review
No clear patterns have formed in palladium's chart, and like platinum, it too has a broad support level, but the price looks like it may pullback more in the week to come, before it finds support.
In Review - continued
In the chart below, you can clearly see that the price of Palladium did not fall as far as I thought, which is why the support level is not shown in the chart below.
Palladium - This Week's Outlook
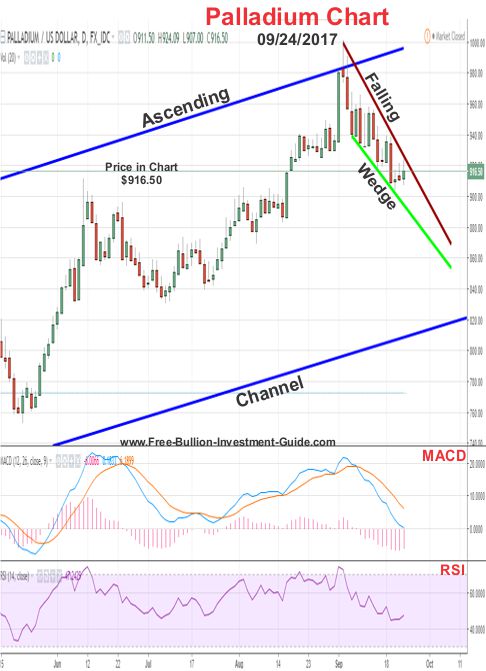
In the week to come, Palladium has formed a positive 'Falling Wedge' and since it is so narrow, it should break it some time this week.
I say this not only because the wedge is so narrow, but because the MACD and RSI, in the chart below, have already started to show that a change in the direction of Palladium's price is imminent.
Charts provided courtesy of TradingView.com
Palladium's Price Resistance and Support Levels
Palladium's Resistance Levels
$950.00
Palladium's Support Levels
$900.00
GLD - ETF
At the end of July, I did a short review of the GLD, I rarely follow the GLD because the GLD mirrors Gold in their trading patterns and I'd rather pay more attention to the leader, not the follower.
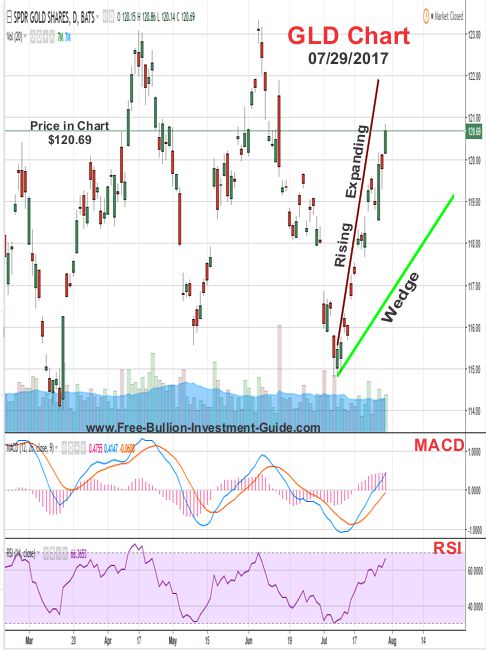
So, below the is my review of the GLD and its chart from last July.
GLD Review from late July
Below is the GLD's chart, like gold (in the top section of this blog) it too has a rising expanding wedge, so like gold, after the GLD has confirmed this wedge (or not), I will follow up on it.
But sometime soon, like gold, its price looks like it will be falling.
GLD - Update
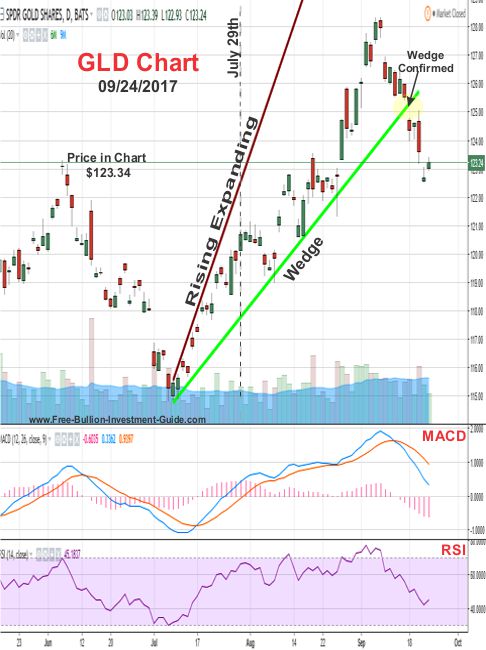
As you can see in the chart above, that the GLD chart looks similar to the Gold Chart, at the top of this blog post.
When I first identified the 'Rising Expanding Wedge' in Gold and the GLD in late July, I thought then that we'd be way past breaking this pattern by now.
I had no idea that we'd be waiting till late September for Gold and the GLD to be finally breaking their wedges.
I pointed out in the chart below exactly where the GLD was when I created the chart above to give you some perspective.
As for the GLD's future, like gold, it has not formed any clear pattern in this week's chart, so I'll revisit it in a few weeks and give you an update at that time.
Thank You for Your Time.
Have a Great Week.
God Bless, Steve
'Click Here' see all of the prior Blog posts,
Thank You for Your Time!
Investment/Information Disclaimer:
All content provided by the Free-Bullion-Investment-Guide.com is for informational purposes only. The comments on this blog should not be construed in any manner whatsoever as recommendations to buy or sell any asset(s) or any other financial instrument at any time. The Free-Bullion-Investment-Guide.com is not liable for any losses, injuries, or damages from the display or use of this information. These terms and conditions of use are subject to change at anytime and without notice.
|
Support this Guide & Paypal Thank You for Your Support |
|
|
 | |||||


Recent Articles


-
Newsletter of the Free Bullion Investment Guide - October 2026
Oct 05, 26 04:57 PM
 The October 2026 newsletter of the Free Bullion Investment Guide provides the latest updates, fundamental and technical gold and silver market analysis, the best articles from last month, and a list o…
 -
Newsletter of the Free Bullion Investment Guide - September 2026
Sep 05, 26 08:47 PM
 The September 2026 newsletter of the Free Bullion Investment Guide provides the latest updates, fundamental and technical gold and silver market analysis, the best articles from last month, and a list…
 -
Newsletter of the Free Bullion Investment Guide - August 2026
Aug 05, 26 04:26 PM
 The August 2026 newsletter of the Free Bullion Investment Guide provides the latest updates, fundamental and technical gold and silver market analysis, the best articles from last month, and a list of…
 -
Newsletter of the Free Bullion Investment Guide - July 2026
Jul 05, 26 08:41 PM
 The July 2026 newsletter of the Free Bullion Investment Guide provides the latest updates, fundamental and technical gold and silver market analysis, the best articles from last month, and a list of r…
 -
Newsletter of the Free Bullion Investment Guide - June 2026
Jun 05, 26 03:06 PM
 The June 2026 newsletter of the Free Bullion Investment Guide provides the latest updates, fundamental and technical gold and silver market analysis, the best articles from last month, and a list of r…

18W LED Security Light (Dusk to Dawn & Motion Sensor) - $32.99
from:
 LED Lighting



This website is best viewed on a desktop computer.

Keep this Guide Online
& Paypal
Thank You for
Your Support

with Feedly
Search the Guide
| search engine by freefind | advanced |


1838 Victoria Gold Sovereign
First Sovereign issued during Victoria’s reign Wyon
The Royal Mint (U.K.)

Daily
Newsletter
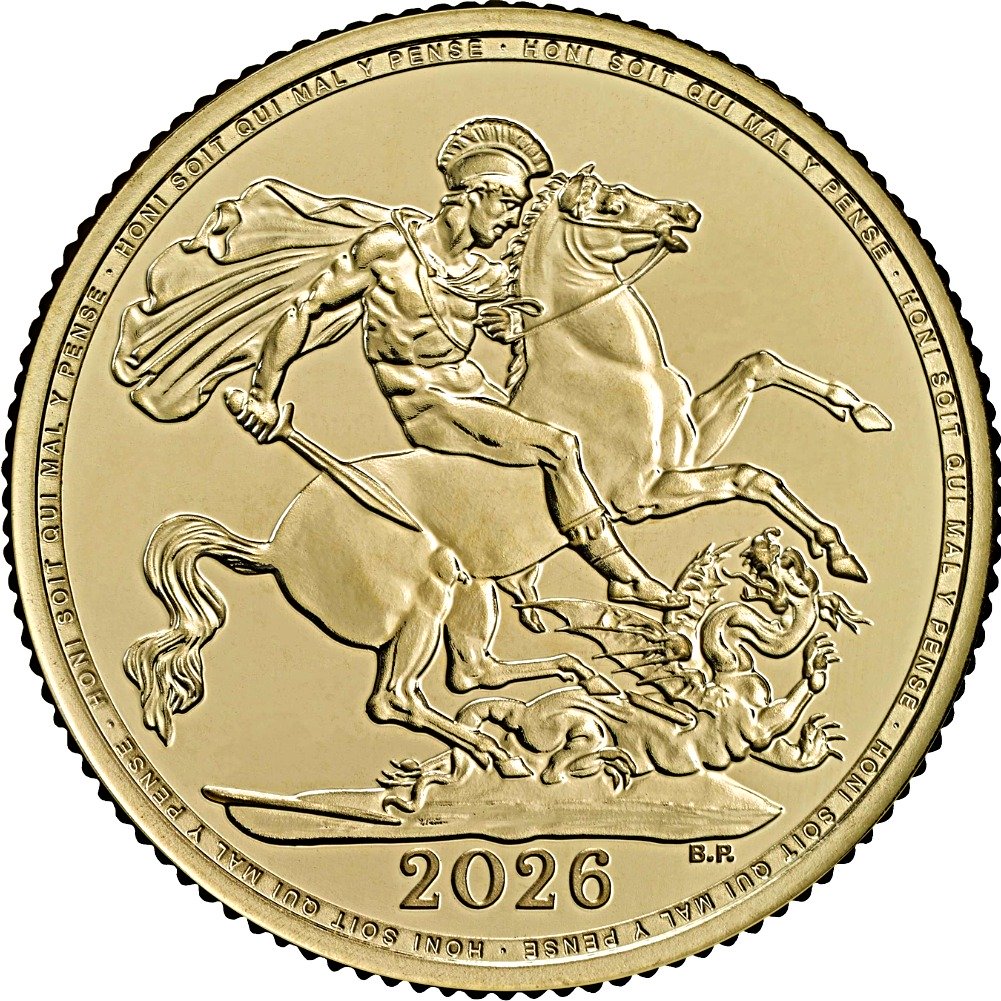
2026 U.K. Gold Sovereign Updates
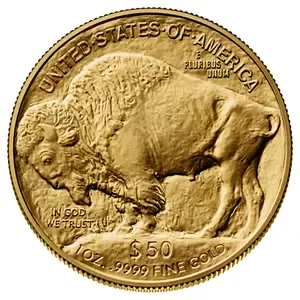
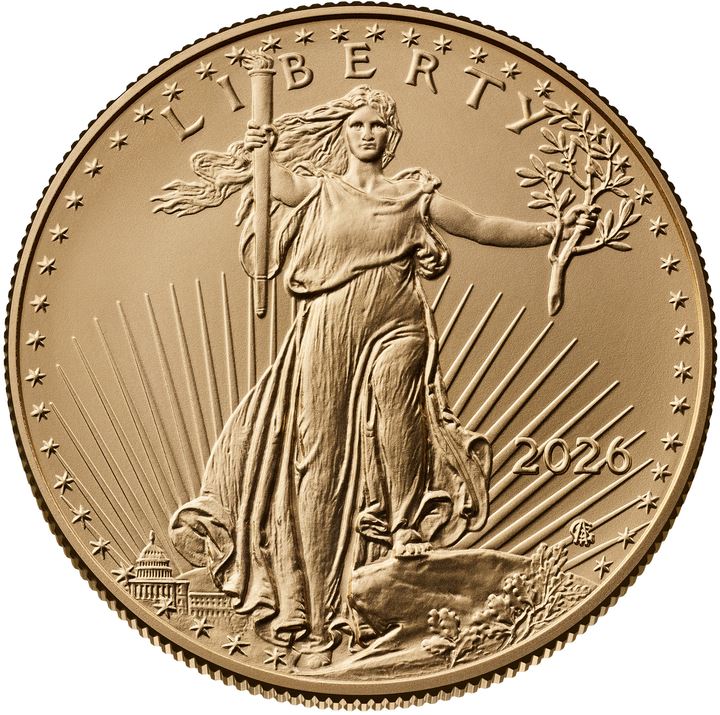
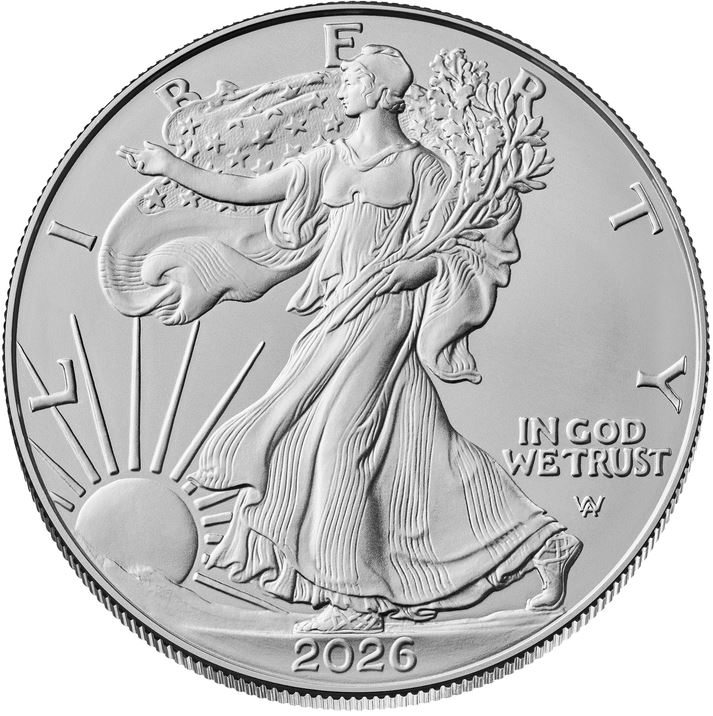
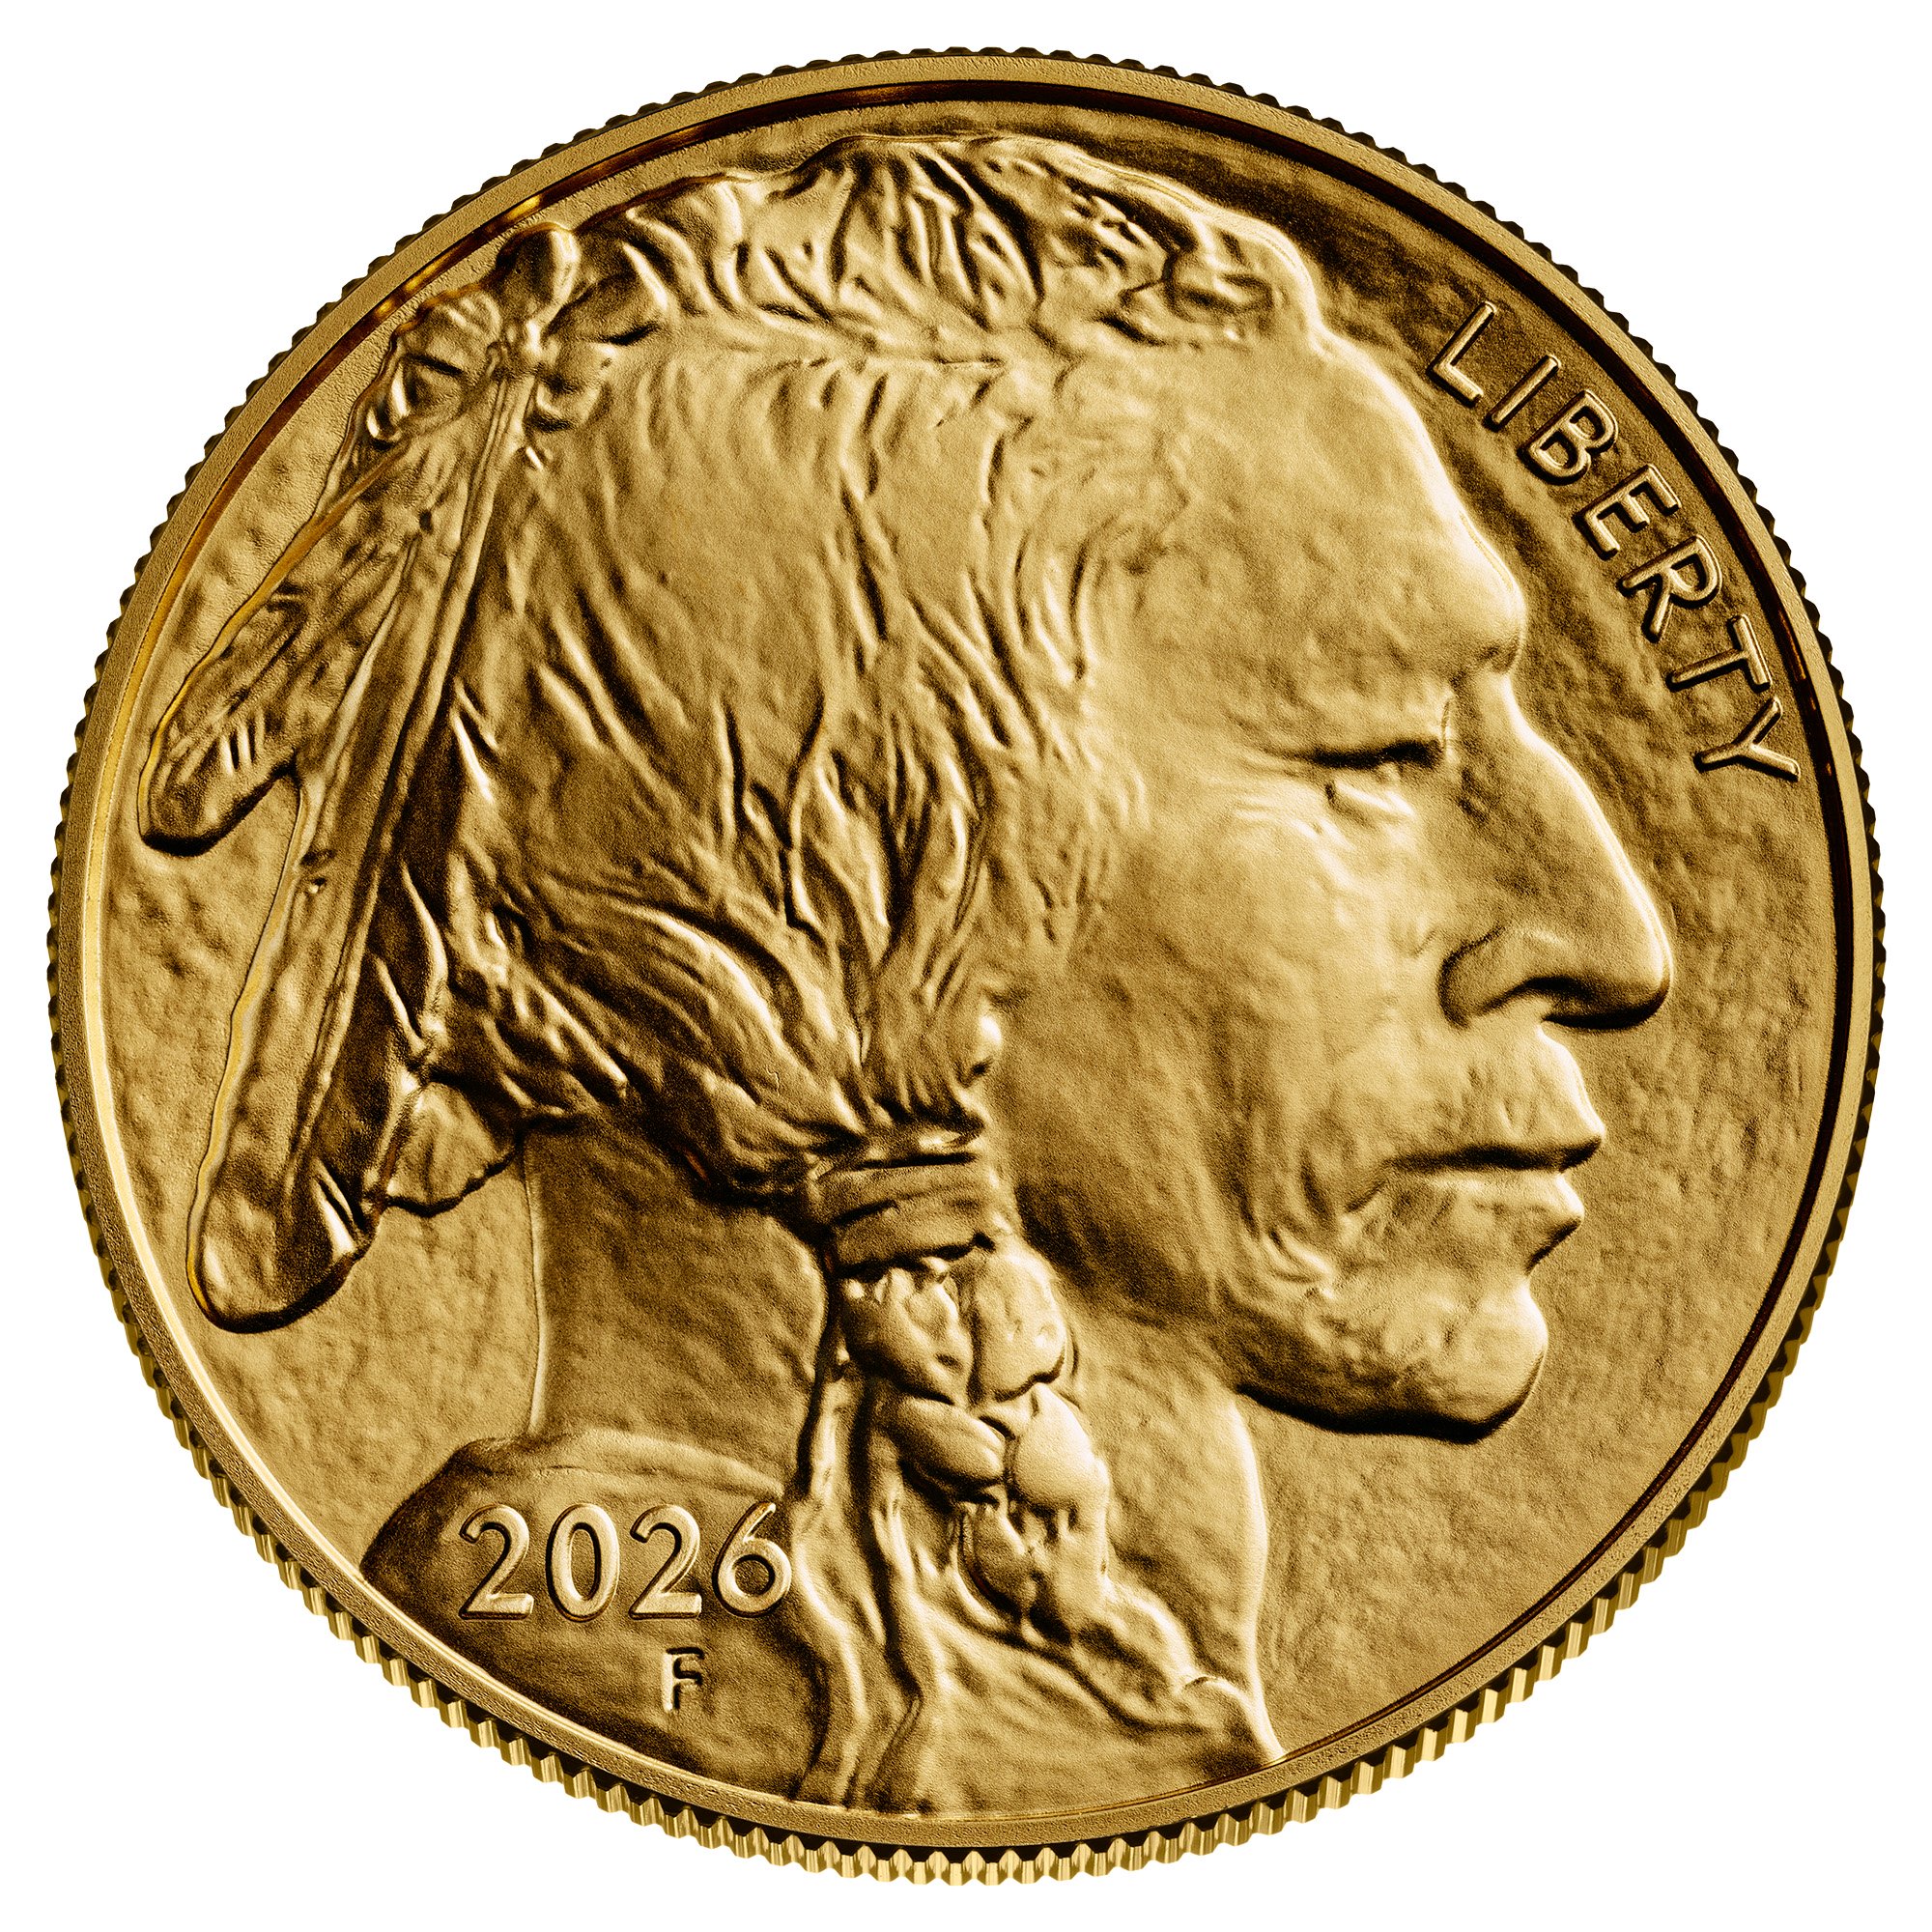
Gold and Silver American Eagle & Gold Buffalo Bullion Coin Mintage Updates
Updates for
Australian Lunar
Gold, Silver, and Platinum Bullion Coins


|
Platinum: |
2026 Silver Australian Koala
Photos & Mintage Update

Updated Mintages and 2026 Photos for
Australian Gold, Silver, and Platinum Kangaroos
Gold Australian Kangaroos:

Silver Australian Kangaroo:

Platinum Australian Kangaroo:

Mintages
for
2024 &
2025 - Recently Posted
Gold, Silver, & Platinum
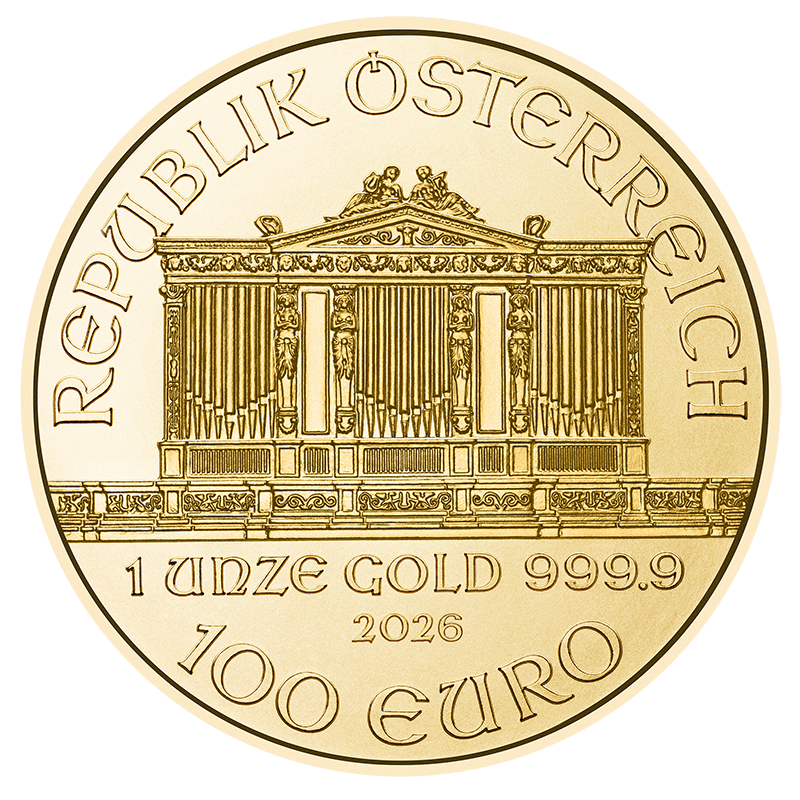
Austrian Philharmonic Bullion Coins
|
Silver Austrian Philharmonics  |
Platinum Austrian Philharmonics

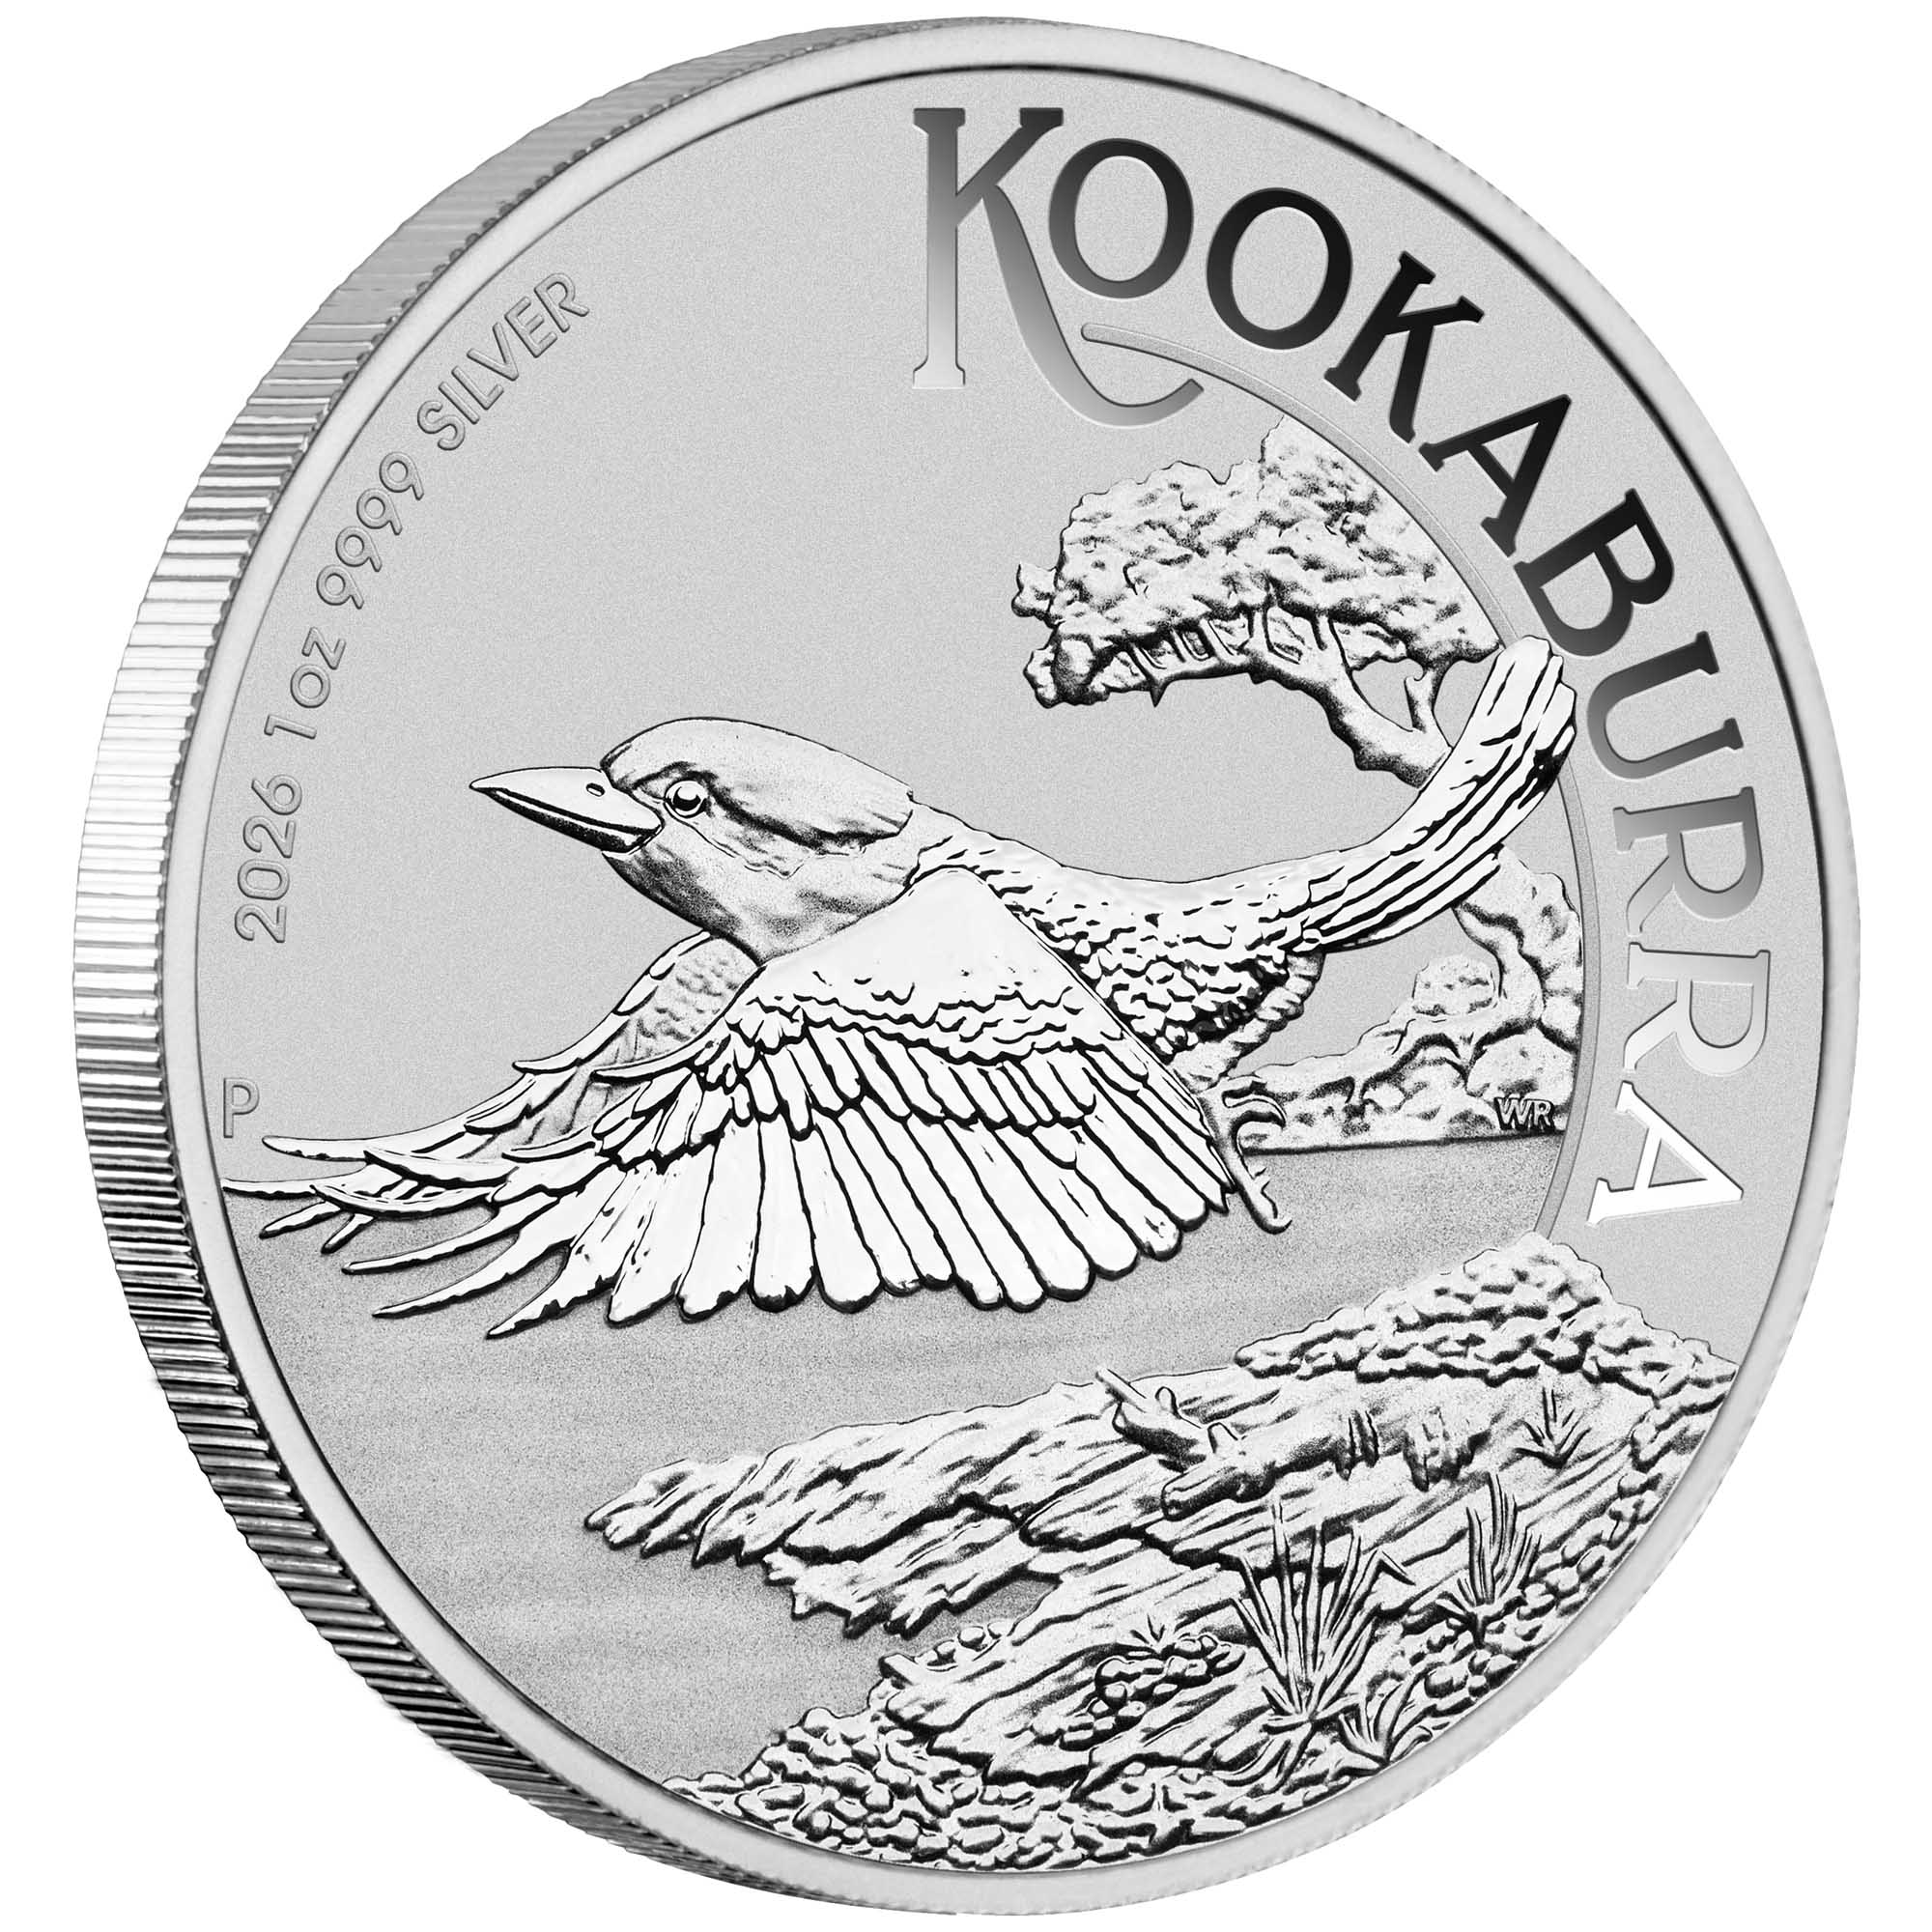
2026 Silver Australian Kookaburra
Photo & Mintage Update


Help Us Expand our Audience by forwarding our link
www.free-bullion-investment-guide.com.
Thank You!
Last Month's

In No Particular Order
September 2026

|
All Articles were Originally Posted on the Homepage Gold Nanoparticle Cancer ResearchSNUBH leads Korea-US project to develop light-activated pancreatic cancer therapy - Korea Biomedical Review Harnessing gold nanorods and light for targeted cancer therapy - PHYS.org (msn) ZIF-8 Nanocarrier Delivers Plant Drug and Gold Nanorods to Attack Melanoma - BioEngineer.org Gold Nanorods and Laser Light Strike at Cancer Stem Cells in Cats With Breast Tumors - BioEngineer.org |
Click this link to Learn more about Gold Nanoparticle Cancer Research
All Articles were Originally Posted on the Homepage