This Christmas Silver's
Playing with Fire
Review and Outlook for Silver, Gold and the U.S. Dollar
Originally Posted on 12/11/2017 @ 10:18 am
by Steven Warrenfeltz
Subscribe to this Blog
Hello,
Thank you for visiting the Free-Bullion-Investment-Guide's latest blog post, before we get to the precious metals review and outlook, below are some of last week's Best Bullion Market-Related News articles that were taken from this guide's home page.

CHARTS: Is Tax "Reform" Good for the US Dollar? How About Gold? - Mish Talk
We Are Now in Tech Bubble Territory - Financial Sense
Major Gold Dealer APMEX Begins Accepting Bitcoin - Coin Desk
Bitcoin – Millennials Fake Gold - ValueWalk
Russia & China could set international gold price based on physical gold trading - RT
6 Ways To Make Sure You Don't Go Into Debt This Holiday Season - Forbes
Gold NanoParticle Cancer Research
Designing a golden nanopill - PHYS.org
12/04: Benefits of gold: Check out 4 medical uses of it - International Business Times
Photo above provided courtesy of pexels.com
Before I explain why 'Silver is Playing with Fire,' I think I should explain to you how I came to this conclusion in the first place.
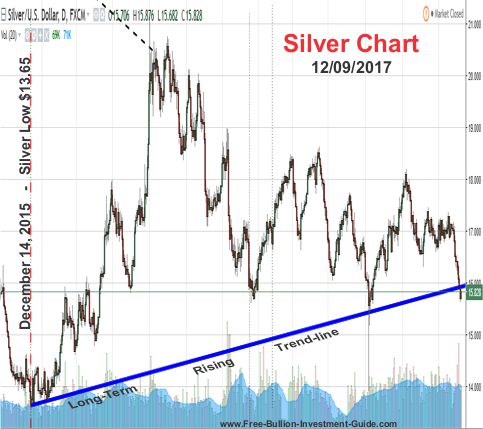
For over a year, there has been a blue trend-line on the silver charts of this blog labeled as a 'Long-Term Rising Trend-line.'
For example, the silver chart below is from last week's silver outlook.
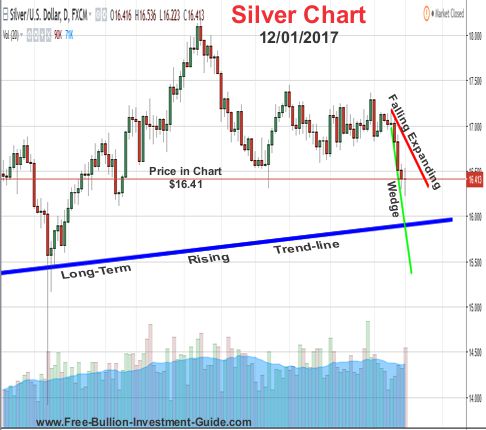
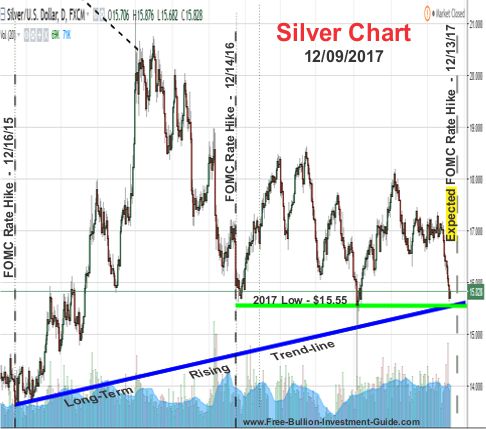
As you can see in the chart below, Silver's 'Long-Term Rising Trend-line' dates back to December 14th of 2015, when silver hit a low of $13.65.
Ironically, this date was two days before the Federal Reserve enacted its first interest rate rise in 7years, on December 16th of 2015.
In last week's silver outlook, there was no mention of silver coming close to this trend-line because even though I pondered it, I simply didn't see it happening.
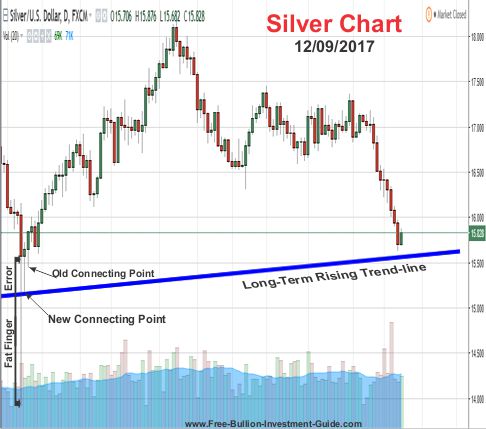
Well, I should have pondered it and studied the chart more because silver not only came close to it, it broke the 'Long-Term Rising Trend-line' as seen in the charts above and below.
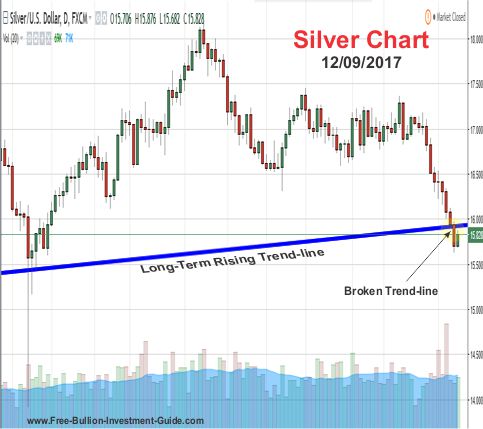
However, I may have been wrong with where I plotted the connecting points of the rising trend-line.
For those who may not know, trend-lines are created by connecting two or more points.
About five months ago, on July 7th, silver experienced what the market called a 'Fat Finger Error' trade.
Since it happened, I've always dismissed the lows of that 'Fat Finger trade,' because it was clearly an anomaly.
However, on the next day of trading (July 10, 2017) silver opened at $15.55 which, so far, is its low of the year, then it briefly touched new lows before it managed to close the day on the positive side of the trade.
In the chart below, I lowered the 'Long-Term Rising Trend-line' to indicated where the trend-line used to connect (July 11th lows) to its new connection point (the lows of July 10th), indicating that silver hasn't broken its 'Long-Term Rising Trend-line' but it's definitely playing with fire, which is explained under this chart.
Why is Silver Playing with Fire?
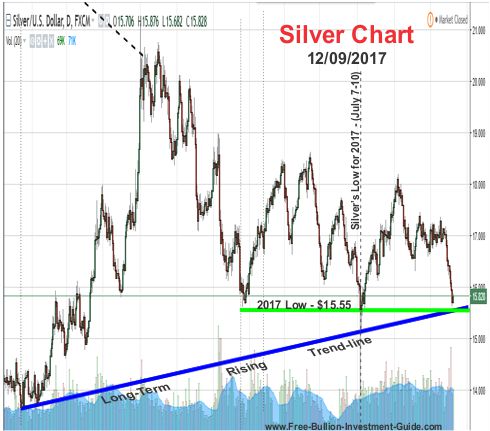
As previously mentioned, silver hit its yearly low of $15.55 when the 'Fat Finger Trade' occurred in early July, this low is indicated in the chart below.
The $15.55 price level is a fire line that silver does not want to cross.
In the chart below, you can also see that this line now extends below the new 'Long-Term Rising Trend-line.'
If silver falls below the new 'Long-Term Rising Trend-line' or more importantly if silver closes a day of trading below the $15.55 price level, it could retest its multiyear low of $13.65 in the months to come, or sooner.
But...
There is another way of looking at the silver chart above.
The Federal Reserve is meeting this week, and it is expected to raise interest rates on December 13th.
Shortly after the last two rate hikes, silver has moved up in price, plus January is historically a good month for silver (and gold).
So, if silver can stay above its 2017 lows, it could have a good start to 2018.
Ultimately, time will tell if silver gets burned this Christmas, or not.
Charts provided courtesy of TradingView.com
Review & Outlook
|
All the charts on this blog are Daily Charts unless noted otherwise.
US DOLLAR
In Review
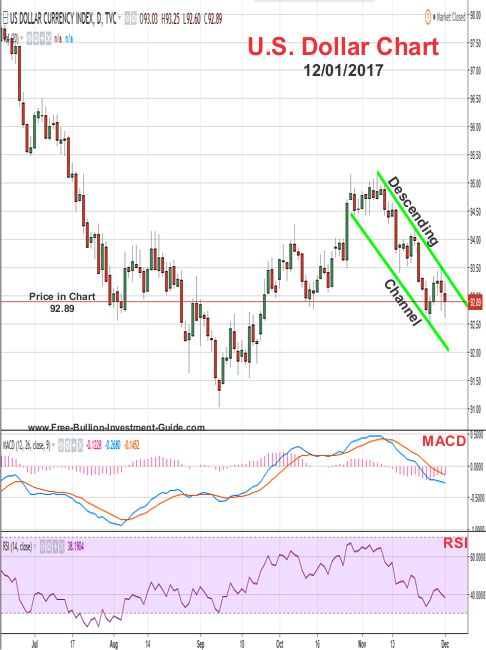
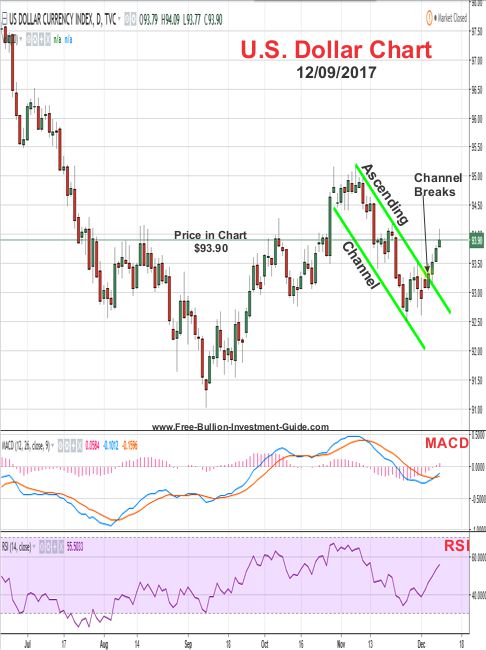
Last week, I wrote the following about the U.S. Dollar and posted the chart below.
For the week to come, it's hard to say what the U.S. Dollar will do as long as it continues to trade inside the 'Descending Channel.'
However, it is giving the indication that it may be done with falling in price, at least in the near term.
I'm stating this because the Dollar's MACD's bar chart has already started to change directions and its signal lines are also starting to come closer together indicating a possible positive change in direction.
But, the U.S. Dollar's RSI and the Candlestick Price Chart are giving mixed signals.
So the Dollar looks to be playing a time game, it could change directions this week and break the upper falling trend-line of the channel or it could continue to trade inside it, time will tell.
In Review - continued
In the review chart below, you can see that the MACD was correct in its indications and the U.S. Dollar changed directions breaking its Descending Channel.
U.S. Dollar - This Week's Outlook
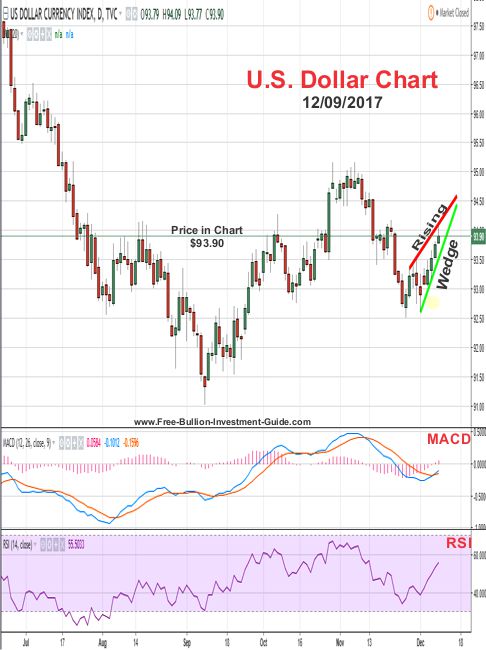
For the week ahead, the U.S. Dollar has formed a negative price pattern known as the 'Rising Wedge.'
In the chart below you can see that the 'rising wedge' is very narrow and although the MACD and RSI are indicating that it may continue to move up it in the beginning of the week a reverse in the U.S. Dollar's price isn't too far away in the future either.
So for the week to come, we may see the price of the dollar continue to move up before the FOMC meeting, but because of the narrowness of the wedge, the U.S. Dollar is expected to confirm the negative pattern sometime in the near future.
Charts provided courtesy of TradingView.com
U.S. Dollar's Price Resistance and Support Levels
U.S. Dollar's Resistance Levels
$95.00
$94.00
U.S. Dollar's Support Levels
$93.00
$92.00
SILVER
In Review
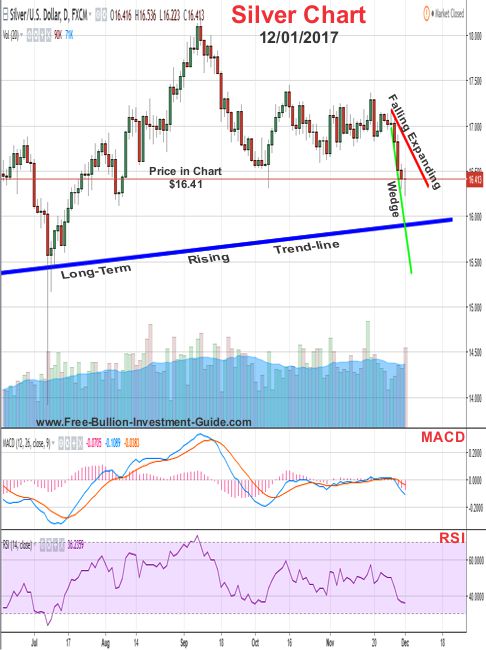
Below is silver's commentary and chart outlook from last week.
For silver's outlook, its chart has formed a steep Falling Expanding Wedge.
Because of the pattern's steepness, the price of silver could have a little further to fall, but its lower indicators are showing that the fall could be coming to an end.
In Review - continued
I was a little premature in my reading of the MACD, by viewing the chart above you can see that it was indicating the beginning silver's fall, not the end of it.
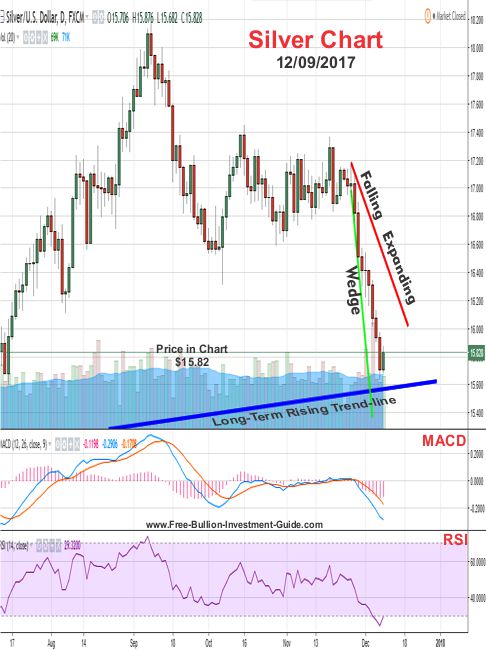
In review, you can see that in the chart below that silver fell in price for most of last week.
Silver - This Week's Outlook
For the week ahead, silver's RSI looks to have bottomed, but its MACD still looks like the price may move down a little further.
In addition, if you view the charts from the introduction of this post, you can see that silver often moves sideways the last two weeks of the year, so perhaps we'll see more of the same this year too?
However, we cannot forget that silver also has the positive price pattern looming over it (Falling Expanding Wedge) which is expected to be confirmed sometime in the near future.
Ultimately, we'll have to wait on time to see how all these factors play out.
Charts provided courtesy of TradingView.com
Silver's Price Resistance &
Support Levels
Silver's Resistance Levels
$17.00
$16.30
Silver's Support Levels
$15.55
GOLD
In Review
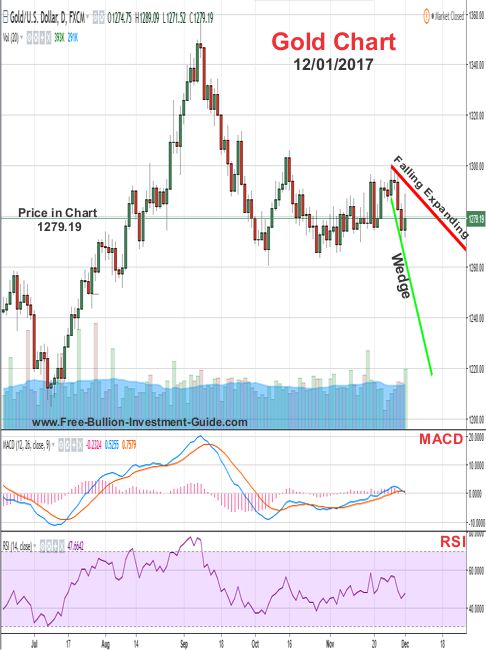
Below is the gold outlook from last week.
In the chart below, gold, like silver, has created a positive pattern known as a 'Falling Expanding Wedge.'
For the week to come, gold's MACD and RSI are moving in neutral zones, so there giving almost no indication as to which way gold will move, and because of the broadness of gold's 'Falling Expanding Wedge' it could literally move up or down this week.
However, the pattern is a positive sign in gold's chart, and it is expected to break the pattern sometime in the near future.
In Review - continued
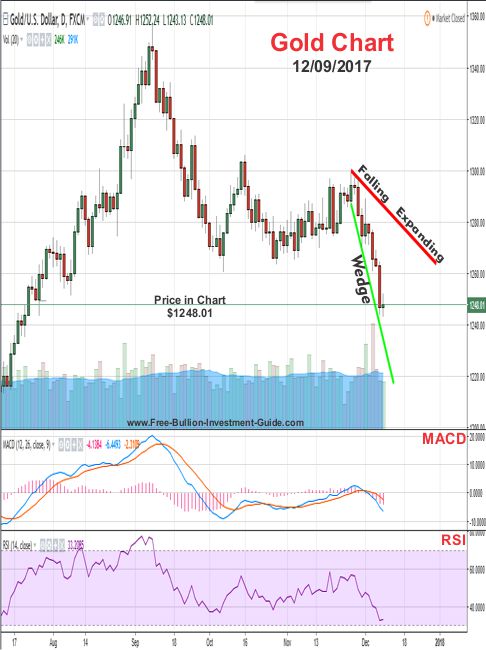
By looking at the gold chart below, you can see that the positive 'Expanding Falling Wedge' pattern is still intact, but for the week gold only moved in one direction "down."
Gold - This Week's Outlook
Like silver, gold's 'Falling Expanding Wedge' is still showing that a positive price change is expected to happen sometime in the near future.
However, gold's MACD and RSI are showing that more downside may be in its future.
I took a look back at how gold moved at the end of previous years, and like silver, it too moves mostly sideways until the new year begins.
So, it seems the price could go in any direction, but I'll be looking for a sideways movement in gold with an upward slant in the weeks to come.
Charts provided courtesy of TradingView.com
Gold's Price Resistance and
Support Levels
Gold's Resistance Levels
$1285.00
$1265.00
Gold's Support Levels
$1240.00
$1225.00
Thank You for Your Time.
Have a Great Week and God Bless,
Steve
'Click Here' see all of the prior Blog posts,
Thank You for Your Time!
|
Investment/Information Disclaimer: All content provided by the Free-Bullion-Investment-Guide.com is for informational purposes only. The comments on this blog should not be construed in any manner whatsoever as recommendations to buy or sell any asset(s) or any other financial instrument at any time. The Free-Bullion-Investment-Guide.com is not liable for any losses, injuries, or damages from the display or use of this information. These terms and conditions of use are subject to change at anytime and without notice. |
|
Support this Guide & Paypal Thank You for Your Support |
|
|
 | |||||

Ad Gloriam Dei
This website is best viewed on a desktop computer.
Keep this Guide Online
& Paypal
Thank You for
Your Support
with Feedly
Search the Guide
| search engine by freefind | advanced |
Premium Canadian Bullion
Give a lasting gift of the iconic Silver Maple Leaf bullion coin [More]
Free Shipping on Orders over $100 (CDN/USA)
or
From the U.K. Royal Mint


Daily
Newsletter
Updated Mintages for
American Gold Buffalo
American Gold Eagle
American Silver Eagle
2024 & 2025
Jerusalem of Gold Bullion
Coin photos
(bottom of page)
Mintages
for
2024
Gold & Silver Mexican Libertad
|
Gold Libertads |
Chinese Gold Coin Group Co.
& Chinese Bullion
Help Us Expand our Audience by forwarding our link
www.free-bullion-investment-guide.com.
Thank You!
Last Month's

In No Particular Order
December 2025
All Articles were Originally Posted on the Homepage


