Fundamentals are Fueling Precious Metals Higher
in their short-term trade
Precious Metals Review and Outlook from
8/21 thru 9/08/2017
Originally Posted on 09/04/2017 @ 9:02 pm
Last Edited (full post) on 09/05/2017 @ 12:05 pm
Last Edited (intro) on 09/07/2017 @ 11:31 am
by Steven Warrenfeltz
Subscribe to this Blog

Hello,
Thank you for visiting the Free-Bullion-Investment-Guide's latest blog post, I hope everyone has/had a Safe and Relaxing Labor Day Weekend.
It's been two weeks since the last precious metals review and outlook was posted, so before we get to this week's post, below are some of the Best Bullion Market-Related News articles that were taken from this guide's home page.

The Fed Just Admitted It No Longer Has a Clue What’s Going On - GoldSeek
Is It Time To Own Gold Or Bitcoin? - Forbes
Dollar slides against the euro after Draghi’s Jackson Hole speech - Market Watch
"Safe-haven" euro could complicate ECB plan to roll back stimulus - Reuters
Market thinks Fed could hold off on rate hikes for another year — at least - CNBC
Eight Days to Destruction - The Deviant Investor
Russia's Otkritie sub-debt, shares fall as bail-in fears return - Reuters
CENTRAL BANKS ARE HIDING THE TRUE PRICE OF RISK - Cobden Centre
Gold Logs 11-Month High, Ellis Island 5 oz Bullion Coin Launches - CoinNews
Bitcoin Investors, Beware: The IRS Is Coming for Your Vast Riches - The Street
Best of the Week for Gold NanoParticle Cancer Research
GOLD NANOPARTICLE : CANCER RESEARCH : Sharks with frickin' lasers: Gold nanoparticles fry cancer on glowing mice - PHYS.ORGGOLD NANOPARTICLE | CANCER RESEARCH : Faster, More Accurate and Portable Test for Liver Cancer Developed - Scicasts
GOLD NANOPARTICLE | CANCER RESEARCH : Nanolaser can detect, kill circulating tumor cells to prevent cancer metastases - NanoWerk

For the last few weeks, there have been many fundamental factors that have given support to the precious metals.
Many of these factors are included in the title's 'word collage' (above), four of the current events in the collage have made the biggest impact, they include:
1) on 8/25 - Mario Draghi the president of the European Central Bank made a speech at the Economic Policy Symposium, in Jackson Hole, Wyoming.
In the speech, he stated, to the effect, that he had an optimistic view of the European economy. This caused the Euro and Gold to rise because it is a possible sign that the ECB will soon 'taper' or halt its form of Quantitative Easing, which will make the euro rise against the U.S. dollar.
Dollar slides against the euro after Draghi’s Jackson Hole speech - Market Watch2) on 8/28 - North Korea launched a missile over Japan, it is
self- explanatory as to why this event would cause traders to hoard safe
haven asset; heightened military actions will always cause a spike in
precious metals.
3) on 9/01 - U.S. Job Growth slowed to 156,000 jobs created in August. This gave support for the precious metals because it gave traders more reasons to believe that the Federal Reserve will not raise interest rates at their September meeting. There are other economic indicators that show this will likely not happen in September - most notably the low inflation numbers.
Gold at near 10-month high after U.S. jobs growth slows - Reuters4) 8/25 to present - Hurricane Harvey; Hurricanes and other natural disasters don't often affect gold and other precious metals directly.
But it's the before and after effects of their destruction that is what fuels the precious metals market.
For instance, gold moves up in this case because natural disasters add more uncertainty and volatility to the markets.
Plus, in this case, palladium has moved higher because of all the gasoline powered cars that will need to be replaced due to Harvey's flooding in Texas. Palladium is the primary element used in Catalytic Converters for gasoline engines.
The chart below shows you how these current events have affected gold.

There are other storm clouds on the horizon that look positive for safe haven assets, they include but are not limited to the coming U.S. debt limit, North Korea, the Fed's September Meeting (9/19-9/20), Hurricane Irma, and the rising uncertainty in the market.
Now, speaking in terms of 'Technically Analysis,' in this week's review and outlook, only two of the patterns in the charts from two weeks ago have been broken (confirmed or denied).
This means that most of the precious metal price charts still have negative patterns looming over them, so a price correction is expected when fundamentals stop fueling the price of the precious metals higher.
This week's chart analysis include gold, silver, U.S. Dollar, platinum, palladium, GDX - Gold Miners ETF, and the HUI - Gold Bugs Index.
GOLD
In Review
Below is last week's outlook for gold.

For the week to come, gold is still trading inside the larger 'Rising Expanding Wedge' that formed in its price chart over a month ago.
This means that although the price has continued to move up, the negative pattern is still looming over it and will continue to do so until it is either confirmed or denied.

In Review - continued
As you can see in the chart below, even though the price of gold is still trading inside the negative 'Rising Expanding Wedge,' fundamentals have fueled it up past its resistance of $1300.
Note: The gold chart's pattern (below) has been slightly adjusted to include a recent low in the price that happened the day before it broke the $1300 resistance level. (you can see the adjustment by comparing the chart above with the one below.)

Gold - This Week's Outlook
The chart below is expanded to show you the next major resistance level for gold, prices haven't reached this level since after the Brexit vote in late June of 2016.
As you can see in the chart above and below, the price of gold has continued its steep climb in price, but gold's RSI (lower indicator) is trading well in the over-bought territory.
On the other hand, gold's MACD (lower indicator) hasn't moved that high, so we may see some consolidation then another move up, it mostly depends on what happens in the news this week that will determine gold's movement.
However, caution should be in the air for any 'established asset' that rises this high, this fast, meaning that the price of gold is expected to confirm the negative influence of the 'rising expanding wedge' sometime in the future.
Time will tell when that time comes.

Charts provided courtesy of TradingView.com
Gold's Price Resistance and
Support Levels
Gold's Resistance Levels
$1380.00
$1350.00
Gold's Support Levels
$1300.00
$1280.00
SILVER
In Review
Below is the silver commentary and chart from this guide's post two weeks ago.
For the week to come, silver's price chart has formed a 'Rising Wedge' another negative pattern.
The wedge looks like silver may still find some space to trade inside it, but Silver's RSI looks like it's going to be changing directions, time will tell how or when this pattern will be confirmed or denied.

In Review - continued
As you can see in the chart below, silver's RSI (relative strength index) did not change directions, instead silver has continued to move up in price helping the RSI 'rise' as the price continues to trade inside the rising wedge,
Silver - This Week's Outlook
In the silver chart below, the 'Rising Wedge' pattern has been slightly adjusted, I moved the top trend-line to the next higher high (If you compare the top and bottom chart you can see the difference in the origin of the upper trend-line)
However, I noticed that if I moved the upper and lower trend-lines back to Silver's low (in the chart) that silver's price is in a very narrow ascending channel.
I did not show the ascending channel in the chart below because the 'Rising Wedge' has not been confirmed or denied.
So, we'll see this week if Fundamentals continue to move the metal higher, denying the expectation of negative Rising Wedge pattern, or fall in price confirming it.

charts provided courtesy of TradingView.com
Silver's Price Resistance &
Support Levels
Silver's Resistance Levels
$18.00
$17.75
Silver's Support Levels
$17.00
$16.50
US DOLLAR
In Review
Below is the U.S. Dollar's commentary and chart from two week ago.
There isn't much to say about the dollar's movement for the short-term except that it looks like we can expect more of the same as it moves sideways, closer towards the upper trend-line of the positive wedge.

In Review - continued
In the chart below, the U.S. dollar has continued to move sideways with a downward slant.

Charts provided courtesy of TradingView.com
U.S. Dollar - This Week's Outlook
In the U.S. Dollar's chart above, no clear patterns have formed out of last week's move, but the U.S. Dollar's lower indicators (MACD & RSI) look like the price may be ready to move up, bringing it closer to the upper trend-line of the 'Falling Expanding Wedge.'
U.S. Dollar's Price Resistance and Support Levels
U.S. Dollar's Resistance Levels
$94.00
$93.00
U.S. Dollar's Support Levels
$92.00
Platinum
In Review
Two weeks ago, I didn't have much to say about Platinum, but below is the commentary and chart from that post.
It's been since late July that I've posted anything for Platinum.
This week, like gold, platinum has formed a negative 'Rising Expanding Wedge.'
So, for the week to come, platinum's MACD and RSI are both giving the indication that the price could be about to roll over, time will tell.

In Review - continued
The price of platinum didn't roll-over like I stated it might do from what the MACD and RSI seemed to be indicating, instead the price, fueled by fundamentals, continued to climb.

Charts provided courtesy of TradingView.com
Platinum - This Week's Outlook
For the immediate future, gold, silver, and platinum charts are all indicating that we are witnessing a tug of war between fundamentals and technical analysis.
Fundamentals are helping the price of the precious metal move higher, but the 'Rising Expanding Wedge' in Platinum's chart is looming over the price in a negative way.
Time will ultimately judge the outcome.
Platinum's Price Resistance and Support Levels
Platinum's Resistance Levels
$1045.00
$1015.00
Platinum's Support Levels
$990.00
$975.00
Palladium
In Review
Below is palladium's commentary and chart from two weeks ago.
Like platinum, it's been since late July since I've posted any charts for palladium.
Palladium is still rising inside a nearly two-year old 'Ascending Channel' and it has been generally trading up over the last 3weeks.
This could easily continue, however, it has formed a 'Rising Expanding Wedge' just like the other precious metals and sometime in its future, it is expected to fall below the bottom of the wedge.
Although palladium overall price direction is expected to be positive as long as it trades inside the 'Ascending Channel.'

Below is another view of the rising wedge in Palladium's chart and its nearly two year old 'Ascending Channel.'

In Review - continued
By looking at the chart below, you can see that palladium 'denied' the expected result of the 'Rising Expanding Wedge,' this is because 'Fundamentals always trump Technical Analysis.'
Late last week, after the automakers stated they were looking to forward to replacing the flooded vehicles of Hurricane Harvey, palladium popped up in price because it is the primary metal element in gasoline catalytic converters.

Charts provided courtesy of TradingView.com
Palladium - This Week's Outlook
Now that Palladium has broken the 'Rising Expanding Wedge, palladium looks like it may try to break through the top of the Ascending Channel.
So, because of palladium's price action, I'm going to take a 'wait and see' stance on the precious metal.
Plus, with the fact that Hurricane Irma is expected to hit the United States sometime in the next 7-days, palladium's price will likely continue to be volatile and very hard to predict.
Palladium's Price Resistance and Support Levels
Palladium's Resistance Levels
$1000.00
Palladium's Support Levels
$950.00
GDX - Gold Miners ETF
For the GDX, I originally did a review and outlook for it over two months ago. Below is the chart from that review; click here to see the full blog post (Note: the GDX commentary is at the bottom of the post)
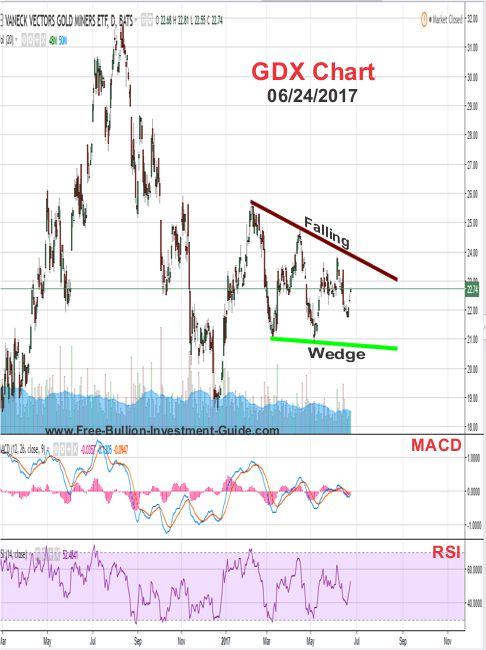
Then about 3 weeks ago, I read this post by Morris Hubbart 'here.'
On his GDX chart 'here,' he stated that the GDX had broken out of the 'falling wedge' in his chart, so I showed you my take of the charts below that indicated the breakout had not happened yet.
Trading View GDX Chart

Stock Charts GDX Chart

GDX - review
Below is the GDX's commentary and chart from two weeks ago.
As you may have guessed, last week I kept a close eye on the GDX chart to see what it would do.
The
GDX has never closed a day of trading above the upper trend-line of the
'Falling Wedge' and in my experience that is the only time you can
confirm or deny a technical pattern.
I did not check to see what Morris Hubbartt posted this week, but according to my charts, the GDX price has not confirmed nor denied the 'Falling Wedge' yet, but I'll update you when it does.
Until that time comes, you can expect the GDX to continue to trade inside the 'Falling Wedge.'

GDX - Update
A falling wedge is a positive pattern, and a little over a week ago, the GDX finally confirmed it for me and Mr. Hubbart.

Charts provided courtesy of TradingView.com
HUI - Gold Bugs Index
On July 24th's blog post 'here,' I posted the following review and chart for the HUI - Gold Bugs Index
A few week’s ago, I wrote that I would start studying random charts that relate to the precious metals sector.
At the bottom last week’s review and outlook (here), I updated you on the GDX – Gold Miners ETF, this week I’m going to focus on the HUI – Gold Bug’s Index.
The chart below is of the HUI, which looks very similar to the GDX chart from last week; Coincidence? Doubtful.
The HUI and the GDX both have falling wedges in their charts which are positive signs, meaning that both prices are expected to rise above the upper falling trend-line of the wedge.
When this happens is anyone’s guess, but when it does I’ll follow up on it.

HUI - update
In the chart below, you can see that like the GDX, the HUI also confirmed its falling wedge.
Both the HUI and GDX charts aren't showing any pattern for the week to come, but I'll keep an eye on them in the weeks to come and when I see something, I'll share it with you.

Charts provided courtesy of TradingView.com
Music
I haven't posted any music at the bottom of my posts since I posted a tribute to Chris Cornell in mid/late May.
But a few days ago Walter Becker died, he was a founding member of Steely Dan, one of my favorite bands from the 70's.
So I couldn't end this post without acknowledging him and his work; Thank you, Walter, for all the great music you created, Rest in Peace.
In the video, Walter Becker is the one playing the bass guitar behind Donald Fagan the singer and pianist, also in the video's intro, Dick Clark offers some good background about Steely Dan including where they got their name.
Steely Dan - My Old School
Thank You for Your Time.
Have a Great Week.
God Bless, Steve
'Click Here' see all of the prior Blog posts,
Thank You for Your Time!
Investment/Information Disclaimer:
All content provided by the Free-Bullion-Investment-Guide.com is for informational purposes only. The comments on this blog should not be construed in any manner whatsoever as recommendations to buy or sell any asset(s) or any other financial instrument at any time. The Free-Bullion-Investment-Guide.com is not liable for any losses, injuries, or damages from the display or use of this information. These terms and conditions of use are subject to change at anytime and without notice.
|
Support this Guide & Paypal Thank You for Your Support |
|
|
 | |||||

Recent Articles
-
Newsletter of the Free Bullion Investment Guide - April 2026
Apr 05, 26 04:44 PM
 The April 2026 newsletter of the Free Bullion Investment Guide provides the latest updates, fundamental and technical gold and silver market analysis, the best articles from last month, and a list of…
 -
Newsletter of the Free Bullion Investment Guide - February 2026
Feb 07, 26 02:12 PM
 The February 2026 newsletter of the Free Bullion Investment Guide provides the latest updates, fundamental and technical gold and silver market analysis, the best articles from last month, and a list…
 -
Newsletter of the Free Bullion Investment Guide - January 2026
Jan 07, 26 04:07 PM
 The January 2026 newsletter of the Free Bullion Investment Guide provides the latest updates, fundamental and technical gold and silver market analysis, the best articles from last month, and a list o…
 -
Newsletter of the Free Bullion Investment Guide - December 2025
Dec 07, 25 04:35 PM
 The December 2025 newsletter of the Free Bullion Investment Guide provides the latest updates, fundamental and technical gold and silver market analysis, the best articles from last month, and a list…
 -
Newsletter of the Free Bullion Investment Guide - November 2025
Nov 08, 25 01:58 PM
 The November 2025 newsletter of the Free Bullion Investment Guide provides the latest updates, fundamental and technical gold and silver market analysis, the best articles from last month, and a list…

18W LED Security Light (Dusk to Dawn & Motion Sensor) - $32.99
from:
 LED Lighting

) (as of March 11, 2011)")
This website is best viewed on a desktop computer.
Keep this Guide Online
& Paypal
Thank You for
Your Support
with Feedly
Search the Guide
| search engine by freefind | advanced |

Give a lasting gift of the iconic Silver Maple Leaf bullion coin [More]
Free Shipping on Orders over $100 (CDN/USA)
The Sovereign 2026 Gold Bullion Coin in Card

Britian's
Royal Mint

Daily
Newsletter
Mintages & Photos
|

|
Silver Panda |

Mintages
for
2024
Gold, Silver, & Platinum
Austrian Philharmonic Bullion Coins

|
Silver Philharmonics  |
Platinum Philharmonics

Platinum and Palladium Bullion


Mintages
for
2025
Gold & Silver Mexican Libertad
|
Gold Libertads |


Updated Mintages for
American Gold Buffalo
American Gold Eagle
American Silver Eagle
2024 & 2025
Jerusalem of Gold Bullion
Coin photos
(bottom of page)
 Obverse side")


Help Us Expand our Audience by forwarding our link
www.free-bullion-investment-guide.com.
Thank You!
Last Month's

In No Particular Order
April 2026
|
All Articles were Originally Posted on the Homepage Gold Nanoparticle Cancer ResearchSona Nanotech’s Hyperthermia Platform Boosts Immunotherapy Response in Colorectal Cancer Study - Tipranks Sona Nanotech Showcases Cancer Therapy Results At Prestigious Industry Cancer Conferences - Financial Times Development of gold nanostars coated with mesoporous silica for chemo-photothermal therapy - Published Research Paper - Journal of Drug Delivery Science and Technology (Science Direct) |
All Articles were Originally Posted on the Homepage