Homepage / Archived News or Quarterly News / 3rd Quarter 2014

ExpressGoldCash - 4.9 star - Customer Reviews
3rd Quarter - 2014
Charts, Bullion News & Commentary
Learning from the past is a useful way to judge price movement in the future when investing in any market.
This page provides a comprehensive overview of gold, silver, platinum, and palladium during the quarter.
For each of the precious metals, you'll find charts. Below the charts, you will find Bullion News Headlines from the 3rd Quarter of 2014. Every news link was originally posted on this guide's homepage.
The quarterly charts provide insight into the volatile precious metals markets, while the news below the charts provides a deeper understanding of the fundamentals influencing these markets.
The charts below are provided courtesy of
USD / Gold Price Charts -
3rd qtr. 2014
The two quarterly charts below are a side-by-side comparison of the U.S. Dollar Index and the Gold Price, they typically move in opposite directions.
Watching what the U.S. Dollar is doing is often a way to judge what Gold will do; this isn't always the case, as you can see in the charts below, and if you check the two charts today, it is likely the two are moving in separate directions.

Bullion News
Gold Price Charts - 3rd qtr. 2014
Gold Price Summary
The price of gold during the 3rd quarter of 2014 generally followed one direction: down.
In the quarterly chart (below), the first breakdown in price is pointed out by the shaded horizontal purple bar.
The 'Golden cross' at the beginning and the 'Death cross' near the end of the quarter proved to be insignificant indicators of gold's price movement.
You can see in the highlighted purple bar at the beginning of the quarter that the RSI and MACD show that the gold market had reached the top and was about to change direction. In addition, the RSI and MACD also showed late in the quarterly chart that a positive change in gold's price was imminent.
(continued...)
Gold Price Chart (July 1st, 2014 - September 30th, 2014)

Bullion News
Gold Price Chart (July 1st, 2013 - September 30th, 2014)

Gold Price Chart (October 1st, 2011 - September 30th, 2014)

Bullion News
Gold Price Summary (continued)
In conclusion, it looks like the gold chart is making either a triple top or a triple bottom; it depends on whether the price holds above its support level of $1180.00 a troy oz. Only time will determine which way Gold will go.
(Click either chart below to go to Investopedia's page on Triple Tops and Bottoms to understand them better)
 |
 |
Source: Triple Top & Triple Bottom Charts provided courtesy of Investopedia
Silver Price Charts - 3rd qtr. 2014
Silver Price Chart (July 1st, 2014 - September 30th, 2014)

Bullion News
Silver Price Summary
Like gold, silver's price fell consistently during the 3rd quarter of 2014.
The "Golden Cross" in the quarter was a false indicator of the price of Silver, and the 'Death Cross' was simply a late indication of the direction of Silver's price.
Both the RSI (Relative Strength Indicator) and the MACD showed that silver was overbought at the beginning of the 3rd quarter of 2014; in addition, both indicators showed that the price of silver was going to change direction and fall in price.
The big surprise for Silver's Price in the 3rd quarter of 2014 was the Broken Support Price level of $18.00 during the quarter. This broken support level for Silver has now become a resistance level, creating a new hurdle that Silver's price must overcome to demonstrate positive movement to investors.
Silver Price Chart (October 1st, 2013 - September 30th, 2014)

Bullion News
Silver Price Chart (October 1st, 2011 - September 30th, 2014)

Bullion News
Silver 10-year chart
Since Silver broke its long-standing support level of $18.00 a troy ounce, its new support holds at $15.00 a troy ounce.
The $15.00 support level was last touched by Silver in 2010, right before Silver started its move towards $49.00 a troy oz. (highlighted in the 10-year chart below)
Silver Price Chart (January 1st, 2004 - September 30th, 2014)
")
Silver 10year chart provided by TradingView.com
Platinum Price Charts - 3rd qtr. 2014
Platinum Price Chart (July 1st, 2014 - October 30th, 2014)

Bullion News
Platinum Price Summary
Last quarter, the price of Platinum was moving higher, and its price was getting squeezed in a negative rising wedge pattern. The squeeze in the wedge broke shortly after Platinum's price briefly moved above the $1500 resistance level.
The movement in platinum's price was surprising since the metal had been rallying. There were signs that more platinum supplies were going to be coming back online after platinum miners ended their strike in South Africa. Most observers anticipated a pullback, but not to the extent of the price decrease.
Early in the quarterly chart (above), you can see that both the RSI (upper indicator) and MACD (bottom indicator) sloped downward, right after platinum's price peaked for the year.
Late in the quarter, you can see the MACD's Histogram (blue bar chart) shortening and the RSI bottoming (highlighted in the chart above), indicating that a price change is about to happen.
The MACD's Histogram measures the difference between the Signal Line (Red Line) and the Black line.
Platinum Price Chart (October 1st, 2013 - September 30th, 2014)

Bullion News
Platinum Price Chart (July 1st, 2011 - June 30th, 2014)


Palladium Price Charts - 3rd qtr. 2014
Bullion News
Palladium Price Summary
From July to late August, the price of Palladium slowly crept up to prices it hadn't seen since 2001, and then in early September, the price collapsed. However, the price of Palladium was able to hold above the levels it reached when the price was squeezed during the 1st Quarter of 2014.
Palladium was the only precious metal able to fight off the selling of precious metals until later in the quarter. In addition, as long as the U.S. dollar stays up in price, it will continue to hold the prices of precious metals down.
Palladium Price Chart (July 1st, 2014 - September 30th, 2014)

Bullion News
Palladium Price Chart (October 1st, 2013 - September 30th, 2014)

Bullion News
Palladium Price Chart (October 1st, 2011 - September 30th, 2014)

The charts above are provided courtesy of
ExpressGoldCash - 4.9 star - Customer Reviews
3rd Quarter - 2014
Bullion News & Commentary
The Quarterly News starts with the end of the quarter articles, first.
Please note that not all of the links below work; the links are kept because the headlines still provide insight into how the markets were moving at the time.
09/30/14 - Bullion News
Money and Markets - Major Foreign Currencies Collapsing as U.S. Vs. World Policy, Growth Gap Grows!
TECHNICAL ANALYSIS : The Bullion Desk - Gold – Breakout pressure continues to build
TECHNICAL ANALYSIS : Kimble Charting - New “Deflationary Ball Game” just starting to pick up speed?
TECHNICAL ANALYSIS : CEO.CA - Is Silver Heading to $15?
Gold-Eagle - Why China Thinks Gold Is The Buy Of The Century
BullionStar - China Aims For Official Gold Reserves At 8500t
Zero Hedge - Why Is China Hoarding Gold? Alan Greenspan Explains
Contra Corner - Uncle Sam’s $8 Trillion Annual Debt Churn: Why Washington Is Pertrified Of Honest Interest Rates
VIDEO : CNBC - Santelli Exchange: 'Politics' vs. central banks
The Gold Report - Jay Taylor Urges Investors to Stay Liquid for the Coming Gold Boom
VIDEO : CNBC - Bacon Cheeseburger Index: The real inflation gauge
09/29/14 - Bullion News
TECHNICAL ANALYSIS : Market Anthropology - The Inverse Symmetry of Market Reflexivity - Gold & Silver's Inverse Symmetry with the US Dollar & the 10 Year Treasury Note
CoinNews - Gold Climbs from 2014 Low; US Mint Bullion Coins Gain
VIDEO : CNBC - Is the Fed 'in trouble'...
The Prudent Bear - The Bear's Lair: Fed policy makes spendthrifts of us all
Bloomberg - Draghi Devaluing Euro Cheers ECB as Inflation Seen Fading
The Sydney Morning Herald - Gold price: The world's wealthy are snapping up bullion
Dollar Collapse - Does Surging Demand For Gold & Silver Coins Signal a Bottom?
Bullion Vault - Gold/Silver Ratio Leading the Dollar
Shanghai Daily - New gold exchange aims to catapult China into ranks of global bullion centers
Bullion Star - Chinese Gold Demand Explosive
International Man - The Mexican Libertad: The Currency Solution?
GoldSeek - Russia’s Gokhran Buying Gold Bullion In 2014 and Will Buy Palladium In 2015
Sovereign Man - No, America isn’t Communist. It’s only 70% Communist.
09/28/14 - Bullion News
GoldSilverWorlds - Gold Investors Weekly Review
Bullion Vault - Cash Starved Mining Stocks Go Bang
CHART : ReadtheTicker - SP500 down hard, the real reason
Contra Corner - Peak Debt—-Why The Keynesian Money Printers Are Done by David Stockman
VIDEO : Peak Prosperity - Demographics - Crash Course Chapter 15
Bloomberg - Dollar Heads for Best Month Since 2012 as Central Banks Diverge
MoneyNews - Fed's Fisher: US Risks Falling behind Curve on Inflation
AUDIO : McAlvany Weekly Commentary - Too Big NOT to Fail!
Profit Confidential - The Flight Back Down to Reality Ahead for the Rich
Forbes - Transacting in Gold Can Shaft The IRS
Sovereign Man - Yet another reason why FATCA is utterly retarded
09/26/14 - Bullion News
Gold Chat - Gold bottom update
GoldReporter - German Bullion Dealers Report Major Increase in Sales
BullionStar - The Workings Of The Shanghai International Gold Exchange, Part One Global Financial Intelligence - THE (BIG) PROBLEM OF HAVING A CENTRAL BANK - Google Translation Link
The Deviant Investor - Gold, Silver, Fish Lines, and Rhino Horns
The Telegraph - Cheapest way to buy Royal Mint gold? Not from the Royal Mint
New York Post - Tapes showing meek oversight of Goldman are about to rock Wall Street
MineWeb - LBMA names Citigroup as gold/silver market maker
TECHNICAL ANALYSIS : Kimble Charting - Bill Gross & Pimco fund sending kiss good-bye message?
The Independent - The Seaton Down Hoard: Amateur metal detector uncovers 22,000 Roman coins
09/25/14 - Bullion News
Future Money Trends - Has The Gold Price Drop Run Its Course?
TECHNICAL ANALYSIS : DecisionPoint - GOLD: Possible Triple Bottom
AUDIO : FSN - Danielle Park – Debt Fueled “Growth” Running Out of Gas
Reuters - U.S. Mint American Eagle gold coin sales set to rise sharply in Sept
SLIDESHOW : Visual Capitalist - A Year’s Extraction of Metal Shown Next to Landmarks and Cities
Reuters - Gold Price Seen Near Tipping Point for Mine Cuts, Closures
BDlive - China Seems to Appreciate True Importance of Gold
TECHNICAL ANALYSIS : SOLARCYCLES - Increasing Deterioration
Trader Dan's Market Views - Stock Market Weakness Brings Safe Haven buying into Gold, Bonds
REWIND : The Washington Post - What if a typical family spent like the federal government? It’d be a very weird family.
The Bullion Desk - Platinum and Palladium Struggle Despite Positive Fundamentals
Profit Confidential - A Rational Look at Gold
Nanotechweb - Gold NPs Kill MDR Bacteria

Affiliate Ad
09/24/14 - Bullion News
TECHNICAL ANALYSIS : SafeHaven - Strong Dollar Pressures Gold
Market Watch - Opinion: Gold May Rebound as Extreme Bearishness Sets In
Coin Update - RCM Introduces “Maplegram25? Innovative One Gram Gold Bullion Coin Product
Monetary Metals - A Monetary Cancer Metastasizes in Europe
GoldandSilverWorlds - Gold Price Outlook - Bullish/Bearish Factors
Bloomberg - BofA checks Venezuela’s gold vault to calm investors
SRSrocco Report - Shanghai Silver Stocks Continue To Fall As Silver Eagle Sales Explode Higher
Market Realist - Everything You Need to Know About Gold and Gold Companies (Parts 1 - 20)
Gold-Eagle - How Much Gold Is Really Out There? ...Not Enough!
CHARTS : Advisor Perspectives - NYSE Margin Debt Drifts Higher in August
Zero Hedge - The Chart No Fed-Loving Equity Bull Wants You To See
Money and Markets - More on Gold and the World Fire That’s Brewing...
The Strait Times - "Asia's first" gold-dispensing ATMs installed in Singapore
09/23/14 - Bullion News
TECHNICAL ANALYSIS : Gold-Eagle - The Golden Kiss
The Bullion Desk - Precious metals under pressure but shorts looking stretched
Market Realist - Gold dilemma: Should you invest in physical gold or gold stocks?
Resource Investor - Gold American eagle coins soar
TECHNICAL ANALYSIS : The Next Big Trade - Gold and Silver are Dramatically Oversold...But May Fall Further
The Deviant Investor - Silver, Gold, Debt & Taxes
TECHNICAL ANALYSIS : TheGoldandOilGuy - Leading Sectors Breaking Down – Internet & Social Stocks
Market Anthropology - Dollar Hollers - What does it say?
MoneyBeat (WSJ) - Here Are the Top 20 Biggest Buybacks
The New York Times - Charles Plosser and Richard Fisher, Both Dissenters, to Retire From Fed
Business Insider - 19 Of The Most Expensive Substances In The World
09/22/14 - Bullion News
The Next Big Trade - Notes on Carnage in Gold and Silver
The Gold Report - Tell Us, Christos Doulis, Can Gold Act as a Safe Haven Again?
INFO~GRAPHIC : The Austrian Insider - Keynesian vs. Austrian Economics
TECHNICAL ANALYSIS : Kimble Charting - Silver- Why the $15 Level Looks Like a Good Buy Point.
Bullion Vault - Gold Bullion "Seeking Base, Nears $1180 Double-Bottom" as Silver Bears Outweigh Physical Bulls at 4-Year Lows
Sovereign Man - Silicon Valley insider: “If 2000 was a bubble factor of 10, we are at an 8 to 9 right now.”
arabian money - US households most heavily invest in stocks since 2000
Blanchard - Fitch warns of “a negative shock that erodes the role of the U.S. dollar”
GoldCore - China Moves To Dominate Gold Market With Physical Exchange
The Independent - Royal Mint puts its gold bullion up for sale
VIDEO : Bloomberg - Silver Presents a Great Buying Opportunity: Horwitz
CNBC - Billionaires are hoarding piles of cash
Billionaire - Smart Gold ATMs Get Singapore Lift-off
09/21/14 - Bullion News
The Daily Bell - Weekly Gold Trend Analysis: King Dollar Squeezes Gold
VIDEO : Peak Prosperity - Assets & Liabilities - Crash Course Chapter 14 - Why the US is deeply insolvent
TECHNICAL ANALYSIS : Olivier Tischendorf (Twitter) - SILVER Monthly chart $15 area 'Price Magnet' analysis.
VIDEO : TruthNeverTold - Silver Warning Of Market Crash October?
South China Morning Post - Established rivals may keep Shanghai trade zone's gold exchange in check
BullionStar - Chinese Gold Demand 41t in week 37, 1331t YTD
TECHNICAL ANALYSIS : Rick Ackerman - Technical Analysis for Gold and Silver Futures - Silver & Gold Analysis starts @ 12:27 mark
Bloomberg - Gold Bulls Extend 2014 Exit as Slump Erases $6.7 Billion
Seeking Alpha - Afraid Of The Plummeting Gold Price? Russia Certainly Is Not
MineWeb - The Future for Gold is Physical
Trader Dan's Market Views - Speculators Remain Net Long as Gold Drops Lower
VIDEO : CNBC - Here a bubble, there a bubble: Ol' Marc Faber
Wealth Daily - Buy Gold to Hedge Against Currency Manipulation
Kid Dynamite - The Fine Print in the FOMC Docs That You Probably Weren’t Aware Of...
09/19/14 - Bullion News
Daily Resource Hunter - Why the Federal Reserve Will Launch Another Round of QE
INFO~GRAPHIC : Visual Capitalist - Missing Money: Uncle Sam’s Accounting is Suspect
Midas Letter - The Mother of all Bubbles and Other Unpopular Realities
CHARTS : Advisor Perspectives - Market Cap to GDP: The Buffett Valuation Indicator
PLATA - The Tribute the World Pays to the Empire
Bullion Vault - Bad News for Gold from the Strong Dollar
GoldMoney - The End of Tapering and Government Funding
Forbes - Amazingly The US Mint Loses Money On Making Money
CoinNews - American Silver Eagle Production at West Point Mint
The Globe and Mail - The bullish case for gold prices? Add me to the skeptics
NewsMax - The Growing Popularity of Gold IRAs
MineWeb - At least 15 firms seeking to run new London gold fix

09/18/14 - Bullion News
TECHNICAL ANALYSIS : CEO.CA - Double-Bottom for Gold?
MoneyBeat (WSJ) - If Scotland Splits, What Happens to the Gold?
Gold Chat - Gold bottoming?
TECHNICAL ANALYSIS : Gold Prices - Monetary Policy Weighs on Precious Metals
The China Post - Zimbabwe signs US$3 bil. platinum mining deal with Russian gov't and investors
The China Money Report - China opens gold market to foreigners, seeks to block price fixing by Western Banks
South China Morning Post - Hong Kong secures nod for Qianhai metal vault
TECHNICAL ANALYSIS : The Deviant Investor - Silver: A Collapse and a Rally
Sprott Thoughts - Eric Sprott: Get Your Money ‘Out of Banks and into Something Tangible’
The Telegraph - Super-rich rush to buy 'Italian Job' style gold bars
Profit Confidential - Should You Buy Into the U.S. Dollar Rally?
Numismaster - Loyal buyers buoy 5-ounce silver coin series
09/17/14 - Bullion News
Market Watch - To see inflation, you have to open your eyes
Financial Sense - Can Gold Finally Recover?
CHART : GoldBroker - US Debt vs Gold
AUDIO : McAlvany Weekly Commentary - Volatility, Volume & Seasonal Vulnerability & Gold - Is an Insurance Investment for Your Money
South China Morning Post - China may boost gold reserves amid asset imbalances
AUDIO : MisesEconomicsBlog - Thornton: ‘US-Russia political tensions will speed up demise of dollar’
Zero Hedge - End Of Empire - The 'De-Dollarization' Chart That China And Russia Are Banking On
Bullion Vault - Shanghai Gold Trading: The Real Challenge to London
TECHNICAL ANALYSIS : Kimble Charting - Gold bugs index is about to breakout from this pattern
Peak Prosperity - The Dollar May Remain Strong For Longer Than We Think
Market Watch - Scotland ready to call London’s bluff over sterling
VIDEO : Perth Mint Blog - New Australian Kangaroo Gold Bullion Coins Available Now
TECHNICAL ANALYSIS : Don't Ignore This Chart - Would a Russell 2000 Death Cross Really be Bad?
09/16/14 - Bullion News
TECHNICAL ANALYSIS : GoldSilverWorlds - Cycle Analysis Supports Both Bearish and Bullish Views On Gold and Silver
VIDEO : U.S. Global Funds - Frank Holmes : All Eyes Are On Yellen
VIDEO : CNBC - Sterling to plummet if Scotland votes Yes
Bloomberg - Scotland Gold Demand Seen Rising Before Independence Vote
HEXAPOLIS - Electronic skin made from gold nanoparticles and polymer, can detect breast cancer
VIDEO : Bloomberg - India Gold Imports Up 176% on Year
Reuters - China advances gold exchange launch, Singapore delays contract
AUDIO : Silver Investor - David Morgan interviewed by Butler On Business
TECHNICAL ANALYSIS : Financial Sense - Last Stand Approaching for Gold
PD&D - Is 3D Printed Gold the Future of Jewelry?
Bullion Vault - Switzerland's Gold Vote
TG Techno - Research on how Gold Nanoparticles can destroy Super Bacteria featured on Popular Mechanics

09/15/14 - Bullion News
TECHNICAL ANALYSIS : CEO.CA - US Dollar Most Overbought Since 2010
NEXT BIG TRADE - U.S. Dollar Due for a Rest
Money Morning - The Real Reason the Federal Reserve Is Afraid to Raise Interest Rates
The Telegraph - Anxious Scottish investors buying gold
Business Insider - Europe's Biggest Bear Warns The Pound Could 'Plunge Into The Abyss' If Scotland Goes Independent
The Bullion Desk - Real Rates, Gold & the ‘know nothing’ Fed – ADRIAN ASH
The Bullion Desk - CONTRIBUTOR STORY: Real Rates, Gold & the ‘know nothing’ Fed – ADRIAN ASH
Shanghai Metals Market - CME to Launch Asia Gold Contract as Race for Pricing Power Heats Up
TECHNICAL ANALYSIS : The Deviant Investor - The Silver Sentiment Cycle
Kingdom Economics - Jim Rickards warnings – mostly right on!
International Man - Babson’s Warning
Houston Chronicle - Using Gold to Fight Cancer
Greek Reporter - Greek Man Takes Gold Coins to The Grave
09/14/14 - Bullion News
Market Watch - Low volatility is a sign of high risk-taking, BIS official says
TECHNICAL ANALYSIS : SOLARCYCLES - Gold Market Update
INFO~GRAPHIC : Zero Hedge - Inflation Watch: How Much $1 Used To Get You!
AUDIO : FSN - John Rubino – Real Interest Rates and Future Chaos
CoinWeek - As Legal Issues Mount, Merit Gold Customers Seek Relief
The Bullion Desk - GOFO – One-year gold at widest contango in over a year
BullionStar - Chinese Gold Demand 39t In Week 36, YTD 1290t
VIDEO : Peak Prosperity - Debt - Crash Course Chapter 13
The New York Times - Student Loan Debt Burdens More Than Just Young People
TECHNICAL ANALYSIS : Kimble Charting - Junk bond fund repeating 1999 & 2007's pattern?
09/12/14 - Bullion News
McClellan Oscillator - Gold - Watch the €1000 Level
CEO.CA - Gold at Lowest Sentiment Levels Since June 2013 Bottom
CHARTS : GoldBroker - Gold vs Currencies of Countries in Crisis
Economic Noise - Fiat Currency vs. Gold
GoldMoney - Market Report: Strong dollar undermines precious metals
The New Zealand Herald - Nano-tech boom looming, says Akl scientist
OilPrice - Here's A New Update in India's Gold Saga
The Sovereign Investor - Next Week’s Fed Meeting Could See a Rise in the Dollar
Scrap Monster - Gold Bullion at 8-Month Low on "Weak" Demand as China "Gains Pricing Power"
MineWeb - South African gold, pgm, diamond and copper outputs down sharply
09/11/14 - Bullion News
TECHNICAL ANALYSIS : DailyFX - US Dollar Topping Warning Remains, SPX 500 Finds Interim Support
The Bullion Desk - Comex burdened by weak investor demand, persistent dollar strength
OPINION : Market Watch - Gold may be a ‘buy’ as investors turn ever more bearish
The Hindu - How Key Commodities Swing with Currency Movements
GoldSeek - China Holds “Gold Congress” - Positioning Itself As Global Gold Hub, “In China, Gold Is Money”
Bloomberg - Gold Trading to Begin in FTZ as CME Plans Futures in Hong Kong
Daniels Trading - Gold futures fall; CME launches new contract with Hong Kong
AUDIO : FSN - Gary Christenson – What Is Gold Worth?
Market Watch - American credit-card debt hits a post-recession high
Economic Policy Journal - The "There is No Inflation" Report: Rents Are Up Over 8%
TECHNICAL ANALYSIS : SOLARCYCLES - 10 Indicators Cross-Referenced
Record-Courier - Feds chase treasure hunter turned fugitive Thompson
09/10/14 - Bullion News
TECHNICAL ANALYSIS : Acting Man - Gold Gets Whacked – What Happens Next?
AUDIO : McAlvany Weekly Commentary - Money Printing = Inflation: ALWAYS!
INFO~GRAPHIC : Visual Capitalist - How to Test for Fake Gold and Silver
Zero Hedge - Platinum Fixing Under The Microscope
Forbes - CME Enters Race For Gold Pricing Benchmark After Winning Silver Fix Bid
Bloomberg - Platinum Volatility Near Lowest Since 2005 in New York
VIDEO : GoldBroker - Interview with Gary Christenson: Gold Prices in 3 Waves, Silver Is Inexpensive & The Stock Market/Gold Relationship
Zero Hedge - A Historic First: Bank Of Japan Monetizes Debt At Negative Rates
The Atlantic - Article about Private Debt makes Better Case showing All Debt is Bad, and it's Not Getting Better
Scrap Monster - Gold Bars and Biscuits worth over Rs 1 Crore seized in Indian Airport
MINING Global - World Gold Council: Can Gold Be Used to Solve Certain Environmental Concerns?
09/09/14 - Bullion News
U.S. Global Investors - Strong U.S. Dollar Weakens Gold Prices this September
Daily Pfennig - CME To Ban Manipulative Trading Practices...
GoldBroker - Gold Demand - Jewellery vs Investment
TECHNICAL ANALYSIS : DailyFX - Gold Drops to Three-Month Low, US Dollar Sets New 2014 High
Perth Mint Blog - 2015 Australian Kangaroo Gold Coins To Be Released Early
MineWeb - Goldcorp CEO expounds on Peak gold and $900 gold price
TECHNICAL ANALYSIS : The Deviant Investor - Long Cycles and Trend Changes
Market Watch - Opinion: Almost no one believes the stock market will fall
AUDIO : FSN - Danielle Park – When Is A Bubble Not A Bubble?
MoneyBeat (WSJ) - Senators Say Billion-Dollar Settlements Not Enough Punishment For Banks
csinvesting - A Bear and a Value Investor Throw in the Towel
TECHNICAL ANALYSIS : SOLARCYCLES - Short Term Clues
nanowerk - The Potential for Laser Nano-Surgery of Cancer
kirotv - Top Five Best Designed Platinum Coins
09/08/14 - Bullion News
TECHNICAL ANALYSIS : CEO.CA - Gold’s Last Stand
CoinNews - 2015 America the Beautiful Quarters and Coin Design Images
Casey Research - Hold, Fold, or Be Bold?
International Man - How Empires End
Reuters - Perth Mint's silver sales hit 7-month high in August
CHART : Perth Mint Blog - Monthly Sales – August 2014
TECHNICAL ANALYSIS : DailyFX - Market Updates on U.S. Dollar, Gold, S&P 500 and Oil
Reuters - U.S. Mint to stop 2014 platinum Eagle coin sales after Oct 1
Bloomberg - From Chocolate to Beer, Shrinkflation Hits the Supermarket
Zero Hedge - Obama's Former Chief Economist Calls For An End To US Dollar Reserve Status
Nomi Prins - The People vs. Federal Bank Settlements and Liquidity Rules
JCK - Ancient Roman Jewelry Hoard Found Under U.K. Department Store
09/07/14 - Bullion News
TECHNICAL ANALYSIS : GoldSilverWorlds - Gold – Contradictory Technical Indicators In Play
COMMERCIAL : Taco Bell - If Grandpa Knew the True Value of His Silver Dollar, He Would Know, He Could Get More Than a Dozen Tacos with it.
Dollar Collapse - Real Interest Rates and Future Chaos
Sovereign Man - Everything that’s wrong with banking summed up in one bonehead advertisement
Wealth Daily - Russia Welcomes Executive Order NCO1
BullionStar - Another Week Of Strong Gold Demand In China
Silver remains scarce in Shanghai
CoinNews - What I Told Alan Titchmarsh About $1920 Gold Prices
CoinNews - Great Sand Dunes National Park Quarter Launch Ceremony Highlights
MineWeb - Gold monetisation scheme aims to treat gold as currency in India
SunSentinel - Treasure hunters uncover bling and beer cans
09/05/14 - Bullion News
Numismaster - Gold Coins the Best Buy Right Now?
CoinNews - Gold Declines Slightly, US Mint Bullion Coins Climb
TECHNICAL ANALYSIS : TheGoldandOilGuy - The Truth About Where Gold Price Is Headed
TECHNICAL ANALYSIS : Seeking Alpha - Gold And Silver Testing 3-Year Lows As Palladium Hits New Highs
GoldMoney - Market Report: Short-sellers driving prices
SafeHaven - Gold Needs to be Rising in All Currencies!
HealthUnlocked - Nanotech Methods May Be the Future of Cancer Treatment
Daily Reckoning - Hold Onto Your Gold: A Supply Shortage is Coming
U.S. Global Investors - Remember, Remember, Gold in September
MoneyBeat (WSJ) - CME, Thomson Reuters Seen as Favorites to Manage London Gold Fix
The Bullion Desk - LME confirms cancellation of gold, silver forward curves from Sept 22
Reuters - Asia Gold-Buying picks up as price drops; Indian festive demand eyed
BullionStar - Does The WGC Understand The Chinese Gold Market?
09/04/14 - Bullion News
TECHNICAL ANALYSIS : Safe Haven - Gold and Silver Market Update
EverBank - Daily Pfenning : A Day Of Central Bank Meetings
MoneyBeat (WSJ) - How the ECB Finally Learned to Be Like the Fed
CEO.CA - The Central Banks Aren’t Done Yet
Gold and Silver Blog - Silver American Eagle Bullion Coin Sales in Summer Slump
Kitco - Gold Pressured by Soaring U.S. Dollar Index; U.S. Jobs Data Next Up
VIDEO : Gordon T Long - MACRO ANALYTICS - Special Guest: Egon von Greyerz
INFO~GRAPHIC : Visual Capitalist - A Forecast of When We’ll Run Out of Each Metal
GoldSilverWorlds - Silver’s Value In 3-D Printing And Curing Cancer
The Deviant Investor - Gold Model Projects Prices From 1971 – 2021
Plata - How the Dollar Will Die
CHARTS : Zero Hedge - Obviously Not A Bubble
arabianmoney - Goldman Sachs is the world’s worst gold forecaster so go long when they say short
Affiliate Ad
09/03/14 - Bullion News
TECHNICAL ANALYSIS : DailyFX - Gold Slides to Three Month Low as US Dollar Accelerates Upward
INFO~GRAPHIC : Gold-Eagle - Gold History and Mining in the USA
AUDIO : McAlvany Weekly Commentary - Gold & the Real Value of an Asset
Mises Economic Blog - Finally, the Fed Blames Itself
VIDEO : CNBC - Santelli: All about central banks Thursday
The Gold Report - How is Doug Casey Preparing for a Crisis Worse than 2008? He and His Fellow Millionaires Are Getting Back to Basics
USA Today - You can't have solar without silver
Kimble Charting - King Dollar at 11-year resistance, 77% bulls
Rick Ackerman - A Warning to Those Grown Bored with Gold
King5 - The New Orleans Mint
TECHNICAL ANALYSIS : SOLARCYCLES - Last 30 Years
The Sovereign Investor - Why Raising the Minimum Wage Will Increase Inflation and Hurt the Economy
09/02/14 - Bullion News
TECHNICAL ANALYSIS : NuWire Investor - Dark Clouds for Gold
NuWire Investor - Gold vs The US Dollar
VIDEO : Technical Traders - Chris Vermeulen's Technical Outlook on Stocks, Gold, Miners, Corn, and Oil
Sovereign Man - The morning after: What happens when a government destroys its currency
Martin Armstrong - Will Gold Still Go to $5000?
AUDIO : FSN - John Rubino – Imagine a World Without Central Banks and Fractional Reserve Banking
Daily Reckoning - Preserve Your Wealth in the Face of Financial War by James Rickards
South China Morning Post - Chinese lenders boost precious metals stock amid rising demand
BullionStar - Chinese Weekly Gold Demand Highest Since February
Reuters - Gold imports, premiums to jump on festive demand - top refiner
SRSrocco Report - The Great U.S. Retirement Asset Bubble vs Physical Gold Investment
The Daily Bell - Don't Believe Government About Price Inflation
The Deviant Investor - Tabloid Version of Financial and Political News
Money and Markets - Buying on Margin? Here’s the Risk/Reward
SilverLunar - PAMP Lunar Calendar Series: 2015 Year of the Goat
08/31/14 - Bullion News
TECHNICAL ANALYSIS : DailyFX - Gold Jumps to One-Week High as SPX 500 Chart Setup Warns of Pullback
VIDEO : FXEmpire - Technical Analysis : Gold's price chart says to wait and see what happens...
VIDEO : Chris Martenson - Understanding Inflation
Market Watch - Europe needs to stop the insanity
Seeking Alpha - Gold's Headwinds Now Starting To Fade - Look For Higher Prices Ahead
Ludwig von Mises Institute - The Myth of the Unchanging Value of Gold
TECHNICAL ANALYSIS : SOLARCYCLES - Last Trading Day Of August
Profit Confidential - History Repeats: Car Loans to People Who Don’t Qualify?
The Mess that Greenspan Made - Generation “X” = Generation “Debt”
Sovereign Man - 422% increase in price to leave the Land of the Free
08/29/14 - Bullion News
The Bullion Desk - No Recovery – What does it mean for Bullion?
Financial Sense - James Grant: Two Alternative Outcomes From Fed Policy – Much Higher Inflation or More Money Printing
VIDEO : Kitco - Technical Analysis : Gary Wagner Charts Gold's Next Possible Move...
PDF : Best Minds Inc. - A History of Unlimited Money: Learn From It or Repeat Its Mistakes
Silver Coins Today - Great Sand Dunes 5 Oz Bullion Coins Debut, Lead Sales
Bullion Vault - "Buy Gold Now" Says the September Average
Bloomberg - Palladium Rises to 13-Year High on Russia Supply Concerns
GoldSilverWorlds - Should Retirement Plans For Individuals Hold Precious Metals And How?
BullionStar - Precious Metals Markets: China vs US
VIDEO : CNBC - Fed is now in 'a bind'
TECHNICAL ANALYSIS : King One Eye - Updated Dollar Chart -- The Greenback Bumps Its Head
CoinNews - Assaying Gold at the West Point Mint
The Guardian - The joy of metal detecting – it’s not just about the treasure
08/28/14 - Bullion News
ThinkAdvisor - Silver Pricing Change Takes Effect; Other Metals to Follow
VIDEO : Bloomberg - Why September Should Be Glowing for Gold
VIDEO : GoldSwitzerland - Alasdair Macleod - “The Three Biggest Reasons to Invest in Gold"
Bullion Vault - China Leads "Strong Recovery" in PV Silver Demand
VIDEO : Daily Mail - Is the Eurozone about to Start Printing Money? Markets boosted and euro falls as Draghi hints Europe will launch 'Quantitative Easing'
Peak Prosperity - I Blame The Central Banks
VIDEO : CNBC - Rick Santelli discusses the effect of QE on equities and the future of interest rates
REWIND : VIDEO : Glenn Beck - Understanding Gold Re-Hypothecation
TECHNICAL ANALYSIS : SOLARCYCLES - Last 18 Months
TECHNICAL ANALYSIS : Kimble Charting - Russell 2000 – Long term momentum is breaking down
Zero Hedge - This Has Never Happened Before
08/27/14 - Bullion News
GoldStockBull - CFR Recommends Policy Shift that is Very Bullish for Gold
AUDIO : Turning Hard Times into Good Times - Jay Taylor Interviews Dan Oliver - Director of The Committee for Monetary Research & Education - Interview starts at the 32:22 mark
CHART : Bloomberg - Gold Shines Most in September on Seasonal Buys: Chart of the Day
AUDIO : McAlvany Weekly Commentary - Adam Fergusson: When Money Dies * About this week’s show: Governments always indulge in inflation, Inflation destroys trust in more than money, Unlimited credit creation the new “printing.”
Zero Hedge - Another Nail In The Petrodollar Coffin: Gazprom Begins Accepting Payment For Oil In Ruble, Yuan
SRSrocco Report - Canadian Silver Maple Sales Stronger Than Last Year
VIDEO : CNBC - Rick Santelli : Fed & Monetary Velocity
Market Watch - Russian, Kazakhstan gold reserves rising: IMF
Mashable - 8 Valuable Coins That Could Be Hiding in Your Change
MINING - Abandoned Canadian mining town up for sale
Free Shipping on Orders $199+ | 5.0 star Customer Reviews
08/26/14 - Bullion News
Juggling Dynamite - The Sucking Sounds of Extractive Thinking
TECHNICAL ANALYSIS : Gold-Eagle - Road Sign Says: Pot Of Gold Ahead
MineWeb - Is Asian gold demand really slipping so much?
CoinNews - Gold, Silver Rise; Silver Eagle Bullion Coins Top 28M
SilverLunar - Royal Mint 2015 Year of the Sheep Lunar Coin Range
CHART : Market Update - Which Countries Buy Gold - Google Translation Link
The Sovereign Investor - The Demise of American Yield
The Deviant Investor - Staring Into the Great Abyss
Bonner & Partners - Print, Dupe and Transfer
Library of Economics & Liberty - Richard Timberlake on Money
VIDEO : GoldSwiterland - Ambrose Evans-Pritchard - "I have never seen a more dangerous confluence of circumstances, or more remarkable complacency"
GoldSilverWorlds - How The Coming Silver Bubble Will Develop
by Theodore Butler
CoinDesk - Bullion Dealer Drops Credit Card Payments After Bitcoin Success
PHYS.org - Introducing the multi-tasking nanoparticle
08/25/14 - Bullion News
Got Gold Report - Why “S&P 2000? Is A Fed Manufactured Mirage: The “Buy The Dips” Chart That Says It All by David Stockman
TECHNICAL ANALYSIS : CEO.CA - What is the Gold/Silver Ratio Really Telling Us?
Wall St. Cheat Sheet - Why the Fed Should Just Let Bad Banks Die
The New York Times - Central Bankers’ New Gospel: Spur Jobs, Wages and Inflation
GoldSeek - CME Halt Electronic Gold and Silver Futures Trading Due to “Technical Glitch”
Money and Markets - Scared Money Moving FAST!
Reuters - China's net gold imports from Hong Kong fall to lowest since June 2011
Zero Hedge - What's $100 Really Worth In Each State?
INFO~GRAPHIC : Visual Capitalist - Abenomics: Japan’s Dangerous Experiment
TECHNICAL ANALYSIS : SOLARCYCLES - The Alternatives
Resource Investor - Gold Refiners Refine Refining
C&EN - Gold Nanoparticles Highlight Tumor Borders During Brain Surgery
08/23/14 - Bullion News
Rick Ackerman - The Ignorant Still Hang on Yellen’s Every Word
FOFOA - Six!
TECHNICAL ANALYSIS : Kimble Charting - Commodities Message To The World Is...
Wealth Daily - Is Palladium a Better Investment Than Gold?
AUDIO : Peak Prosperity - Lacy Hunt: The World Economy's Terminal Case of Debt Sclerosis
Korea Joongang Daily - South Korea's Government Attempts to Tap the Underground Gold Economy Underwhelms
The New York Sun - Krugman’s Kryptonite
Profit Confidential - Stock Market Fake? Economic Growth Falls to Slowest Pace Since 2009
TECHNICAL ANALSIS : SOLARCYCLES - Stock Market Update
PDD - Breakthrough in Imaging Gold Nanoparticles
Numismaster - Error coin found in change pays off big
08/22/14 - Bullion News
Financial Sense - Gold Is the Money of Kings, Debt the Money of Slaves
AUDIO : Turning Hard Times into Good - Jay Taylor Interviews - Rick Rule, Ivan Bebec, Daniel McAdams and David Jensen
TECHNICAL ANALYSIS : GoldSeek - Big Picture: Most Important
CHART : King One Eye - How About That US Dollar Rally?
Business Spectator - Gold lifts as physical demand ticks up
AUDIO : Sovereign Man - Tim Price on gold, value, and the danger of complacency
The Bullion Desk - PGM trade data sees split fortunes for platinum & palladium
VIDEO : arabian money - Palladium up 22% this year and trouncing gold and silver
SRSrocco Report - THE BANKERS REAL THREAT: Physical Silver Bar & Coin Demand
Shanghai Metals Market - Silver demand in India plunged 75% during current fiscal: IBJA
Mish's Blog - Time to Short the US Dollar? Go Long Commodities?
Market Watch - Copper's warning, gold's scolding
CoinWeek - Merit Gold & Silver No Longer Accepting Bullion Orders; Going Out of Business (Update)

SD Bullion - 4.8 star Customer Reviews
08/21/14 - Bullion News
Market Watch - Gold, Silver Bullion Coins’ ‘Fondle Factor’
GoldBroker - 777, Kondratieff, and the 2000-2021 Crisis (Part I)
GoldBroker - Massive Devaluation of Paper Money – 777, Kondratieff, and the 2015-2021 Crisis (Part II)
Ludwig von Mises Institute - Six Myths About Money and Inflation
Money and Markets - Uncertainty: What Great Buying Opportunities Are Made Of
Bloomberg - U.S. Mint Platinum Coins Bypassed in Rush for Gold
AUDIO : SafeHaven - Shanghai Gold Exchange and Other Topics
TECHNICAL ANALYSIS : Kimble Charting - King Dollar Is Nearing 11-Year Resistance, Sentiment Getting Lofty!
TECHNICAL ANALYSIS : Market Anthropology - Breaking the Banks & Finding Gold
Bloomberg - Russia Boosts Gold Reserves by $400M to Highest Since ’93
Azonano - Analyzing Gold Nanoparticles in Cancer Cells Using Darkfield Hyperspectral Imaging
08/20/14 - Bullion News
The Sovereign Investor - Inflation, Interest Rates, and Why You Should Own Gold
CNBC - Santelli Exchange: Servicing debt
Casey Research - Silver: As Close To A No-Brainer Investment As It Gets
VIDEO : CNBC - Mob Boss Calls a Stock Bubble - He advises investing in gold and silver, but if you're thinking about the exchange-traded funds, Fuggedaboutit. He likes physical bars.
Wealth Daily - Silver in the Digital Age
Market Watch - When PIIGS fly, everything you know about euro crisis is wrong
The New York Times - Fed Dissenters Increasingly Vocal About Inflation Fears
Zero Hedge - Car Repos Soar 70% As Auto Subprime Bubble Pops; "It's Contained" Promises Fed
AUDIO : FSN - David Morgan – Palladium Prices Still White Hot
CoinWeek - The Coin Analyst: Modern World Coin Round-Up for August
TECHNICAL ANALYSIS : Kimble Charting - Gold Miners…Bullish Falling Wedge Breakout Near?
Mish's Blog - Idiot's Guide to Austrian Economics
Wall St. Daily - A Simple Hedge Against Inflation
08/19/14 - Bullion News
TECHNICAL ANALYSIS : CEO.CA - The Price of Gold has been Coiling for Weeks...
MineWeb - Is the LBMA Silver Price more transparent than the Fix? No!
VIDEO : U.S. Global Investors - Diversification and Discipline Are Key to Investing in Gold
Bullion Vault - Long-Term Gold, Starting in 1999
NuWire Investor - Allow Me to Reintroduce You to Silver and Gold
The Federalist - The Ayn Rand Dollar
Zero Hedge - Charting The Diminishing Effects Of QE
VIDEO : Gordon T Long - Macro Analytics Sub Prime Economy - Part II w/ John Rubino
South China Morning Post - Three more banks gain approval to import gold into China
BullionStar - East Asia Geared Up For RMB Gold Trading
Star Tribune - Feds in Minneapolis charge 3 coin dealers with coin fraud
CoinWeek - CFTC Confirms Its Reported Gold And Silver Market Data Is Erroneous
nanowerk - Scientists unveil new technology to better understand small clusters of atoms
08/18/14 - Bullion News
MoneyBeat (WSJ) - For Interest Rates, Low Is the New Status Quo
Market Watch - The 10.8 trillion failures of the Federal Reserve
Profit Confidential - Two Reasons Why Interest Rates Will Rise
TECHNICAL ANALYSIS : Kimble Charting - Commodities…Time To Catch A Falling Knife?
MINING - Not just the smart money getting into gold
SilverGoldWorlds - The US Gold in Fort Knox is Secure, Gone, or Irrelevant? - by The Deviant Investor
MineWeb - India Gold Smuggling Explodes YoY
Resource Investor - Indian Gold Exporting Firm Raided
VIDEO : Daily Reckoning - James Rickards : Warren Buffett And The Chinese Are Loading Up On Hard Assets
Gold-Eagle - Why Chinese Citizens Invest In Gold
Bloomberg - Shanghai Gold Exchange Said to Plan FTZ Contract for Sept
Newsweek - Magnetic Bacteria Could Help Destroy Tumors and Fight Cancer
08/17/14 - Bullion News
TECHNICAL ANALYSIS : Inside Futures - In Fiat We Trust
Investing - As The HUI Turns: A Bottom Is Formed, What Is Next?
VIDEO : Peak Prosperity - A Brief History of US Money
TECHNICAL ANALYSIS : SOLARCYCLES - New Secular Stocks Bull
Perth Mint Blog - Unveiled – The 2015 Australian Bullion Coin Program
RINF - 14 Reasons Why The U.S. Economy’s Bubble Of False Prosperity May Be About To Burst
RT - Russia seeks safe haven in gold, away from dollar and euro
Gold-Eagle - Fighting The Fed Can Be Great For Your Wealth
MineWeb - Global gold demand returning to positive long term trends
TECHNICAL ANALYSIS : SafeHaven - HUI, Gold and Silver; Fun With Monthly Charts
Dollar Collapse - Europe Is Tanking, QE Is Coming
Daily Pfennig - The U.S. Dollar: Looking Back, Looking Ahead
VIDEO : ABC News (Australia) - RIP - Robin Williams : Excellent Interview with Robin Williams on Addiction, Comedy and Acting
08/15/14 - Bullion News
MidasLetter - Liquidity Bubble: When and How Will it Pop?
South China Morning News - Silver market sets scene for new benchmarking in electronic era
AUDIO : FSN - Charles Goyette – It’s the 43rd Anniversary of Nixon’s Closing of the Gold Window
CNBC - Inflation bites into food retailers' results
MineWeb - Russia may become World No. 2 gold miner this year
GoldStockBull - BRICS Countries are Going for Gold!
Bloomberg - Palladium Nears 13-Year High as Gold Is Little Changed
08/14/14 - Bullion News
Market Watch - More Quantitative Easing to Come?
Money and Markets - The Dollar Anniversary
arabian money - Silver price steady as the London price fix ends today
MoneyBeat (WSJ) - Gold’s ‘Golden Cross’ Moment Gets Little Fanfare
TECHNICAL ANALYSIS : SafeHaven - Gold, Silver, Dow and VIX Update
VIDEO : National Geographic - California Drought Launches New Gold Rush
Profit Confidential - Where I’d Put My Money Now
Sydney Morning Herald - Gold beats oil on safe haven demand
AUDIO : GoldSeekRadio - Interview with Silver Guru - David Morgan
Wall St. Cheat Sheet - Gold Demand Is Mediocre, But Central Banks Are Still Heavy Buyers
live mint - Indian Govt hikes import tariff value on gold and silver
Scrap Monster - Festive Season Demand Impulses Jewelers to Buy Gold from Commercial Banks
Daily Mail - Gold dust that could help beat brain cancer: Tiny particles are used to carry drug into diseased cells and destroy them
Affiliate Ad
08/13/14 - Bullion News
Sovereign Man - These guys used to issue the world’s reserve currency too
The Sovereign Investor - Does Our Money Really Belong to Us?
VIDEO : Peter Schiff - Exclusive Interview: Jim Rickards & Peter Schiff Discuss Global Gold Markets
MineWeb - U.S. gold production continued its decline in May - USGS
The Deviant Investor - Black Swans on Final Approach
Phys.org - 'Trojan horse' gold nanoparticles treatment could beat brain tumors
BullionStar - Shanghai Silver In Backwardation
Bloomberg - Gold-Oil Ratio Rises to Highest Since March on Economy
CEO.CA - 4 Fundamental Reasons Gold is Still in a Super Cycle
TECHNICAL ANALYSIS : SOLARCYCLES - Market Developements...
Financial Sense - The Death (or Rebirth?) of Money: An Exclusive Interview With Jim Rickards
Daily Mail - Romanian treasure hunter finds what could be oldest forged coins in history worth £120,000 - and he's going to spend it on a new metal detector
INFO~GRAPHIC : Visual Capitalist - The Dollar Bill Deconstructed
08/12/14 - Bullion News
INFO~GRAPHIC : Visual Capitalist - Currency Wars: A Race to the Bottom
VIDEO : GoldBroker - Interview with Ronald-Peter Stöferle: Monetary Tectonics and Gold
Bullion Vault - Silver vs. Gold Investing
Silver Lunar - Perth Mint 2015 Australian Lunar Year of the Goat Silver & Gold Coins Revealed
Laissez Faire - 6 Major Flaws in the Fed’s Economic Mode
CNBC - 'Perma-bear' Schiff's funds have been on a roll
MineWeb - Confused by the new London silver fix? You should be!
TECHNICAL ANALYSIS : See It Market - How ‘Expensive’ Are Stocks? Comparing Today To 2000 And 1929
Market Watch - Gold fear spike may be on its way
Wall St. Cheat Sheet - 5 Signs Americans Are Flat-Out Broke
The Telegraph - French builders 'kept buried treasure' unearthed during works on an extension
PHOTOS : MINING - Mining Trucks in Trouble
08/11/14 - Bullion News
Gold-Eagle - Hopelessly Devoted To Inflation
AUDIO : Silver-Investor - Silver Guru - David Morgan Reveals Extraordinary Drivers in Silver
Casey Research - Top 7 Reasons I’m Buying Silver Now
CEO.CA - Gold Output Is Still Falling In This Critical Center
Bullion Vault - Silver vs. Gold Investing
TECHNICAL ANALYSIS : SOLARCYCLES - Timing Major Market Peaks: Revisited
AUDIO : FSN - John Rubino – Giving Credit Where Credit Is Not Due
CHARTS : GoldBroker - Gold and Silver - The Eternal Monetary Couple
REWIND : FRONTLINE - DOCUMENTARY : VIDEO : MONEY, POWER & WALLSTREET (Episodes 1 thru 4)
i24news - Israeli Scientist uses Gold to Boost Cancer Diagnostics
Bullion Baron - Lunar Maa-aadness with 2015 Year of the Goat Coins
MoneyBeat (WSJ) - Flat Gold Prices Are Enough To Lure Investors To Gold Mining Stocks
08/10/14 - Bullion News
arabian money - Buying gold and silver now makes more sense than chasing stocks
VIDEO : Gordon T Long - Liquidity Is Not Wealth Nor Collateral
Daily Reckoning - The Safest Investments in a Dangerous World Market - by James Rickards
Wall St. Cheat Sheet - Why Gold Is Spiking (And Why You Should Buy It)
TECHNICAL ANALYSIS : Got Gold Report - Tenacious GDX - Inverted Head and Shoulders Breakout
Daily Pfennig - Is This A New Anti-Dollar Alliance?
The Sovereign Investor - Why Gold Will Rise When the Dollar Falls
BullionStar - Chinese Gold Demand 1094 MT YTD, Silver Premium At Record High
Money and Markets - Our War Forecasts Come True in Aces and Spades! Obama White House Overwhelmed! Up Next: GLOBAL OIL WARS!
VIDEO : Yahoo News - Ca-ching! Florida workers find 2,000 silver coins during home demolition
CNBC - This man's pure gold shirt is worth $213,000
08/08/14 - Bullion News
SRSrocco Report - 2014 Official Coin Sales: Silver The Big Winner
Silver Coins Today - Numismatic Silver Coin Sales Slow, Bullion Sales Surge
Bullion Vault - The Dollar, Gold & Middle East Oil
Gold Chat - JPM's 18 tonne Comex fat finger
BullionStar - HMRC And Eurostat Alter Historic UK Gold Trade Data
CHART : King One Eye - I'm flying to Prudhoe Bay -- Links & Gold Chart
Reuters - The new London Silver Price heralds a new era in precious metals benchmarks
OilPrice - Russia Bids $3 Billion To Control This "Precious" Metal
RT - Russia, China agree more trade currency swaps to bypass dollar
Acting Man - When the Money Runs Out … So Does the Empire
CHARTS : Kimble Charting - Buffett Indicator Hitting Second Highest Level in 60 Years!
CoinNews - US Mint Suspends In-Person Kennedy Gold Coin Sales
NorthEasternU - Attack Ebola on a nanoscale with Gold NanoStars
08/07/14 - Bullion News
The Telegraph - The Seven Drivers of the Gold Price
INFO~GRAPHIC : Visual Capitalist - Buying and Selling Precious Metals: What the IRS Needs to Know
CHARTS : Zero Hedge - Gold Jumps As Ukrainian Fighter-Jet Shot Down Over Donetsk
KGW - The Top Ten Most Famous Animal Coins
TECHNICAL ANALYSIS : GoldSilverWorlds - Bubble Mania: Is The Mother Of All Bubbles About To Burst In 2014?
Reuters - In cat-and-mouse game, India uncovers new gold smuggling route - smugglers have come up with innovative ways to bring in gold ranging from swallowing nuggets to hiding bars in dead cows
csinvesting - Fed Trap; Fragile by Design
Sprott Money - Massive Silver Derivatives Bail-Out Announced with New “London Silver Fix”
TECHNICAL ANALYSIS : Gold-Eagle - US Stock Market; Weekly Charts
Bullion Vault - America's Immature Recovery
Scicasts - Scientists Test a Nanoparticle “Alarm Clock” to Awaken Immune Systems Put to Sleep by Cancer
08/06/14 - Bullion News
Daily Resource Hunter - Rick Rule: This Gold Sell-off is a Normal Event in this Market
TECHNICAL ANALYSIS : GoldBroker - Gold in the Starting Blocks
Ludwig von Mises Institute - Confusing Capitalism with Fractional Reserve Banking
GoldStockBull - Gold Investors Shouldn’t Fear Rising Interest Rates: Here’s Why
AUDIO : McAlvany Weekly Commentary - Fingers of Instability
Bloomberg - Russia Sanctions Accelerate Risk to Dollar Dominance
Sovereign Man - And the next country to join the renminbi fan club is...
VIDEO : GoldSilver - Mike Maloney : World Events Mean Deflation First, Then Inflation
TECHNICAL ANALYSIS : SOLARCYCLES - Market Crashes
The Mess that Greenspan Made - Housing Market Now Clearly Rolling Over
VIDEO : TheGold&OilGuy - The US Stock Market Trend Is Technically Down
Jeweller Magazine - Platinum jewellery strikes gold in India
08/05/14 - Bullion News
Sovereign Man - Pump and Dump promoters are at it again: check out the newest scam
TrimTabs - US is Bankrupt: $89.5 Trillion in US Liabilities vs. $82 Trillion in Household Net Worth & The Gap is Growing
FOFOA - "Dirty Float"
Howe Street - Building Your Position During the Current “Precious Metals’ Grind”
Daily Wealth - Why RISING Rates Are a Screaming "Buy" for Gold...
Bullion Barron - ALERT : Fake Pamp Gold Bullion is Being Sold on eBay : Replica vs Real: 1oz Gold PAMP Bar Comparison
MineWeb - Central banks continuing to boost gold reserves
VIDEO : Cambridge House - No doubt inflation is coming; gold is answer - Jeff Clark
CNW - Royal Canadian Mint launches new "Birds of Prey" silver bullion coin celebrating the bald eagle
VIDEO : GoldBroker - Interview with Julian Phillips on Gold, Geopolitics & the Big Reset
Saudi Gazette - India accounts for 42% of Swiss gold, silver exports
BusinessWire - Oraya Therapeutics Awarded Small Business Technology Transfer Grant for Gold Nanoparticles Development
08/04/14 - Bullion News
International Man - Not Worth a Continental
Global Financial Intelligence - Backwardation REPORT: AGREE MORE GOLD OR SILVER? - Google Translation Link
TECHNICAL ANALYSIS : GoldSilverWorlds - Gold Chart – False Breakdowns And Breakouts Suggest Indecision
Money and Markets - Stocks, Gold and More: What to Do!
BullionStar - Chinese Gold Demand 1063 MT YTD
CHART : Perth Mint Blog - The Perth Mint's Gold and Silver Bullion Sales for July were Down
Bullion Vault - Silver: 3 New Tech Uses to Grow 275% by 2018
The Wall Street Journal - Why It’s Worrying That U.S. Companies Are Getting Older
The Telegraph - Investors dash for gold as markets tumble on Russia sanctions and Argentina default
NewsWise - Veterinarians Use "Gold" Nanoparticles to Deliver Cancer Treatment in Dogs and Cats
The Gold Report - John Hathaway and Doug Groh: Buy Gold Like It's 1999
SD Bullion - 4.8 star Customer Reviews
08/03/14 - Bullion News
The Sovereign Investor - Gold Prices Reveal Truth About U.S. Economy
CoinWeek - U.S. Mint Offers First Look at 2015 America the Beautiful Quarters® Designs
NDTV (India) - Swiss Gold Exports to India Rise to 42 Per Cent, Hit Rs. 50,000 Crore
The Hindu - Gold to gain from rupee weakness
AUDIO : McAlvany Weekly Commentary - The New Cold War Russia & Gold
The Daily Bell - Marc Faber on Commodity Cycles, Monopoly Central Banking and the Wealth Redistribution Craze
VIDEO : Peak Prosperity - Money Creation: Banks
TECHNICAL ANALYSIS : SOLARCYCLES - Weekend Update
Wall St. Cheat Sheet - What Gordon Gekko Got Right About Greed
08/01/14 - Bullion News
NewsMax - The Current State of the US Bullion Coin Market
- by Ed Moy
USA GOLD - The Gold Owners’ Guide to the Rest of 2014
AUDIO : FSN - Monty Pelerin – Government Is Destroying Wealth
The Deviant Investor - Gold Prices 1971 – 2014 in 3 Waves
FXStreet - Gold's Sweet Spot - Strongest Months Are August, September, November And January
Jesse's Cafe' Americain - Gold Daily and Silver Weekly Charts - Good Vibrations
SRSrocco Report - Chinese Silver Inventories Nearly 90% Depleted At Shanghai Futures Exchange
INAUTONEWS - Dark picture for the Global Auto Industry
TECHNICAL ANALYSIS : SOLARCYCLES - The Fire is Lit
Bonner & Partners - This Market Is a Titanic in Search of an Iceberg
Mish's Blog - Nonfarm Payrolls 209,000, Unemployment 6.2%, Employed +131,000
TECHNICAL ANALYSIS : Kimble Charting - Small & Mid Caps haven’t done this in 10-years says Joe Friday!
07/31/14 - Bullion News
Daily Reckoning - Why the Fed Has Declared War on Your Money
TECHNICAL ANALYSIS : Bullion Vault - Spot the Sheeple
Bullion Baron - How Safe Are Unallocated Bullion Accounts?
Reuters - Chinese gold jewellery demand sees first quarterly drop in 8 years
TECHNICAL ANALYSIS : SOLARCYCLES - QE is mantra rather than driver
International Man - Peter Schiff and Doug Casey on the REAL State of the Economy
TECHNICAL ANALYSIS : Gold Scents - S&P 500 Breaks Important Trend Line
CHARTS : McClellan Oscillator - A Scary Valuation Indicator
GoldBroker - U.S. Authorities Starting to Worry about Deutsche Bank’s Mountain of Derivatives
Kimble Charting - Triple Top in this”Value Index” take place?
Economic Policy Journal - The Worst Comment on Economics That'll You'll Read All Day
Reuters - London platinum, palladium fixing co seeks third-party administrator
07/30/14 - Bullion News
Kimble Charting - Since 2000, the S&P 500 on an "Inflation-Adjusted" Basis is STILL BELOW where it was 14-years ago - Whereas exactly 14 years ago today, Gold was $273.00 & Silver was $4.90 a troy ounce
Forbes - The Government's Assault On Retirees
MineWeb - Hold some gold. Better safe than sorry
CoinNews - Gold Dips, Silver Eagle Bullion Coins Top 26 Million
Munknee - Gold Production to Drop By 50%; Few New Discoveries Will Exacerbate Problem
South China Morning Post - Stricter emissions control in China to drive palladium prices higher
GoldBroker - Shanghai Gold Exchange - Gold deliveries since December 2008
CHARTS : Zero Hedge - 3 WTF Charts
Casey Research - Why the Fed’s Taper Hasn’t Hurt the Stock Market… Yet
VIDEO : Mises Economics - Jim Grant: “The Federal Reserve Has So Little Self-Awareness…”
StreetTalkLive - The End Of Q.E.
VIDEO : Bloomberg - Greenspan: Significant Correction Likely in Stocks
Profit Confidential - The Era of Financial Insanity
Mish's Blog - Whopping 35% Have Debt in Collection! Delinquent Debt in America: By Region and Metro Area, Where Is It?
07/29/14 - Bullion News
Howe Street - The Morgan Report's David Smith - Following the Trading Herd Will Get you Slaughtered
GoldSilverWorlds - US Dollar Facing Competition From Other Currencies, Gold Will Also Benefit
VIDEO : Bloomberg - James Grant - The Fed is Manipulating the Interest Rates and the Markets
Hussman Funds - Yes, This Is An Equity Bubble
The Bullion Desk - Gold fix race to open in ‘late August’, close in September – LBMA
VIDEO : CNBC - Ron Paul: Why I still believe in gold
AsianScientist - Gold Nanoparticles are Killing Tissue-Deep Tumors With Light
Zero Hedge - Is Hong Kong-US Dollar Link About To End? HKMA Buys $715 Million To Support Peg
Gold-Eagle - Fed Exit a Blue Pill?
MINING - China's war on pollution to push palladium higher still
AUDIO : Bullion Star - Interview with BullionStar's CEO on the development of the Asian gold market - Mr. Persson touches specifically on the development of the Chinese and Singaporean gold markets
TECHNICAL ANALYSIS : Market Anthropology - The Miners Lead a Rising Tide
07/28/14 - Bullion News
Casey Research - Seeing Rallies and Corrections for What They Are—And Profiting Either Way
King One Eye - Chart of the Day: The US Dollar
CHARTS : Advisor Perspectives - NYSE Margin Debt Surged in June; Leading Indicator for a Market Correction?
CoinNews - Billions in Gold, Treasures of History at West Point Mint
GoldSilverWorlds - Silver Price In 2014 Establishing Another Megaphone Pattern
Money and Markets - Shifting Sands of Time, Countries and Markets. What to Do...
CHARTS : Got Gold Report - COMEX Swap Dealers Hedging a Massive Long Play on Silver?
GATA - Financial Times deleted gold manipulation story because it was too 'sensitive'
AUDIO : FSN - John Rubino – 2007: Deja Vu All Over Again
Rick Ackerman - Economist’s 1999 Warning Now Seems Quaint
Zero Hedge - The Case For A Bull Or Bear Market In Two Charts
Jesse's Cafe' Americain - What Is the Effective Limitation on the Fed's Ability to 'Print Money?'
07/27/14 - Bullion News
TECHNICAL ANALYSIS : Edge Trader Plus - Gold And Silver – Use “Magic” Of Gold/Silver Ratio To Greatly Increase Your Physical Holdings
CHARTS : Zero Hedge - "London Fix" Gold Rigging By Bullion Bank Exposed In Class Action Lawsuit: The Complete Charts
Daily Pfennig- The Fix is In : Coming Changes in the Metals Market
Reuters - Silver bullion banks accused of manipulation in U.S. lawsuit
The Telegraph - Former CBI boss to join Osborne rigging review
TECHNICAL ANALYSIS : Kimble Charting - Small caps (Russell 2000) does this for the first time in 13-years!
Sprott Money - What If We Never Left The Gold-Standard? Part II
Acting Man - QE3 by the Numbers
The Bullion Desk - Indian gold jewellery imports up more than 100 pct y-o-y in June
TECHNICAL ANALYSIS : Market Anthropology - the Second Stage
Money and Markets - Oh no! Did you miss all (or most of) this!?
Business Standard - Gold for bitcoin new fad as e-currency count nears 500-mark
International Man - The Biggest Opportunity for Americans to Reduce Their Taxes
07/25/14 - Bullion News
The Sovereign Investor - Higher Minimum Wage Leads to Inflation
VIDEO : Peak Prosperity - What is Money?
The New York Times - A Chinese Gold Standard?
Wealth Daily - BRICS Targeting the Dollar
AUDIO : McAlvany Weekly Commentary - King Dollar is 70! Is it Now Out With the Old?
Market Watch - Unbelievable collapse in small-cap stocks
TECHNICAL ANALYSIS : Kimble Charting - Momentum back at 1987, 2000 & 2007 levels…Long in the tooth?
POLL : Rasmussen Reports - Americans View Poverty As A Bigger Trap Than Ever
VIDEO : Get Real - Jan Skoyles presents a special on Silver. She talks to Mark O'Byrne of Goldcore.com
The Bullion Desk - Palladium price worries car makers, but platinum, rhodium swap unlikely
R&D Mag - Nanoparticle “alarm clock” may awaken immune systems put to sleep by cancer
CNW - Royal Canadian Mint launches its first 99.99% pure 10 oz. silver bullion bar
07/24/14 - Bullion News
The Telegraph - Have central banks been breaking the law?
- Quantitative easing has had a reverse Robin Hood-type effect by robbing from the poor and giving to the rich...
King One Eye - Gold Dips Below $1,300 -- Chart and Analysis
TECHNICAL ANALYSIS : Kimble Charting - Hey Tonto…These “Patterns and Sentiment” could hurt Silver!
CHARTS : Zero Hedge - Silver Tumbles Most In 6 Months
INFO~GRAPHIC : Visual Capitalist - The Gold Series: 2014 Trends and Beyond
Silver Coins Today - 2014 Silver Eagle Coin Sales Pendulum
Market Update - China imports less re gold via Hong Kong
- Google Translation Link
Bullion Vault - 100 Years to the Day Since the Gold Standard Died
The Deviant Investor - Clear and Present Danger Zone
McClellan Oscillator - A-D Line Divergence Again
CHARTS : Financial Sense - Bulls Take Notice - Caution Suggested as Credit Markets and Equity Markets Diverge
07/23/14 - Bullion News
TECHNICAL ANALYSIS : SOLARCYCLES - Last Gasps
Got Gold Report - COMEX Producer/Merchants in Gold, View from 30,000 Feet an Eye Opener
CityIndex - Silver eyed on soaring speculative sentiment
Hard Assets Investor - Gold’s Fair Value: Bear Says $800, Bull Says $5,000
Casey Research - The Approaching Inevitable Market Reversal
SRSrocco Report - INDIAN SILVER IMPORTS: Near Record At A Quarter Of Global Mine Supply
MoneyNews - China's Gold Demand Drops in First Half as Bars Outweigh Jewelry
AUDIO : FSN - Gordon T. Long – Call On Next Credit Crisis Coming True
The Bullion Desk - FOCUS - Platinum and Palladium import data could signify diverging fortunes
The Gold Report - Doug Loud and Jeff Mosseri: Three Reasons Why Gold and Gold Stocks Will Rise
CoinTelegraph - More Questions than Answers about a New Pure Gold Physical Bitcoins Minted in China
Auburn Journal - Fake silver dollars causing Auburn concerns
Ludwig von Mises Institute - How to Start Reforming the Federal Reserve Right Now
Reuters - U.S. gold ETF delivers first physical bullion coins; holdings grow
gizmag - Gold nanomotors clocked at a record 150,000 RPM
07/22/14 - Bullion News
FXStreet - Platinum – Supply Deficit Widens to Record High
Market Update - Gold exports from Switzerland to Asia: 600 tons
- Google Translation Link
Howe Street - Interview with David Smith of "The Morgan Report" : Gold and Silver Bears: Was Last Week Your Best Shot?
SRSrocco Report - “Wrecking The Silver Monetary System”: Silver Suppressors Hiding In The Dark — PART 2
VIDEO : The China Money Report - Jim Rogers: This Can’t Go on
- First 3min. of Video are in the Chinese Language, Jim Rogers and Interviewer speak in English Language at the 2:59 mark
SafeHaven - Setting The Stage for The Next Collapse
TECHNICAL ANALYSIS : Kimble Charting- So Goes a HOG, So Goes the S&P 500?
CNBC - Harley-Davidson Investors Fall Off the Hog
The Sovereign Investor - Government Confiscation of Dormant Assets
Business Insider - The Wreck Of The SS Central America - The 'Ship Of Gold' - Keeps Giving Up Millions
IIFL - MMTC-PAMP India awarded the London Bullion Market Association’s for Good Delivery
07/21/14 - Bullion News
Casey Research - Western Delusions vs. Chinese Realities
Market Watch - The worst for gold may be over: Bank of America Merrill Lynch
examiner - 25 Interesting Facts About Gold
TECHNICAL ANALYSIS : SOLARCYCLES - Second Chance Peak
King One Eye - Monday Morning Reads -- Energy, Agriculture, and the Gold Chart of the Day
VIDEO : Bloomberg - 'Dr. Doom' Faber: Stocks in a Bubble, Buy Gold
CoinNews - Gold Rises 0.3%, Silver Advances 0.6%; US Mint Bullion Coins Gain
GoldSilverWorlds - Russia Adds 500,000 Ounces Of Gold Reserves In June 2014
GoldBroker - Above-ground Gold Stock - How Much Is There and Why Does it Matter?
The Telegraph - The dollar's 70-year dominance is coming to an end
VIDEO : Michael Hudson - Escaping the dollar
Zero Hedge - "Buying The Car Was The Worst Decision I Ever Made" - The Subprime Auto Loan Bubble Bursts
The Gold Report - Miners Must Control Costs to Improve Share Prices: Byron King
VIDEO : nano werk - Scientists explain how gold nanoparticles easily penetrate cells, making them useful for delivering drugs
07/20/14 - Bullion News
TECHNICAL ANALYSIS : Bullion Vault - Gold: The "Worst" Currency of Them All by Gary Tanashian in his Notes from the Rabbit Hole
Zero Hedge - The 2 Charts That Have BofA Worried About A "Greater Correction" In Stocks
Sprott Assets - The Ongoing Rot in the Economy
PDF : Wizzen Trading - Technical Analysis : Perfect Week That Shows Just How Dangerous Gold Is To Trade
The Bullion Desk - INTERVIEW – Asian gold trading hub a risk to London – Bloomberg’s Ken Hoffman
Bullion Star - Chinese Gold Demand 998 MT YTD
VIDEO : Gordon T Long - Macro Analytics - TAR PIT That is FINANCIAL REPRESSION w/ John Rubino
AUDIO : FSN - Alasdair MacLeod – What’s With The Silver Fix?
CoinNews - Trip to West Point Mint Begins… Stay Tuned
Nanotechnology Now - Iranian Scientists Use Nanosensors to Achieve Best Limit for Early Cancer Diagnosis
The Washington Post - Monuments Men: A Baltimore writer learns her father helped in the search for Nazi plunder
07/18/14 - Bullion News
Macro Business - The Truth About “Gold Backed” Cryptocurrencies
Bullion Vault - India "Can't Risk" Easing Gold Import Rules as Trade Deficit Jumps
Bullion Star - India Imported 713 MT Of Silver In April, 1921 MT YTD
Profit Confidential - The Only Thing I Can Find to “Buy Low” These Days
Forbes - Palladium Hits 13-Year High; Analysts Bullish But Also Warn Of Possible Short-Term Pullback
AUDIO : The Daily Coin - Interview with Silver Guru - David Morgan, discusses the Current Silver Market
GRAPHIC : Kitco - World's Largest Silver Producer : Mexico
Global Money Trends - Which way is Inflation Blowing? Watch Commodities
King One Eye - Another Interesting Chart -- the Smart Money Index
TECHNICAL ANALYSIS : Kimble Charting - Joe Friday…This could get very ugly for the Russell 2000!
Zero Hedge - High Yield Bonds Are Flashing Red Again
nanotechweb - Plasmonic chip (pGold chip) diagnoses diabetes
07/17/14 - Bullion News
Spear's - Forget the Gold Bugs, It's All About Silver Bugs These Days
U.S. Global Investors - Domestic and Indian Gold Rally Points to a Strong Second Half - by Frank Holmes
Gold Chat - How Eastern Gold Demand Is Transforming The Gold Market
CoinWeek - First Read: American Gold and Platinum Eagles: A Guide to the U.S. Bullion Coin Programs
The New York Sun - The Fed in Danger
Economic Policy Journal - Are Prices Rising Around You? The Dollar Peddlers Say You're Crazy!
fin24 - Brics set up $100bn bank to break Western grip
Sovereign Man - Delusional IMF “delighted” to be marginalized by BRICS
The Gold Report - Sean Rakhimov: Upward Trend a Silver Investor's Friend
TECHNICAL ANALYSIS : SOLARCYCLES - Markets Update
VIDEO : CNBC - Former OBM Director David Stockman says he doesn't see a strengthening economy...
Reuters - U.S. gold dealer launches first digital currency backed by bullion
DailyMail - 43 gold bars, 1,300 double eagle coins and thousands of pieces of silver: Inventory of treasure worth MILLIONS of dollars revealed from 1857 shipwreck off South Carolina coast
07/16/14 - Bullion News
CoinNews - Gold Climbs from Losses, Silver Eagle Bullion Coins Top 25M
TECHNICAL ANALYSIS : Kimble Charting - Gold & Silver Bulls want to see this happen!
Casey Research - The Stress Tests That Could Stress Markets
csinvesting - Victor Sperandeo on the Inevitability of U.S. Hyperinflation - Good Article
Reuters - London gold fix company seeks third party to run benchmark
SkyNews - Banks To Overhaul Gold-Fix Amid Rigging Fears
Bullion Star - ICBC: A New Global Currency Setup Is Being Conceived
GoldSilverWorlds - How Eastern Gold Demand Is Transforming The Gold Market
Investment U - Silver's Monthly Price Performance
Perth Mint Blog - Monsoon - Better Late Than Never For Indian Gold Demand
fin24 - Gold imports drive up India's trade deficit
Zero Hedge - Are Share Buybacks About To Hit A Brick Wall?
Dollar Collapse - They’re Lying To Us, Part 4: Fake Pensions
07/15/14 - Bullion News
Money and Markets - Just What is Yellen Yellin’ About? Here’s My Take on Today’s Testimony!
MineWeb - Gold and silver smashdown: More to come?
Barron's - Platinum Supply Deficit to Widen, Prices to Benefit: HSBC
Gold Chat - GLD amendment refers to "unforeseen reasons" for unallocated failure
King One Eye - Charts on Gold, The Drought, and the Bulls and da Bears
The Telegraph - BIS chief fears fresh Lehman from worldwide debt surge
GoldBroker - Is Gold the Anti-Dollar? United States’ Role in the Gold Market
The Deviant Investor - Silver, Gold and Living By The Sword
BullionVault - How Did Bretton Woods Work?
VIDEO : CNBC - Jim Rickards - The significance of a BRICS development bank
Sovereign Man - When you see this happen, you’ll know it’s game over for the dollar. I give it 2-3 years.
nj.com - New York man tries to hawk fake gold bullion in Bayonne, police say
nano werk - Photorealistic plasmonic printing with aluminum nanostructures
07/14/14 - Bullion News
Reuters - Yellen says Fed easy money needed even after recovery -report
Bonner & Partners - Rick Rule on Why the Resource “Super-Cycle” Is Still Intact
VIDEO : CNBC - Santelli's Epic Rant on the Fed, Easy Money & Markets
KIROtv - The First U.S. Mint
Profit Confidential - Investors Forgot Everything That Happened Just a Few Years Ago?
Market Watch - Why gold just posted its biggest drop this year
South China Morning Post - Improvements Need to Be Made to Enhance the Accountability and Governance of the Gold Pricing Process
Albuquerque Journal - Embossing nanostructures shows promise
07/13/14 - Bullion News
AUDIO : Peak Prosperity - John Rubino: Taking Control Of The Time In Which We Live
PDF : U.S. Global Investors - Gold Special Report : The Fear Trade
TECHNICAL ANALYSIS : Gold-Eagle - Gold Forecast and Gold Stocks Bottoming Analysis
The Sydney Morning Herald - A Golden Fleecing: The Mystery of the Missing Millions
Gulf Business - How To Defend Your Portfolio
Nevada Appeal - Things to Look for When Choosing a Rare Coin or Bullion Dealer
BullionStar - For How Long Will People Trust Fiat Money?
Market Watch - Gold stock rally ‘foreshadows a trend’ for the metal
Deviant Investor - Destroying Confidence – the Last 40 Years
ZEAL - Massive PM-Futures Buying
OncologyNurseAdvisor - DNA origami can deliver targeted cancer drugs
MINING - Ohio firm granted rights to shipwreck's gold worth up to $80m
Free Shipping on Orders $199+ | 5.0 star Customer Reviews
07/11/14 - Bullion News
Reuters - CME, Thomson Reuters win battle to replace century-old silver benchmark
TECHNICAL ANALYSIS : Market Anthropology - The Sweet Spot
Gold Chat - No Indian gold import policy change explains RBI gold swap
Money and Markets - Why I Just Added More Gold Exposure for the First Time in YEARS!
Fed Presidents...Do They Sound Like They Know What's Going...
VIDEO : Bloomberg - Federal Reserve Bank of Chicago President Charles Evans Discusses His Views of the Economy
VIDEO : Bloomberg - Federal Reserve Bank of Philadelphia President Charles Plosser Discusses His Views of the Economy
VIDEO : Bloomberg - Federal Reserve Bank of Atlanta President Dennis Lockhart Discusses His Views of the Economy
Economic Policy Journal - I Just Sent Fed Vice President Stanley Fischer...a Copy of Austrian School Business Cycle Theory by Murray Rothbard
Zero Hedge - CEO Of Europe's Largest Insurer Pops The Utopia Bubble: "Nothing Is Solved And Everybody Knows It"
Profit Confidential - Taking It Too Far Again...
GoldBroker - Danger Warning: Banks Knowingly Underestimate their Risks
Reuters - LBMA appoints Johnson Matthey official as new chairman
Got Gold Report - CME Lowers Gold and Silver Futures Margin Requirements
Smithsonian - How Doctors Are Harnessing the Power of Gold to Fight Cancer
07/10/14 - Bullion News
Reuters - As silver fix decision nears, LME ties up with Autilla
- The results of the high-profile process are likely by the end of the week.
VIDEO : Gold Investing News - Survey: Does the London Gold Fix Need to Go?
Money and Markets - Gold Surges, Euro Tanks as “PIIGS” Yields Fly Again!
Yahoo Finance - India surprises by keeping gold import duty at 10 percent
TECHNICAL ANALYSIS : CEO.CA - Gold Breaks Out
BusinessKorea - Korean Research Team Develops New Nanomaterial for Cancer Treatment - (Using Gold Nano Dots)
Profit Confidential - What’s Up Three Times More Than Stocks So Far This Year?
VIDEO : CNBC - Peter Boockvar End of QE will cause major correction
arabian money - Buying gold to insure against the global bond bubble
JCK - Bidz.com Ceases Operations, Will Liquidate
07/09/14 - Bullion News
CoinNews - Gold, Silver Rise Slightly; US Mint Gold and Silver Coins Climb
The Bullion Desk - LBMA delays silver fix decision, LME/Autilla bid throws race open
The Telegraph - LME eyes role in London gold fix after silver deal
VIDEO : JM Bullion - How to Ship Silver and Gold Safely?
TECHNICAL ANALYSIS : Kimble Charting - This could put a “Big Smile” on Gold Bugs faces!!!
Market Watch - Dow 17,000 is on the wrong side of history
VIDEO : Bloomberg - The Fed Doesn't Have a Clear Exit Strategy: Piegza
TECHNICAL ANALYSIS : Market Anthropology - Follow The Yellow Brick Road
Gold Stock Bull - $10,000 Gold, Is it Possible?
07/08/14 - Bullion News
Casey Research - Q&A with the Casey Metals Team
Howe Street - David Smith : Hold On Until You See Solid Market Trend
SilverGoldWorlds - Silver Particles Carry Drugs to Tumors
Fananz und Wirtschaft - We will continue to swim in liquidity : Three top investors in a round-table discussion
- Google Translation Link
Rick Ackerman - When Will the Fed Tighten? Never.
Deviant Investor - QE: Quantitative Easing or Questionably Effective
Dollar Collapse - This Is Disgusting — And the Food Sounds Gross Too
My Budget 360 - Feeling poorer through the power of inflation
ETF Daily News - The Platinum Supply Squeeze Is Just Getting Started
Bloomberg - Gold Shines Again as Hedge Funds Boost Wagers on Advance
Wall St. Cheat Sheet - Here’s Why It Might Be the Right Time to Buy Silver
Businessweek - The Gold Fix: Can Benchmark Price Be Manipulated?
VIDEO : CNBC - Marc Faber: The asset bubble has begun to burst
07/07/14 - Bullion News
Bloomberg - Black Rock's Fund Manager Evy Hambro Discusses the WGC Gold Fix Forum and the Current Gold Market
The Bullion Desk - INTERVIEW – World Gold Council to publish gold fix reformation report
gulfnews - London’s scandal-hit gold price fixing under spotlight
VIDEO : CNBC - France Slams Dollar Dominance
Daily Wealth - The Last Time the Dollar Almost Died (It Wasn't Long Ago)
Perth Mint Blog - New 1/2oz Silver Bullion Coin Marks Major World War II Battle
NuWire Investor - Considering A Self-Directed Gold IRA Or 401(k) To Gold IRA Rollover?
Bullion Vault - Investment Tips for a Dying Dollar
AUDIO : FSN - Silver Guru - David Morgan – What’s Next For Gold And Silver Prices?
USA Today - Service Makes "Texas Precious Metals" Shine
Profit Confidential - This Is Odd...
07/06/14 - Bullion News
Money and Markets - Perfect Storm Driving Gold Higher
Zero Hedge - CEO Of One Of The World's Largest Energy Majors "Sees No Reason For Petrodollar"
Zero Hedge - By "Punishing" France, The US Just Accelerated The Demise Of The Dollar
Global Financial Intelligence - SWITZERLAND ALSO empowers the YUAN, weakening the dollar - Google Translation Link
AUDIO : Peak Prosperity - Mike Maloney: The Dollar As We Know It Will Be Gone Within 6 Years
Numismatic News - Gold Bullion Sells While Silver Bullion Falters in June
In Gold We Trust - Chinese Gold Demand 947 MT YTD
Resource Investor - India to set up gold scrap refining facility
AUDIO : FSN - John Rubino – They’re Lying To Us, Part Deux
VIDEO : The Corbett Report - The History of The Federal Reserve
MoneyBeat - Dow Rockets. Volumes Plummet.
07/04/14 - Bullion News
Happy Independence Day!
The Bullion Desk - RUMOR: CME/ThomsonReuters wins silver fix bid
CHARTS : The Fat Pitch - There are Things to be Concerned About and Things to Not be Concerned About
MoneyBeat (WSJ) - Are Markets Underestimating Rate Hike Risks?
TECHNICAL ANALYSIS : SOLORCYCLES - Burned By The Sun
CoinWeek - The Royal Mint Edge Strikes Gold Britannia Bullion Coins for First Time
WealthDaily - Investing in Silver Manipulation
Ludwig von Mises Institute - Investors and Austrian Economics
Zero Hedge - Largest Austrian Bank Crashes After "Revealing" 40% Surge In Bad Debt Provisions, Record Loss
SD Bullion - 4.8 star Customer Reviews
07/03/14 - Bullion News
AUDIO : FSN - Cyrus G. – Interview with a Gold Skeptic
- Great Interview
Ted Bits - Bombs er Bonds, Debacle at Our Doorstep!
Kimble Charting - Houston we could have a problem in Government Bond land!
The Bullion Desk - ‘Significant wrongdoing’ in gold, transparent metal exchange needed – MP
GoldSilverWorlds - US Mint Sells Much More Silver Than Gold Coins In H1 2014
fundweb - Taking a shine to silver
Perth Mint Blog - The Perth Mint's Monthly Sales – June 2014
South China Morning Post - Chinese gold imports tipped to drop in loan deals fallout
Zero Hedge - June Full-Time Jobs Plunge By Over Half A Million, Part-Time Jobs Surge By 800K, Most Since 1993
The Deviant Investor - Gold Will Be the Final Currency – Yes or No?
Howe Street - David Smith : Big Money in Gold and Silver?
The Spec - Royal Canadian Mint plans to produce another big collectors’ coin
07/02/14 - Bullion News
The Telegraph - We must end this addiction to debt as the engine of growth
Peak Prosperity - The Approaching Inevitable Market Reversal
TECHNICAL ANALYSIS : SOLORCYCLES - Three Peaks
AUDIO : McAlvany Weekly Commentary - Dollar Demise…or Continued Dollar Domination?
GoldBroker - Gold and the European Union
FXStreet - Technical Analysis : SPOT PLATINUM at this year's high
Shanghai Metals Market - Mitsubishi sees tighter supply/demand fundamentals to support Palladium
CoinNews - US Mint Bullion Coins Slow in First Half of 2014; Gold Sales Rebound
The Gold Report - Inflate Your Way to Gold Profits with Edward Karr
Sovereign Man - The absurd reason why the government stole my parents’ savings...
JCK - 6,000-Gram Gold Nugget “Devil’s Ear” Unearthed in Russia
07/01/14 - Bullion News
TECHNICAL ANALYSIS : King One Eye - 2 Gold Charts and Must-Know News
Gold-Eagle - Platinum jumps as fighting resumes in Ukraine
CoinNews - Precious Metals Advance in July Start, Gold Hits 11-Week High
GATA - Bank of England gets pretty intimate with the London Bullion Market Association
Bullion Vault - Gold Investing Sentiment Hits 4.5-Year Low
Deviant Investor - Gold Prices Benefit From Economic Sins
VIDEO : CNBC - Santelli Exchange: Debt is not income
Dollar Collapse - Debt Makes You Dumb, Part 2: Borrowing Just To Get By
Zero Hedge - Equities Spike To Record Highs As US Macro Hits 2-Month Lows
Bonner & Partners - The Government’s Inflation Figures Are a Lie
Resource Investor - Gold bullion imports in India hit 13-month high
Zero Hedge - Wondering "Why You’re Still Poor As Dow Flirts With 17,000" - Marketwatch Explains
CHART : Kimble Charting - VIX index suggests there could be some fireworks in July!

BGASC - Customer Reviews - 4.8 stars
Other pages, on this guide, you may like....


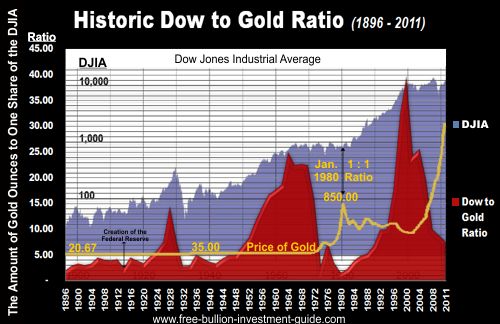


Give a lasting gift of the iconic Silver Maple Leaf bullion coin [More] Price: C$114.95
Free Shipping on Orders over $100 (CDN/USA) |
|


For Bullion Market News...
Notice:
The charts, commentary, and information on the Free-Bullion-Investment-Guide.com are in no way an endorsement of how you should invest or divest.
|
Support this Guide & Paypal Thank You for Your Support |
|
|
 | |||||

Recent Articles
-
Newsletter of the Free Bullion Investment Guide - May 2026
May 05, 26 02:25 PM
 The May 2026 newsletter of the Free Bullion Investment Guide provides the latest updates, fundamental and technical gold and silver market analysis, the best articles from last month, and a list of re…
 -
Newsletter of the Free Bullion Investment Guide - April 2026
Apr 05, 26 04:44 PM
 The April 2026 newsletter of the Free Bullion Investment Guide provides the latest updates, fundamental and technical gold and silver market analysis, the best articles from last month, and a list of…
 -
Newsletter of the Free Bullion Investment Guide - March 2026
Mar 04, 26 02:08 PM
 The March 2026 newsletter of the Free Bullion Investment Guide provides the latest updates, fundamental and technical gold and silver market analysis, the best articles from last month, and a list of…
 -
Newsletter of the Free Bullion Investment Guide - February 2026
Feb 07, 26 02:12 PM
 The February 2026 newsletter of the Free Bullion Investment Guide provides the latest updates, fundamental and technical gold and silver market analysis, the best articles from last month, and a list…
 -
Newsletter of the Free Bullion Investment Guide - January 2026
Jan 07, 26 04:07 PM
 The January 2026 newsletter of the Free Bullion Investment Guide provides the latest updates, fundamental and technical gold and silver market analysis, the best articles from last month, and a list o…

18W LED Security Light (Dusk to Dawn & Motion Sensor) - $32.99
from:
 LED Lighting

) (as of March 11, 2011)")
This website is best viewed on a desktop computer.
Keep this Guide Online
& Paypal
Thank You for
Your Support
with Feedly
Search the Guide
| search engine by freefind | advanced |
Give a lasting gift of the iconic Silver Maple Leaf bullion coin [More]
Free Shipping on Orders over $100 (CDN/USA)
The Sovereign 2026 Gold Bullion Coin in Card

Britian's
Royal Mint

Daily
Newsletter
Mintages & Photos
|

|
Silver Panda |

Mintages
for
2024
Gold, Silver, & Platinum
Austrian Philharmonic Bullion Coins

|
Silver Philharmonics  |
Platinum Philharmonics

Platinum and Palladium Bullion


Mintages
for
2025
Gold & Silver Mexican Libertad
|
Gold Libertads |


Updated Mintages for
American Gold Buffalo
American Gold Eagle
American Silver Eagle


Help Us Expand our Audience by forwarding our link
www.free-bullion-investment-guide.com.
Thank You!
Last Month's

In No Particular Order
April 2026
|
All Articles were Originally Posted on the Homepage Gold Nanoparticle Cancer ResearchSona Nanotech’s Hyperthermia Platform Boosts Immunotherapy Response in Colorectal Cancer Study - Tipranks Sona Nanotech Showcases Cancer Therapy Results At Prestigious Industry Cancer Conferences - Financial Times Development of gold nanostars coated with mesoporous silica for chemo-photothermal therapy - Published Research Paper - Journal of Drug Delivery Science and Technology (Science Direct) |
All Articles were Originally Posted on the Homepage


Click Ad to Request a Free Appraisal Kit
ExpressGoldCash
Customer Reviews 4.9 stars


Give a lasting gift of the iconic Silver Maple Leaf bullion coin [More]
Free Shipping on Orders over $100 (CDN/USA)
