Homepage / Archived News or Quarterly News / 1st Quarter 2014
1st Quarter - 2014
Charts, Bullion News & Commentary
Learning from the past is a useful way to judge price movement in the future when investing in any market.
This page provides a comprehensive overview of gold, silver, platinum, and palladium during the quarter.
For each of the precious metals, you'll find charts. Below the charts, you will find Bullion News Headlines from the 1st Quarter of 2014. Every news link (below) was originally posted on this guide's homepage.
The quarterly charts provide insight into the volatile precious metals markets, while the news below the charts provides a deeper understanding of the fundamentals influencing these markets.
The charts below are provided courtesy of
Gold Price Chart - 1st qtr. 2014
Gold Price Chart (April 1st, 2011 - March. 31st, 2014)

Bullion News
Gold Price Summary
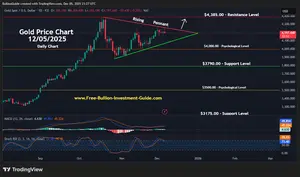
The 1st quarter of 2014 was generally good for the gold market. Gold's price for the quarter rose a little over 8%, from $1181 a troy ounce at the beginning to $1284 at the end of the quarter.
The price of gold was able to close above $1390 on March 14th; it was the first time it had done this since August 23rd, 2013. But Gold was unable to break the major resistance price boundary of $1400 a troy ounce during the quarter.
$1400 is a major long-term resistance level that gold needs to break and hold above before the price can move higher.
After March 14th, when Gold's Price Peaked, it cascaded down to end the quarter at $1284.50 a troy ounce.
The upper indicator, "RSI - Relative Strength Indicator" (red triangle on the quarterly chart), and the lower indicator, "MACD" (yellow rectangle on the quarterly chart) (below), both indicated that the gold price was topping out. Both indicators can be helpful in trying to figure out the future direction of a price chart.
The highlighted Golden Cross on the chart (below) signals a possible positive future for gold for the next quarter.
However, a Golden Cross doesn't always pan out the way investors hope; look to the 2nd quarter of 2014 to see if the "Golden Cross does.
Other positive signs in the quarterly chart were the bottoming, RSI (upper indicator), and MACD (lower indicator) at the end of the 1st quarter of 2014; both are signs of a move to the upside in the near future.
Note: A Death Cross or a Golden Cross are Technical patterns; a Death Cross indicates/predicts a declining asset price, whereas a Golden Cross indicates/predicts a rising asset price.
Gold Price Chart (Jan. 1st, 2014 - March. 31st, 2014)

Gold Price Chart (Jan. 1st, 2013 - March. 31st, 2014)

Bullion News
Silver Price Chart - 1st qtr. 2014
Silver Price Chart (April. 1st, 2011 - March 31st, 2014)

Bullion News
Silver Price Summary
Silver's price in the 1st quarter of 2014 was just like gold's price, up and down.
The price in January flirted with its support price of $19.00 and bounced back each time it touched that price. Silver's price also flirted with its resistance level of $23.00 a few times during the quarter. However, the price of silver could not close above or below its support or resistance levels, to give investors a sense of which way the price might move.
Silver Price Chart (Jan. 1st, 2014 - March 31st, 2014)

Bullion News
Silver Price Chart (Jan. 1st, 2013 - March 31st, 2014)

Bullion News

Platinum Price Chart - 1st qtr. 2014
Platinum Price Chart (April. 1st, 2011 - March. 31st, 2014)

Bullion News
Platinum Price Summary
Platinum, like most precious metals, has been falling in price for the majority of 2013. However, since July 2013, the MACD (lower indicator) has frequently produced higher lows on the chart, signaling a very likely (and actual) price reversal. In addition, late in the 4th quarter of 2013, platinum hit a low price of 1311.70, changing the trend in the price of platinum.
During the first quarter of 2014, the new platinum price trend was characterized by higher highs and higher lows. Before we witness a shift in the price direction of gold and silver, we must see the same indicators on their respective price charts.
Platinum Price Chart (Jan. 1st, 2014 - March 31st, 2014)

Bullion News
Platinum Price Chart (Jan. 1st, 2013 - March 31st, 2014)

Bullion News
Palladium Price - 1st qtr. 2014
Palladium Price Chart (April 1st, 2011 - March. 31st, 2014)

Bullion News
Palladium Price Summary
In the 1st Quarter of 2014, we finally saw the palladium price squeeze break to the positive.
This was expected in both Platinum and Palladium's price charts due to striking South African platinum miners and international pressure on Russia about their invasion of Ukraine. These events are very significant in these two metals because South Africa is the world's top producer of platinum, and Russia is the world's top producer of palladium.
In the first quarter of 2014, automakers consistently showed increased
demand, indicating an increasing requirement for palladium in catalytic
converters. Furthermore,
Russia had repeatedly reported lower production and reserves of palladium
for a series of quarters, which helped the price of the metal to
squeeze.
The price of palladium in the first quarter of 2014 clearly displays where technical analysis and fundamentals intersect to explain what is happening on the price chart.
The "Golden Cross" did not appear on the quarterly price chart below until the price of palladium began to recover.
The horizontal green dotted line indicates where the rebound began; clearly, the RSI (Relative Strength Indicator) showed the move in palladium before the other indicators on the price chart.
Palladium Price Chart (Jan. 1st, 2014 - March 31st, 2014)

Bullion News
Palladium Price Chart (June 1st, 2013 - March 31st, 2014)

The charts above are provided courtesy of
1st Quarter - 2014
Bullion News & Commentary
The Quarterly News starts with the end of the quarter articles, first.
Please note that not all of the links below work; the links are kept because the headlines still provide insight into how the markets were moving at the time.
03/30/14 - Bullion News
Got Gold Report - COMEX Commercial Traders Covering Gold Shorts in a Hurry
TECHNICAL ANALYSIS : Wizzen Trading - Time Is On Your Side
NDTV - How does $40M of Gold and Silver Indian gold premiums fall to 5-month low on supply hopes
The Zimbabwe Standard - Is it Time for the Zimdollar to Return?
CoinWeek - How does $40M of Gold and Silver Disappear: The Collapse of Tulving Company
Inside Futures - Where Are Silver Prices Headed
Wealth Daily - Russia and China Join Forces to Kill the U.S. Dollar
CHARTS : Kimble Charting - Waterfall pattern starting in white hot Bio Tech sector?
INFO~GRAPHIC : Visual Economics - Real Price of Gold since 1791–2013
Money and Markets - My Answers to Your Questions From My Fireside Chats - by Martin D. Weiss, Ph.D.
Plata - The Dollar Cannot Be Devalued and Suicidal Bankers
About - Gold Investing for Your Golden Years
Free Shipping on Orders $199+ | 5.0 star Customer Reviews
03/28/14 - Bullion News
VIDEO : TheGoldandOilGuy - Why Gold Is Falling & A Gold Forecast You May Not Like
Sprott Money - Metals Experience Yo-Yo Action Over Ukraine Crisis and Fed Announcements
CNN Money - The absurd way the U.S. measures inflation: Your rent
Zero Hedge - Japanese Prepare For "Abenomics Failure", Scramble To Buy Physical Gold
TECHNICAL ANALYSIS : Acting Man - Gold and Gold Stocks – A Comment on the Correction
Bullion Vault - Silver, Buffett & the Hunt Brothers
AUDIO : GoldSeek Radio - GSR interviews DOUG CASEY
Voice of America - South Africa Platinum Strike Cripples Mine Companies
CHART : Twitter - Does anyone else see irony of calling this "Investors Intelligence" survey? Bullish '07, Bearish '09, Bullish Now...
TECHNICAL ANALYSIS : Market Anthropology - Offsides
South China Morning Post - Cinda warns trust defaults rising rapidly on mainland
VIDEO : Fox Business - Rogers Holdings chairman Jim Rogers talks Gold, Agriculture and the Markets.
NBC News - Drought Spurs Mini-Gold Rush in California's Sierra Nevadas
WFMZ (Pennsylvania) - Backyard hobby (Metal Detecting) turns up wedding ring missing for more than 40 years
03/27/14 - Bullion News
Mish's GETA - Can Inflation be Too Low?
Wall St. Cheat Sheet - Here’s Why the Government Wants Inflation
Sovereign Man - We’ve Seen This Movie Before...
TECHNICAL ANALYSIS : Sunshine Profits - Gold & Silver Trading Alert: From Bearish to More Bearish
AUDIO : Sprott Money - Ask the Expert - James Rickards (March 2014) | Sprott Money News
Market Watch - The truth about gold in the long run
CNBC - The dollar’s fate—Is it tied to the yield curve?
CoinWeek - What Can You Do When The US Government Stops Supporting The US Dollar?
MineWeb - Gold slips below $1,300, likely to stutter short term
Profit Confidential - Why Is the U.S. Dollar Collapsing in Value All of a Sudden?
Citizen - Platinum price ‘may spike soon’
MINING - The Best Protection Against Corrupt Governments and Geopolitical Tensions is Gold.
03/26/14 - Bullion News
King One Eye - Gold Struggles Despite Big Purchases
Dollar Collapse - Welcome to the Currency War, Part 14: Russia, China, India Bypass the Petrodollar
AUDIO : McAlvany Weekly Commentary - James Rickards: The Death of Money
CoinDesk - Agora Commodities Reports $10m in Bitcoin Sales
SafeHaven - Gold's Macro Fundamentals
Inteligencia Financiera Global - JIM RICKARDS: CHINA IS IMPORTING GOLD SECRETLY USING MILITARY CHANNELS (EXCLUSIVE INTERVIEW!)
GoldSeek - Russia Raises Gold Holdings By 7.247 Tonnes To Over 1,040 Tonnes In February
Zero Hedge - The Real Inflation Fear - US Food Prices Are Up 19% In 2014
Laissez Faire - The Government Inflation Scam
AUDIO : FSN - Chris Vermeulen – From A 16 Year Old Wannabe To Master Trader
03/25/14 - Bullion News
CoinWeek - The Main Street Case for Gold
Sovereign Man - US now spending 26% of available tax revenue just to pay interest
CYNICONOMICS - Message to the Fed: Here Are a Few Things That You Can’t Do
TECHNICAL ANALYSIS : King One Eye - Will Gold Hold Support?
Gold Chat - Gold forecaster with 100% accuracy says gold to remain weak
Bullion Vault - Serious Gold Investors
Deviant Investor - The 60th Anniversary of Nothing Special
MINING - China’s monthly gold imports jump 30%
AUDIO : FSN - David Morgan – Palladium Is Leading The Precious Metals
MineWeb - SA platinum strike causing ‘irreparable’ damage - producers
Ludwig von Mises Institute - How Government Wrecks the Economy
Zero Hedge - Who Is And Isn't Saving For Retirement
Azonano - Plasmonic Gold Nanoparticles Could Kill Tumour Tissue with Heat
03/24/14 - Bullion News
McClellan Financial - Gold Bugs Cheer The Rain
9News - Palladium Rises on Russian Supply Fears
Zero Hedge - Guess Which Precious Metal Is Controlled By The Russians
TECHNICAL ANALYSIS : Gold-Eagle - Inflection Points In The Precious Metals And The Dollar
In Gold We Trust - Interview Jim Rickards On The Death Of Money
Rick Ackerman - When Tightening Comes, It Won’t Be by Choice
TECHNICAL ANALYSIS : Gold-Eagle - Gold’s Golden Cross Not Necessarily Positive Technical Signal
TECHNICAL ANALYSIS : Kimble Charting - 14-year resistance and high valuations for Small caps right here!
VIDEO : Mises - Hazlitt, My Hero | Jim Grant
SRSrocco Report - PEAK GOLD: How The Romans Lost Their Empire
Bloomberg - Silver Vault for 600 Tons Starting in Singapore on Demand
Korea JoongAng Daily - Solid start to trading of gold on KRX
VIDEO : CNBC - Why this top technician recommends buying gold now
03/23/14 - Bullion News
PDF : Wizzen Trading - Technical Analysis : Palladium Shines
- Gold, Silver & Platinum Price Charts
Arirang News - Korea's first-ever gold exchange to start trading on Monday
World Mint News - Kremnica Mint Considers Gold and Silver Bullion Coins
TribLive - Gold may regain its luster
Arab News - Gold smugglers defy India’s curb on imports
Zero Hedge - Goldman Doubles Down Its Hate On The Best Performing Asset Of 2014: Gold
AUDIO : GoldSeek Radio - Chris Waltzek talks to Charles Goyette author of "The Dollar Meltdown" and "Red Blue and Broke All Over"
Market Watch - Stock buybacks likely to peak with end of cheap debt
VIDEO : GoldSilver - Jim Rickards & Mike Maloney: Gold Revaluation & THE DEATH OF MONEY
International Man - International Trusts: Graduating from Training Wheels
FARS - Surprising New Way to Kill Cancer Cells
03/21/14 - Bullion News
Zero Hedge - Gold Completes Golden Cross
AUDIO : Smart Metals Radio - The Death of Money - James Rickards Interview
Wall St. Cheat Sheet - Should You Add Gold and Silver Coins to Your Portfolio?
Money Morning - Warning: This Year's Spike in Margin Debt Is a Huge Red Flag for the Market
VIDEO : Fox Business - James Grant "Gold is Insurance"
In Gold We Trust - Chinese Gold Demand 488 MT YTD, Up 29 %
Wealth Daily - China Default?
SRSrocco Report - Collapse Of U.S. Gold Scrap Exports As Suppy Dries Up
Kiplinger - Smart Ways to Sell Your Gold
CEO.CA - A Clear Explanation for This Week’s Gold Selloff
CHARTS : Kid Dynamie's World - Who Drives the Price of Gold?
GoldSilverWorlds - Ted Butler: Suing JPMorgan and the COMEX
Brisbane Times - Miners bet on golden future
03/20/14 - Bullion News
Profit Confidential - Why Two-Thousand-Dollar-Ounce Gold Becomes Plausible Scenario
Trade Precious Metals - Russian Palladium Exports could be in Jeopardy
The Real Asset Co. - India’s gold flowerpot trade
GoldBroker - World Gold Reserves - Top 20 Holders
TECHNICAL ANALYSIS : Zen Trader - Dollar Could Break Support In Coming Weeks
TECHNICAL ANALYSIS : Nifty Charts - Gold Engulfing Pattern
Bullion Vault - India "Eases" Gold Import Rules as Modi Victory Looms
Gold-Eagle - Gold Is Not An Investment…It Is Money
MineWeb - Willem Middelkoop discusses the history of gold in the monetary system and the likelihood of a big reset of a fundamental change in the structure
In Gold We Trust - The Gold Market, Part 5
Casey Research - John Embry: Why Gold Is Unstoppable
How Fiat Dies - Living Like Parasites
Newsday - Cops: Queens man sold more fake coins on LI
Free Shipping on Orders $199+ | 5.0 star Customer Reviews
Affiliate Ad
03/19/14 - Bullion News
GoldBroker - The Stock Market Priced in Ounces of Gold
VIDEO : Sprott - Tekoa Da Silva Interviews Sprott's Rick Rule
TECHNICAL ANALYSIS : Trader Dan's Market Views - Fed to Continue Tapering - Gold Jettisoned as Dollar reacts
VIDEO : CNBC - Peter Schiff: Fed adds to structural problems
Zero Hedge - Yellen's Fed Tightens ($10bn Taper) And Loosens (Lower For Even Longer); Blames Weather - Full Statement Redline
TECHNICAL ANALYSIS : Gold-Eagle - Gold & Silver Update
AUDIO : McAlvany Weekly Commentary - The Plague of the Black Debt
TECHNICAL ANALYSIS : Acting Man - Gold Loses ‘Ukraine Premium’
TECHNICAL ANALYSIS : Market Anthropology - There is no plot for Je Ne Sais Quoi
SRSrocco Report - The Run On U.S. Gold Continues...
International Man - The Old Rules of the Game No Longer Apply
03/18/14 - Bullion News
Merk Investments - Fishing for Gold?
TECHNICAL ANALYSIS : 321gold - Gold Market Fear Is Unnecessary
Sprott Money - Deconstructing the U.S. Economy: The Non-Recovery
CoinWeek - Questions Loom as Precious Metals Firm ‘The Tulving Company’ Folds
Gold-Eagle - Real Money (Part 2)
TECHNICAL ANALYSIS : Nifty Charts - Gold Support Levels
Deviant Investor - Brave New Deviant World
GoldSeek - Russian Sanctions May Create Serious Supply Shortages For Platinum and Palladium
Bonner & Partners - Planet Debt
Reuters - Taiwan to allow banks to sell gold, silver coins from China
Casey Research - Doug Casey’s 9 Secrets for Successful Speculation
New York Post - Rash of finance pro suicides baffles experts
03/17/14 - Bullion News
GoldSilverWorlds - Gold’s Protection Against Counterparty Risk Is Coming Alive
Zero Hedge - UBS Investigated For Gold Manipulation Suggesting Gold Inquiry Goes Beyond London Fix
MoneyNews - Why You Should Own Some Gold and Silver
Sunshine Profits - Can Gold and Interest Rates Move Higher at the Same Time?
Investing - Is a Silver Supply Deficit On The Horizon?
In Gold We Trust - New York Federal Reserve Lying About Gold Storage
The Daily Bell - Gold Versus Bitcoin: An Unnecessary Argument
VIDEO : CNBC - Chinese demand for gold at record levels
MineWeb - 2013 U.S. gold production down 128,602 oz - USGS
The Money Savings Dude - Five Types Of Investors — Which Group Do You Belong?
03/16/14 - Bullion News
TECHNICAL ANALYSIS : Investing - Gold Continuing To Lead Silver Out Of Bear Market Lows
The Daily Bell - Andy Hoffman on the Golden Bull, Failing Fiat and the Foundering of the Central Bank Economy
Zero Hedge - The Failure of Keynesianism
South China Morning Post - Gold trading to open up to foreigners in Shanghai
In Gold We Trust - Week 10, SGE withdrawals 36 MT, 454 MT YTD
Liberty Voice - Gold Price Outshines Stock Market With 14% Gain This Year
ZEEBIZ (India) - Govt raises gold's import tariff value
Zero Hedge - Every Chart You Should Be Tracking But Were Too Afraid To Find
Daily Pfennig - Gold Manipulation May Not Be a Crazy Conspiracy
ValueWalk - Hedge Fund Sues Major Banks Over Market Manipulation
03/14/14 - Bullion News
VIDEO : TheGoldandOilGuy - Technical Analysis : The Next Three Bull Markets
TECHNICAL ANALYSIS : Market Anthropology - Rock, Taper, Scissors - Shoot
Pf Hub - Bitcoins or Bullion: Ignorance of one journalist shines through
CHART : Kimble Charting - Happy Anniversary Top at hand? 5-year rally the “Exact” same length?
The Globe and Mail - Gold, silver charts flashing 'buy' signals Add to ...
CHARTS : GoldBroker - Gold vs. Black Gold
Oregon Live - Local dealer Blue Moon Coins faces police investigation
TECHNICAL ANALYSIS : Nifty Charts - Golden Cross of Gold
The Real Asset Co. - When should I buy gold?
Gold Chat - How ETFs Haven't Altered The Dynamics Of Gold
VIDEO : RTL Z - RTL Z interviews economist James Rickards: the monetary system will collapse
Miningmx - Building the platinum demand of tomorrow
Silver Coins Today - Mule Error 2014 Britannia Silver Bullion Coins Authenticated

03/12/14 - Bullion News
Advisor Perspectives - Global Debt of More Than $100 Trillion Is Threatening Your Portfolio
AUDIO : McAlvany Weekly Commentary - Mark Faber: Gold is Your Best Cash
TECHNICAL ANALYSIS : Trader Dan's Market Views - Western Investment Demand Surfacing for Gold
TECHNICAL ANALYSIS : Kimble Charting - Patterns suggests Doc Copper could fall 30% more!
Deviant Investor - Gold: 14 Years & Three Patterns
CHARTS : The Real Asset Co. - What does Ukraine mean for the gold price?
CHARTS : SolarCycles - Demographics And Secular Bull Markets
iol - Platinum strike losses reach R12bn
TECHNICAL ANALYSIS : Peak Prosperity - Why 2014 Is Beginning to Look A Lot Like 2008
In Gold We Trust - The Gold Market, Part 4
abcNews - 'Pawn Stars' Shop May Have Melted Stolen $50,000 Coin Collection
03/07/14 - Bullion News
The Real Asset Co. - Five years of daylight robbery
Sovereign Man - “No inflation” Friday: the dollar has lost 83.3% against...
Wealth Daily - Should You Worry About Hyperinflation?
TECHNICAL ANALYSIS : Nifty Charts - Silver's Bearish Price Action
About.Ag - Tulving Post Mortem
In Gold We Trust - China’s Road To Secret Gold Accumulation
The Economist - In a fix, Mr Bond
Mail & Guardian (S. Africa) - Banks bear brunt of gold-fix blame - If guilty, the five major institutions could be sued in SA for deals done locally
GoldSilverWorlds - Why Increased Western Gold Demand Could Lead To A Gold Supply Shortage
03/06/14 - Bullion News
SRSrocco Report - Silver Eagle Sales Steal The Show While Top Silver Miners Lose Money
GoldSeek - Gold Scams Revisited
Gold Chat - US deep storage gold - weights
Financial Sense - The Dollar’s Long Term Decline
AUDIO : McAlvany Weekly Commentary - Money Printing & Your Personal Gold Standard
CHARTS : Advisor Perspectives - The Q Ratio and Market Valuation: Monthly Update
TECHNICAL ANALYSIS : Market Anthropology - Euro has Broken out of its Consolidating Range... includes Charts for Precious Metals
BullionVault - UK QE and 0.5% Interest Rates, 5 Years On
AUDIO : Silver-Investor - Precious Metals & The Restoration of Liberty Interview with David Morgan
Gold Made Simple - India is experiencing an ‘acute shortage’ of gold – prices are 21% HIGHER than spot gold
VIDEO : Bloomberg - A Rare Look Into a Copper Warehouse
03/05/14 - Bullion News
iol - Futures point to $1 400 for gold
CoinNews - 2014 American Platinum Eagle Bullion Coins on Sale March 10
MineWeb - The effects of gold market manipulation and the opportunities for equities - Eric Sprott
TECHNICAL ANALYSIS : Gold & Oil Guy - How Much Will a 15% Hair Cut Cost Your ETF Portfolio?
TECHNICAL ANALYSIS : Market Anthropology - The 46' Parallel
In Gold We Trust - Interview Fabrice Drouin Ristori From Goldbroker.com
Kitco - Palladium Hits 11-Month High On Russia, South Africa Supply Concerns
Reuters - Australia's Perth Mint gold sales rise in Feb, silver falls
Bloomberg - Barclays, Deutsche Bank Accused of Gold Fix Manipulation
BullionVault - India Gold Curbs Tighten Even as Minister Says "Need to Ease"
Arizona Daily Star - Man melted stolen jewelry, made gold bars, Tucson police say
Birmingham Mail - Pics and video: The REAL Goldfinger's house goes up for sale for £1m
03/04/14 - Bullion News
Courthouse News Service - Elderly Man Says Gold Dealer Rolled Him - Kraner claims he gave Merit Gold $4 million for what he was assured were rare gold and silver coins, but which were worth only half as much.
GoldSeek - Real Money
BullionVault - Gold Buyers Outnumber & Outweigh Sellers in Feb.
VIDEO : YouTube - Jim Rickards: Bernanke and the Fed
In Gold We Trust - India Imported 6125 Tonnes Of Silver In 2013
Deviant Investor - This Gold Model Calculates Prices Between 1971 & 2017
Cato Institute - Hyper-Inflation, Will Venezuela Be Next?
03/03/14 - Bullion News
VIDEO : Bloomberg - Gold Poised to Challenge $1,400 Per Ounce
Futures Magazine - Gold miners see looming output drop after cut in spending
iol - Platinum stocks dwindle as strikers dig in
VIDEO : TheGoldandOilGuy - Investing in Assets in Bull Markets is the Key
Silver Coins Today - US Mint Silver Coins Solid in February, Silver Prices Soar
Kimble Charting - 300% decline far enough? Reversing so far in 2014, Gold Bugs up 25%!
In Gold We Trust - Chinese Physical Gold Demand YTD 369t Up 51 % Y/Y
Ludwig von Mises Institute - Anti-Logic and the Keynesian “Stimulus”
IBTimes - India Raids Gold Stocks in Bid to Halt Smuggling
Bloomberg - India Jewelers Plan Shutdown to Demand Easier Gold Import Rules
eCommerce Bytes - Would You Sell Gold Coins Stash on Amazon or eBay?
Affiliate Ad
03/02/14 - Bullion News
The Daily Bell - FT's Shocking Gold-Manipulation Glitch
PDF : Wizzen Trading - Technical Analysis : Little Pullbacks
GoldSilverWorlds - Gold & Silver: From Now On All that Matters Is That You Own Both
Bangkok Post - Is the London Gold Fix...Fixed?
Mises Economic Blog - Remembering Mr. Libertarian on his birthday
ZEEBIZ (India) - Elections results to influence gold prices: Study
02/28/14 - Bullion News
VIDEO : Bloomberg - Are Gold Prices Being Manipulated by Banks?
TECHNICAL ANALYSIS : King One Eye - Gold and Miners Consolidate ... But for How Long
CHARTS : In Gold We Trust - Gold Trade Numbers 2013 Broke All Records
Market Watch - Gold sidekick silver breaks some ground of its own
FOFOA - Think like a Giant 3
Investment U - Who’s Got the Gold?
GoldSilverWorlds - Gold Price Explodes In Ukrainian Currency
ZEEBIZ (India) - Govt hikes import tariff value of gold, silver
China Daily - Renminbi may become global reserve currency
02/27/14 - Bullion News
Kitco - Gold Ends Firmer, Gets Slight Boost From Yellen Remarks
MineWeb - China’s January Hong Kong gold imports soar 326% year on year
AUDIO : Korelin Economics Report - Rick Ackerman and Technicals
Bonner & Partners - Are We on the Cusp of a New Bull Market in Gold?
GoldSeek - 24 Karat Gold: The Top 5 Perks of American Buffalo Gold Coins
BullionVault - 3,000 Years of Inflation
Keith Weiner Economics - The National Debt Cannot Be Paid Off
Gold Prices - The Federal Reserve, Janet Yellen, QE and Gold
Anglo Far East - Transcript of AFE's Interview with Jim Rickards
Mashable - The Crazy True History of the Saddle Ridge Gold Coins
Saving Advice - From Bitcoin to Bullion: The Tangibility of Currency
QUIZ : Daily Mail - Are you right-brained or left-brained? And what does it say about your personality? Take this interactive QUIZ to find out
02/26/14 - Bullion News
Investing - What’ll Yellen’s Testimony Do To The USD?
Casey Research - Don Coxe: The End of Financial Heroin
INFO~GRAPHIC : Visual Capitalist - GOLD : The Most Sought After Metal on Earth
Ludwig von Mises Institute - The High Price of Delaying the Default
Sprott Asset - Don't Miss this Golden Opportunity! by Eric Sprott
Forbes - PGMs Expected To Benefit If South African Strike Becomes Protracted
TECHNICAL ANALYSIS : Gold Made Simple - Gold price now up 13% from the new-year lows and within reach of some key levels
CoinNews - Saddle Ridge Hoard of Buried Gold Coins Authenticated by PCGS
RCP - The 'Fairness' Fraud by Thomas Sowell
02/25/14 - Bullion News
MoneyNews - How to Profit From the Yellen Fed by Axel Merk
Bonner & Partners - Debt + Demography = Destiny
GoldSilverWorlds - FT Removes Article “Gold Price Rigging Fears Put Investors On Alert”
King One Eye - 4 Gold Stories & 4 Smokin' Hot Charts
Inside Futures - Staying Bullish on Gold & Silver
VIDEO : The Real Asset - Skoyles talks to Keiser about gold, China and GetREAL
Deviant Investor - Equilibrium Gold Price Model
Mish's Blog - You Too Can Make Millions "Flipping" Houses
SRSrocco Report - Market Continues To Purchase “All” Allocated Silver Eagles From U.S. Mint
VIDEO : Zero Hedge - Rick Santelli Summarizes The Problem: "It's The Government"
abcNews - California Couple Finds $10M Buried Treasure in Back Yard
02/24/14 - Bullion News
Wealth Daily - Win Gold by Trading Silver
TECHNICAL ANALYSIS : Market Anthropology - Back to the Bull Market Highway for Silver & Gold
AUDIO : The Daily Gold - David Morgan Shares his Insight on Precious Metals
The Real Asset - The London Gold Fix: the saga continues
VIDEO : CNBC - Stocks are set for a big fall, thanks to the Fed: James Grant
In Gold We Trust - The “Chinese dream” of ICBC’s Precious Metals Department - an interview with Zhou Ming
MoneyNews - Mint Gold Coin Sales Head for Worst Month Since September
Personal Liberty Digest - Bartering With Gold And Silver
U.S. Global Investors - Going for the Gold
MINING - Bubba explains why US only gave Germany back 5 tonnes of gold
02/23/14 - Bullion News
Money and Markets - 3 Dire Warnings Fall on Deaf Ears!
TECHNICAL ANALYSIS : Wizzen Trading - PDF : Gold Medal Action
AUDIO : Hard Assets Alliance - Paper Money Collapse - Detlev Schlichter Interview
TECHNICAL ANALYSIS : GoldSilverWorlds - Silver Could Be The Tipping Point While Gold And China Get All Attention
VIDEO : Gordon T Long - Macro Analytics - What Blows Up First - Part 1 w/ John Rubino
In Gold We Trust - Weekly Chinese Gold Demand Transcends Global Mining Production, Again
Business Standard (India) - Jewellers tell govt to reduce gold import duty to 2%
CoinNews - Gold, Silver Gain for Third Week; US Mint Bullion Coins Mixed
Mining - Gold price: Hedge funds add 30% to bullish bets
02/21/14 - Bullion News
GoldSeek - Alleged Gold & Silver Scams Abound
Numismaster - Gold Surprises Wall St.
VIDEO : 321gold - Technical Analysis : Gold Stock Pause & Pop Update
Profit Confidential - Demand/Supply Equation for This Investment Guarantees Higher Prices Ahead?
Bullion Vault - India Tightens 80:20 Gold Import Rules
In Gold We Trust - Bundesbank Attempts to Subdue Concerns Gold Repatriation
Forbes - China Seeks Seat On Gold Fix Table. What Does It Mean For The Gold Price?
AUDIO : McAlvany Weekly Commentary - Global Debt Bomb: From TNT Now to Nuclear
International Man - On the Ground in the Cook Islands "For a number of reasons, the Cook Islands might deserve a central role in for your plan for internationalization—particularly for asset protection and estate planning"
02/20/14 - Bullion News
TECHNICAL ANALYSIS : Hubert Moolman - Silver Price Forecast 2014: Significant Silver Rallies Usually Follow Major Dow Peaks
VIDEO : SGT Report - Interview with Sprott Money's Rick Rule
TECHNICAL ANALYSIS : King One Eye - Chart of Gold -- Test of 200-day MA
CoinWeek - Is The FMQ Having An Impact On Gold Prices?
Jesse's Cafe Americain - The Recovery™ - Bubble Back To the Bar For the Hair of the Dog That Bit You
TECHNICAL ANALYSIS : Kimble Charting - Head & Shoulders top in the Dow? Right shoulder in place today?
AUDIO : Silver-Investor - Interview with David Morgan
GoldSeek - These Gold Charts Will Make Your Heart Beat Faster
VIDEO : Xinhua.Net - China Leads the World in Gold Production
Bloomberg - Switzerland Sent 80% of Bullion Exports to Asia in January
The Real Asset - The Five Greatest Gold Robberies
02/19/14 - Bullion News
Financial Sense - Gold’s Comeback and Bitcoin’s Silent Crash
Zero Hedge - In 2013 The Fed Bought 150% More Treasurys Than All Foreigners Combined
AUDIO : Sprott Money - Rick Rule: US Debt Out of Control, “Gold is Catastrophe Insurance”
The Sydney Morning Herald - Fed to change rate guidance as optimism grows
VIDEO : CNBC - The Santelli Exchange: Anniversaries & voices
TECHNICAL ANALYSIS : Market Anthropology - Salty Dogs Surf Silver
VIDEO : Bloomberg - "We Are In the Mists of a Policy Experiment We've Never Seen Before, So I Do Think as an Investor Having Gold in Your Portfolio Makes Sense"
MineWeb - SA Platinum producers table final offer
Bullion Vault - Gold Demand Trends Diverge
In Gold We Trust - The World Gold Council Clueless on Chinese Gold Demand?
GRAPHICS : Visualizing Economics - 1947 - 2010 : The Defining 20 US Industries
Acting Man - Venezuela: From Bad to Worse to Zimbabwe
Zero Hedge - Second JPMorgan Banker Jumps To His Death: Said To Be 33 Year Old Hong Kong FX Trader
02/18/14 - Bullion News
TECHNICAL ANALYSIS : Kimble Charting - Gold creating bullish “Cup & Handle” pattern?
The Sydney Morning Herald - Fears of looming China credit crunch spark new gold rush
Dollar Collapse - What Blows Up First? Part 4: China
Money Beat - Gold Prices Hurdle Technical Milestone
MINING - Report: Chinese bank poised to join London gold fix
World Gold Council - Gold Demand Trends : Latest Issue: Gold Demand Trends Full Year 2013
Yahoo Finance - China Is Now The World's Largest Consumer Of Gold
CHARTS : Prometheus Market Insight - Potential Cyclical Topping Pattern
ZEEBIZ - Gold smuggling in India to rise if curbs stay: WGC
BDlive - Paulson, hedge funds remain bullish on bullion
Trade Arabia - Qatar’s online gold, silver trading platform opens
02/17/14 - Bullion News
CoinWeek - Gold and Silver American Eagles: Big Sellers in a Sluggish Economy
MINING - Platinum, palladium price react as strikes drag on
TECHNICAL ANALYSIS : Money and Markets - Don’t Be Fooled by Gold’s Glitter
In Gold We Trust - The End Of Bretton Woods And The Race To The Bottom, 1971
Library of Economics & Liberty - In the 1930s it seemed "obvious" that financial turmoil had caused the Great Depression
TECHNICAL ANALYSIS : Zero Hedge - Bank Of America Warns "The US Dollar Is In Trouble"
SRSrocco Report - THE COMING SILVER STORM: The Public Is Not Prepared
MineWeb - Christian vs Embry: Gold, lies and video interviews
Perth Mint Blog - Tribute Coin Proves A Boon For Bullion Sales
Gold-Eagle - Monetary Metals Supply And Demand Report
McClellan Oscillator - Can Earnings Get Better Than This?
Seeking Alpha - Gold And Silver: Are Shorts About To Panic?
02/16/14 - Bullion News
Investing - Gold and Silver: An Investor's Safe Haven, Still
MineWeb - Gold and the Dow – Beware the Ides of March
PDF : US Funds - The Ups & Downs, Twists & Turns in the World of Commodities by Frank Holmes
TECHNICAL ANALYSIS : Gold-Eagle - Gold Price Forecasts
Financial Sense - Watch for a Taper Time-Out
TECHNICAL ANALYSIS : Trader Dan's Market Views - A Different View Point on Gold's Recent Price Movement - "Sloping Trend-lines"
Profit Confidential - First Cyprus, Then Poland, Now These Savings Accounts to Get Confiscated Next
Macro Business - Tumbling US Dollar Boosts Gold -- But that's Just ONE Factor
02/15/14 - Bullion News
TECHNICAL ANALYSIS : King One Eye - Tumbling US Dollar Boosts Gold -- But that's Just ONE Factor
VIDEO : Bloomberg - Is Now Finally the Time to Get Bullish on Gold
CoinWeek - Merit Gold & Silver Lawsuit: Third Bullion Firm Targeted Under California Consumer Protection Law
TECHNICAL ANALYSIS : Silver Pheonix 500 - Silver Global Price Forecast: The Sterling Opportunity
Numismaster - Gold is Freedom
AUDIO : Peak Prosperity - Dan Ariely: Why Humans Are Hard-Wired To Create Asset Bubbles
Gold Chat - Fractional reserve bullion banking and gold bank runs: a run or stroll?
In Gold We Trust - Thoughts Behind PBOC Gold Purchase Policy
Money and Markets - As Bernanke Passes the Buck(s), Gold Will Be a Winner
CNBC - Gold to scale new heights on strong technical picture
Free Shipping on Orders $199+ | 5.0 star Customer Reviews
02/13/14 - Bullion News
VIDEO : TheGoldandOilGuy - Technical Analysis : The Commodity Bull Market Is Starting... Corn, Sugar, Gold, Silver....
TECHNICAL ANALYSIS : Gold-Eagle - Getting Positioned In Precious Metals
Casey Research - Paper Gold Ain’t as Good as the Real Thing
TECHNICAL ANALYSIS : Market Anthropology - Still Waters Run Deep
CNBC - Does China plan to use gold to internationalize the yuan?
Gold Chat - Fractional reserve bullion banking and gold bank runs: bank run theory
Zero Hedge - Gold Breaks Above $1,300
02/12/14 - Bullion News
VIDEO : Bloomberg - What Could Prompt the Next Big Move for Gold?
TECHNICAL ANALYSIS : Zero Hedge - Goldman On Gold - "This Is A Very Important Level To Watch"
Gold Chat - Fractional reserve bullion banking and gold bank runs: the role of central banks
SRSrocco Report - U.S. Mint Nearly Sells Out Of Its Weekly Silver Eagle Allocation In Two Days
In Gold We Trust - January Chinese Gold Demand All-Time Record, 247 Tons
VIDEO : Financial Sense - Fed Taper Too Little Too Late
MoneyBeat - The Dangers of Central Bank Flip Flops on Forward Guidance
VIDEO : Cato Institute - The Libertarian State of the Union: Federal Spending
Casey Research - James Turk on How to Protect Your Portfolio from the Mother of All Bubbles
Investing - Mining Stocks, Chinese Demand, And A Potential Golden Surprise
Business Report - 2000 miners maintain strike at AngloGold Mali mines
02/11/14 - Bullion News
Twitter - (Zero Hedge) Q: Is the Fed financing and enabling the US deficit?
The New York Times - A World Unprepared, Again, for Rising Interest Rates
Gold Chat - Fractional reserve bullion banking and gold bank runs – Frankenstein Free Banking
Deviant Investor - 17 Questions That Deserve Answers
The Telegraph - Gold prices rise amid China's missing bullion mystery
Sprott Thoughts - John Embry: Silver to 100 Dollars within ‘Reasonable Timeframe’
Market Watch - Scary 1929 market chart gains traction
02/10/14 - Bullion News
King One Eye - Is the Gold Bull Back?
TECHNICAL ANALYSIS : Gold Made Simple - Gold price trades above its 100 day moving average and is up nearly 8% from NY lows
Gold Chat - Fractional reserve bullion banking and gold bank runs – inter-bank buddies business
In Gold We Trust - The Gold Market, Part 2
Times of India - Gold smugglers turn creative to beat law
Scrap Monster - Silver demand from India's gigantic solar plant to exceed 20 million ounces a year
VIDEO : Prometheus Market Insight - Has the Stock Market Bubble Burst?
CoinNews - US Government Prints 505.6 Million Banknotes in January 2014
Wall St. On Parade - Suspicious Death of JPMorgan Vice President, Gabriel Magee, Under Investigation in London
Commodity Online - Gold prospectors make a killing in Californian drought
02/09/14 - Bullion News
TECHNICAL ANALYSIS : Zero Hedge - Citi: "Gold Is Putting In A Base"
SilverSeek - Thinking Of Getting Some Silver? (And What To Do With It?)
Inside Futures - Buy Gold On Dip
IBTimes - China's Gold Demand Remains Robust...
Market Watch - For investors, something wicked this way comes
CHARTS : Zero Hedge - Long-Term Charts 1: American Markets Since Independence
King One Eye - Why Are Financial Executives Killing Themselves? Or Are They Killing Themselves?
02/08/14 - Bullion News
Money and Markets - Tapering Toward Tragedy
Inside Futures - How Do You Invest With A Weak U.S Dollar
TECHNICAL ANALYSIS : Kimble Charting - Gold Bugs index creating Bullish inverse head & shoulders pattern?
TECHNICAL ANALYSIS : Wizzen Trading - PDF : Little Bars Lead To Big Bars
AUDIO : FSN - Nick Santiago – Central Banks Trying To Banish Fear
The Epoch Times - Interview with Jim Rickards: Gold Set for Massive Rally
Gold-Eagle - The Game Changer For Gold In One Chart
Market Watch - Silver bullion coin demand has quadrupled in since 2007, says the U.S. Mint
Reuters - Exclusive - UBS seeks first-mover immunity in U.S. currency probe: sources
AUDIO : Peak Prosperity - FerFAL: Here's What It Looks Like When Your Country's Economy Collapses Argentina is showing us the playbook in real-time
Fox Business - Week Ahead: Yellen To Testify Before Congress
VIDEO : Bloomberg - Bling and Glory: What's an Olympic Gold Medal Worth?
02/07/14 - Bullion News
Bullion Vault - Invest 8% Gold "Whatever the Price"
Sunshine Profits - How Can Money Printing Exist and be Absent at the Same Time?
Gold Chat - Fractional reserve bullion banking and gold bank runs - how can I default on thee? let me count the ways
Profit Confidential - The Best Investment You Can Make in 2014?
TECHNICAL ANALYSIS : Trader Dan's Market Views - Weak Payrolls Number spurs Commodity Buying
TECHNICAL ANALYSIS : McClellan Oscillator - Coppock Curve Turns Down
Zero Hedge - Scandal: Bank Of England Encouraged Currency Manipulation By Banks
Midas Letter - Gold and Silver Prices Poised to Rise Dramatically
Zero Hedge - Consumers Max Out Their Credit Cards In Month When Personal Savings Tumble
VIDEO : CNBC - This is what Greenspan is really worried about...
02/06/14 - Bullion News
TECHNICAL ANALYSIS : Gold Made Simple - Gold edges back towards its 100DMA after briefly rising above it yesterday
VIDEO : CNBC - Gold bugs, be patient your time is coming
Gold Chat - Fractional reserve bullion banking and gold bank runs - unallocated as real (gold) bills
TECHNICAL ANALYSIS : King One Eye - Doctor Copper Delivers a Warning to the World
AUDIO : Casey Research - Doug Casey on the Difference Between Investors and Speculators
Investing - Dark Gold: A Mysterious Market by Peter Schiff
FOFOA - Seventeen
AUDIO : Turning Hard Times into Good Times - The Money Bubble. What To Do Before It Pops Jay Taylor Interviews John Rubino & James Turk
Dollar Collapse - Bitcoin: Revolution or Trap? Part 2
Wall St. Cheat Sheet - 7 Reasons Why India Craves Silver
Reuters - As gold supplies are squeezed, India's jewellery imports soar
Outsider Club - Gold Prices Gather Steam as Bullion Disappears From the Market
GoldSilverWorlds - Gold Coins: The Difference Between 24k and 22k
Bloomberg - Fed Is Misled by Wealth Effect
02/05/14 - Bullion News
Sprott Money - Demand for Physical Gold Remains Intense Despite FED Taper Announcement – Nathan McDonald
Gold Chat - Fractional reserve bullion banking and gold bank runs - the model says we are hedged
The Sovereign Investor - A Withdrawal Slip and a Note From Mom
INFO~GRAPHIC : GoldSilverWorlds - How A Physical Gold IRA Can Protect Your Wealth
CNW - Royal Canadian Mint Launches New Silver "Birds of Prey" and 99999 Pure Gold "Call of the Wild" Bullion Coin Series
BDlive - Platinum wage talks collapse, ‘intensified’ strike looms
AUDIO : McAlvany Weekly Commentary - Submerging Markets Propel Gold to Haven Status
SRSrocco Report - 2014 Silver Eagle Sales Limited By Rationed Blank Supply
Bloomberg - Hedge Funds Raising Gold Wagers Dump Copper: Commodities
Bloomberg - Lawsky Said to Open Currency Probe of Over Dozen Banks
Reuters - Lloyds suspends FX trader as investigation deepens
02/04/14 - Bullion News
King One Eye - Gold & China -- The Mystery of The Dog That Didn't Bark
Midas Letter - Downward Spiral Triggered by Quantitative Tapering "Now at $65 billion a month in the U.S., that represents a $240 billion cut in annual welfare payments to the financial services sector"
Gold Chat - Fractional reserve bullion banking and gold bank runs - a bullion bank's "assets"
In Gold We Trust - The Gold Market, Part 1
TECHNICAL ANALYSIS : Zero Hedge - Citi: Stocks, Bonds, Gold, & JPY Levels To Watch
TECHNICAL ANALYSIS : Market Anthropology - Back to the 70's (US Dollar)
Profit Confidential - Exodus Away from U.S. Dollar On?
Gold-Eagle - Gold Arbitrage And Backwardation Part II (the Lease Rate)
VIDEO : CNBC - Marc Faber: Hoping for 40 percent correction
321gold - Gold Bull Janet & The Dow
Scrap Monster - Gold up to 80 kg sneaks through Indo-Nepal border every day
Houston Chronicle - World's only real pirate treasure dug up and coming to Galveston
02/03/14 - Bullion News
Rick Ackerman - Why We Should Be Nervous When Stocks Fall
SafeHaven - Markets Say Tapering Is Tightening
Gold Chat - Fractional reserve bullion banking and gold bank runs - the setup
Casey Research - Now Is the Time to Buy Gold
MineWeb - Gold finds major support from bullish double bottom
Gold Made Simple - Sales of gold coins jump 10% in Australia and over 60% in the US
CHART : Perth Mint Blog - Monthly Sales – January 2014
Deviant Investor - S&P and Gold Extremes and Reversals
Fox Business - Gold Ticks Higher on Disappointing Data
The Golden Truth - Bad Weather And The Economy: Wall Street's Version Of "The Dog Ate My Homework"
VIDEO : Bloomberg - Dr. Copper's Price Taking Hits From China, Automakers
Jesse's Cafe Americain - Dead Bankers, Missing Reporter, and Unfolding Wall Street Scandals
02/02/14 - Bullion News
TECHNICAL ANALYSIS : TheGoldandOilGuy - Is February a Risk-On or Risk-Off Trade: Equities or Gold & Bonds
MineWeb - Christian sees $1320 gold before end of Q1, $1900 long term
Laissez Faire Club - The New American Elite : The Government Class
Sprott Thoughts - “Gold Price Going Up or Mines Will Close” Within 6 Months: Steve Todoruk
AUDIO : Peak Prosperity - Jim Bruce: The Siren Song of 'Money For Nothing'
CHART : 321gold - GOLD, the Mystery Chart
In Gold We Trust - The Need For China To Buy Gold
Silver Coins Today - US Mint Sales of Silver Coins Surge in January; Silver Falls
CPI Financial - GoldMoney: Biggest Gold buying spree since last summer
Dollar Collapse - Bitcoin: Revolution or Trap? Part 1
Zero Hedge - Market Cornered: JPMorgan Owns Over 60% Notional Of All Gold Derivatives
02/01/14 - Bullion News
CoinNews - Gold Rallies in January, US Eagle Gold and Silver Coins Surge
TECHNICAL ANALYSIS : Edge Trader Plus - Gold And Silver – Calls For Explosive Upside In PMs Misplaced
TECHNICAL ANALYSIS : DailyFX - Downside risk accelerates on Silver price as FOMC looms
INFO~GRAPHIC : Visual Capitalist - Which Gold Miners Hold The Most Supply?
SafeHaven - Taper Trouble Hits Gold's No.4 Biggest Buyer (Turkey)
Reuters - Japan turns net importer of gold in Dec, 1st time since July 2010
Gold Chat - Central Bank gold reserves transparency
TECHNICAL ANALYSIS : Market Anthropology - Silver:Gold & the Turk- en-tina Flu
Bullion Vault - Gold Investing a Safe Haven Again. Like, Surprise!
AUDIO : FSN - John Butler – The Golden Revolution: What A Difference A Book Makes
Wealth Cycles - Science Advances Use of Therapeutic Gold, Silver Nanoparticles
Mish's Blog - What the Crisis Taught Us: More Bubbles! We Need Bigger Bubbles to Combat Deflation!
Zero Hedge - Third Banker, Former Fed Member, "Found Dead" Inside A Week
01/30/14 - Bullion News
Money Forever - Bernanke’s Legacy "While banks were making record profits, seniors and savers had been left to fend for themselves."
Outsider Club - Paper Asset Ponzi Scheme Revealed
Library of Economics & Liberty - Keynesian Confirmation Bias
VIDEO : Resource Clips - The global economy according to Chris Berry, Rick Rule, Frank Holmes, Murray John and Frank Giustra
Deviant Investor - The Status of Gold Exchange Traded Funds
Gold Chat - Watching the China 2710 tonne reserves meme creation
Voice of Russia - World mints hastily minting gold coins
Sovereign Man - Presenting the latest country to lose confidence in the dollar...
GoldCore - Faber: “Physical Gold” In Switzerland and Singapore Is 20% Of “Net Worth”
RCP - The Inequality Bogeyman by Thomas Sowell
INFO~GRAPHIC : MINING - How much do metallurgists make
01/28/14 - Bullion News
VIDEO : Bloomberg - Gold and Fed Taper’s Unintended Consequences
CHARTS : Kimble Charting - Margin Debt hits all-time highs! & The Best 13-year inflation hedge is??? (Hint: It's Yellow)
TECHNICAL ANALYSIS : The Market Trend Forcast - Gold and Silver Ready To Rumble Higher?
VIDEO : CNBC - Fed Experimented in 'Price Controls': James Grant
Laissez Faire Club - Debt Ceiling Déjà Vu: The Government That Cried Wolf
Trader Dan's Market Views - Gold Tug of War Continues
AUDIO : McAlvany Weekly Commentary - This Week: Bernanke to Yellen :”Good night and good luck,” Emerging Market Chaos, Currency Crises: Replay 2008?
VIDEO : CNBC - Investors rebel against rate hikes in South Africa, Turkey
GoldChat - The story behind JPM's 10 tonne gold withdrawals
01/28/14 - Bullion News
TECHNICAL ANALYSIS : Gold-Eagle - GOLD, Bottom or Bounce
About.Ag - ALERT ON THE TULVING COMPANY
Scrap Register - US Mint New Year Gold Coin sales hit best since April
Zero Hedge - Overheard In A Gold Vault In Singapore: "We Need Additional Capacity", China's Appetite Is "Insatiable"
Acting Man - Bitcoin, Gold, and the Quantity of Money
Mish's Blog - Credit Equals Gold No.1
In Gold We Trust - Central Bankers Know All About Gold
The Gold Report - David Morgan: 'The Silver Bottom Is In: Time to Hold, Add and Ride It Out'
Scrap Monster - World’s Biggest Gold Producer-Barrick Gold Corp Warns Drop of Production
Gold Made Simple - Indian government admits 3000kg of gold a month is being smuggled into the country – restrictions to be eased soon?
AUDIO : Silver-Investor - 79% Of Americans Say We're Still In Recession
TECHNICAL ANALYSIS : Market Anthropology - Just Another Tequila Sunrise
Bonner & Partners - Don’t Buy the Dip...
Gold Chat - Diversified Precious Metals Portfolio
Free Shipping on Orders $199+ | 5.0 star Customer Reviews
01/27/14 - Bullion News
Midas Letter - China’s ICBC Analagous to Bear Stearns First Domino in Crisis
Dollar Collapse - What Blows Up First? Part 3: Subprime Countries
King One Eye - Doctor Copper's Warning
VIDEO : CNBC - Rick Santelli - Current stock market vs. 1929
In Gold We Trust - Week 3, 2014 Withdrawals From SGE Vaults 60 Tons, YTD 159 Tons
Investor Intel - China’s gold hunger — and what that means for Beijing’s global financial power
VIDEO : GGR - Biderman and Bianco for January 2014
Bullion Vault - Floor for Gold Price at Last?
Money and Markets - Ron Paul Podcast: It’s Time, Again, for a Government-Spending Reality Check
Gold Broker - Argentina Gold Going Crazy
AUDIO : Peak Prosperity - James Turk: We're Living Within A Money Bubble of Epic Proportion
Plata - Hugo Salinas Price: 'Everything in our modern world is a lie' (Exclusive interview!)
01/26/14 - Bullion News
Shanghai Metals Market - Speculators raise copper, gold length, cut silver longs - CFTC
The Sovereign Investor - A Golden Opportunity to Insure Your Lifestyle
TECHNICAL ANALYSIS : Gold Scents - THE MOST DANGEROUS CHART IN THE WORLD
Bloomberg - Gold Mint Runs Overtime in Race to Meet World Coin Demand
CNBC - Huge short squeeze could spike gold
Seeking Alpha - 3 Friendly Reminders Why I Buy Silver
MineWeb - China ties new gold ‘spot’ contract to the Yuan
Sober Look - Fed's taper and weaker foreign participation will leave domestic investors with higher proportion of treasury purchases
TECHNICAL ANALYSIS : CEO.CA - A Looming Global Flight to Quality
Financial Express - Minting, printing and counterfeiting - Although (circulated) coins are physically durable, they fail to withstand inflation
Mish's Blog - Mid-Level Manager at Target Responds to Mish Part-Time Job Thesis
01/24/14 - Bullion News
The Golden Truth - Something Ominous May Be Coming At Us
TECHNICAL ANALYSIS : Nifty Charts - Gold Bullish Price Action and Resistance Levels
VIDEO : 321gold - Technical Analysis : Gold Market Key Indicators Are Bullish
CoinNews - 2014 America the Beautiful Quarters – Release Dates and Images
TECHNICAL ANALYSIS : ZEAL - Gold Bottoming
AUDIO : Sprott Money - Ask the Expert – Peter Schiff
MineWeb - Global mined gold output rose 4% in 2013
Gold Chat - Wealthy Chinese short sellers a source of future demand?
Perth Mint Blog - Year Of The Horse 5oz Silver Bullion Coin Available Now
Money Morning - One of the Many Reasons Gold was Up Yesterday...
Gold Made Simple - Does Germany hold the key to higher gold prices in 2014?
Cato Institute - Food Stamp Growth Continues, Despite Economic Recovery
McClellan Oscillator - Important Points About The Minimum Wage
Zero Hedge - How the Paper Money Experiment Will End
01/23/14 - Bullion News
TECHNICAL ANALYSIS : Zero Hedge - Bank Of America: "Gold Squeeze Gets Explosive Above 1270"
Daily Reckoning - When Gold Knocks On China’s Front Door
Profit Confidential - Why We’re Headed for a Period of Stagflation and What It Means for Investors
VIDEO : CNBC - Cashin: Why 'everybody is on alert'
King One Eye - Stocks Swoon, Gold Soars
MoneyNews - South African Strike Hits World's Top Platinum Producers
GoldSilverWorlds - Russia Adds 79.5 Tonnes Of Gold In 2013 To Its Reserves
GoldCore - China Reports Gold Reserves Unchanged Again at End 2013
In Gold We Trust - Open Letter To CPM Group
Bloomberg - Abenomics Spurs Gold Sales in Japan as Inflation Hedge
SilverSeek - Silver “Bullets” – Not just about Vampires and Werewolves - by David Morgan
forexlive - London fix on the way to the scrapheap as volumes plunge
The Real Asset - Understanding the London Gold Fix
Gold Chat - Gaming the London Fix ... Seat Price
01/22/14 - Bullion News
TECHNICAL ANALYSIS : Trader Dan's Market Views - Range Trade in Gold remains Intact
B2C - Gold Market to See Supply Shock in 2014?
Profit Confidential - Massive Shock Coming to the Gold Market Soon?
AUDIO : McAlvany Weekly Commentary - 3 Canaries in a Coal Mine: Watch Them Closely!
Deviant Investor - 14 Questions for 2014
Bloomberg - Century-Old London Gold Benchmark Fix Said to Face Overhaul
Bullion Vualt - Gold Market to See Supply Shock in 2014?
Peak Prosperity - "Endless Growth" Is the Plan & There Is No Plan B
SRSrocco Report - Is The U.S. Running Out of Gold Scrap?
Numismaster - No Gold in Warehouse?
Business Insider - Here's Ray Dalio's Advice For Investing In The Market Cycle We're In Right Now
01/21/14 - Bullion News
TheGoldandOilGuy - Gold Market Traders: Metals And Stock Market will Swap Trends – Part II
Reuters - Gold holds steady below six-week high
Bullion Vault - Gold Bars at NY Fed "Need Recasting", Says Bundesbank
Gold Chat - The Bundesbank & the Narrative of Central Bank Omnipotence
Kimble Charting - Hollywood and Gold investors have poor timing at extremes?
South China Morning Post - Asian players develop an appetite for risky commodities trading - Capital-rich Asian firms show interest as Western banks exit sector
In Gold We Trust - Chinese Gold Leasing: Hidden Danger
TECHNICAL ANALYSIS : King One Eye - 3 Charts on Gold
CoinWeek - The Coin Analyst: Forces Shaping Precious Metals in 2014
INTERACTIVE CHART : U.S. Global Investors - Explore how natural resources have performed over the last 10 years
01/20/14 - Bullion News
TECHNICAL ANALYSIS : Nifty Charts - Gold Chart at Crucial Resistance Zone
TECHNICAL ANALYSIS : Nifty Charts - Silver Chart Update
VIDEO : Gold Switzerland - THE MATTERHORN INTERVIEW 2014 SPECIAL Interview with James G. Rickards; author, economist, lawyer. entrepreneur.
TECHNICAL ANALYSIS : Rambus Chartology - Precious Metals…A Reversal of Fourtune ?
Bloomberg - Platinum Mines Face Biggest Strike Since Deadly ‘12 Clash
SilverSeek - Silver – The Power Of Thought Will Ultimately Prevail
VIDEO : Cambridge House - The US is living a lie - David Morgan Interview
MineWeb - Deutsche Out, China In for the Fix?
The Real Asset - Daily Nugget – The gold price climbs as China gets ready to announce...
Shanghai Daily - China Expected to Announce it has more than Doubled Gold Reserve, Expert says
VIDEO : Cambridge House - Mike Maloney: The US Dollar WILL Collapse!
Bullion Vault - Central Banks, Gold & the Currency Market, Part II
01/19/14 - Bullion News
McClellan Oscillator - Gold Breaks Downtrend, Sort Of
PDF : Wizzen Trading- Technical Analysis : Gold’s Base Building
Silver Coins Today - 2014 Australian Gilded and 1/10 Oz Koala Silver Coins
TECHNICAL ANALYSIS : ZenTrader - Speculative Buying Underlies Strength In Silver
Gold-Eagle - China Expands Gold Reserves, Surged Past Italy and France in Ranking
Seeking Alpha - Preciously Functional: Palladium May Outshine Its Cohorts ... Again
Zawya (Dubai) - DSF gold sales strongest in seven years, jewellers say
01/18/14 - Bullion News
TECHNICAL ANALYSIS : Edge Trader Plus - Gold – Disconnect Between Fundamentals And Price. Perception Rules
The Economic Times - Gold will rally, but silver will do better: Jim Rogers
AUDIO : Sprott Money - Weekly Wrap Up : Eric Sprott on Bafin's Findings on Metals Manipulation
ZEAL - Gold Drives Silver
AUDIO : Peak Prosperity - A New Way to Hold Gold
CoinNews - Gold Up for 4th Week; 2013 vs. 2014 US Mint Bullion Sales Starts
In Gold We Trust - Spectacular Gold Demand (79 Tons) on SGE in Week 2, 2014
SRSrocco Report - U.S. Total Gold Exports Up 31% In October 2013
VIDEO : Future Money Trends - The Money Bubble...& Gold & Bitcoin - John Rubino Interview
MoneyBeat (WSJ) - New Warnings From an Investing Pioneer

SD Bullion - 4.8 star Customer Reviews
01/17/14 - Bullion News
TECHNICAL ANALYSIS : MoneyBeat (WSJ) - Gold Bugs Poised to Pounce on Next Big Rally
Reuters - How London's gold and silver price benchmarks are "fixed"
Bloomberg - Metals, Currency Rigging Is Worse Than Libor... Bafin
Gold Chat - What Bafin's König really said about precious metals manipulation
Sprott Asset Mgmt - One More Sign of Manipulation in the Gold Market by Eric Sprott
VIDEO : Kitco - Global PMI: Key Number To Track Says Frank Holmes
CHART : King One Eye - Commodity Prices in the Bernanke Era
Acting Man - The Mainstream Loves to Hate Gold
VIDEO : Bloomberg - Fed-Fueled Stock Market Rally: A Bull Built on QE
Gold Made Simple - China to launch Yuan backed gold contract – another move towards Yuan gold backing?
In Gold We Trust - The Big Reset, Part 1
The Real Asset - Palladium, the one to watch in 2014?
The Australian - World's Biggest Gold Coin Goes on Tour
01/16/14 - Bullion News
Bullion Vault - Gold Prices Bottoming, "Long-Term Buy": CPM's Christian
Gold-Eagle - Gold As A Deflation Hedge
Peak Prosperity - Why We All Lose If the Fed Wins by Chris Martenson
VIDEO : Bloomberg - Bernanke on Crisis: We Did the Right Thing, I Hope
Zero Hedge - Who Are The Top Holders Of US Treasurys
The Bullion Desk - Shortage of large gold bars leads to rare London premiums
Gold Chat - How to know when there is a real physical-paper disconnect developing
Shanghai Metals Market - Silver Could Rise in 2014 — Here are 4 Reasons Why
MineWeb - Notable physical demand keeps bearish gold thoughts in check says HSBC's James Steel
POLL : Gallup - More Americans Worse Off Financially Than a Year Ago
01/15/14 - Bullion News
Casey Research - Contrarians’ Wildest Dream Coming True
VIDEO : Zero Hedge - Marc Faber Warns "The Bubble Could Burst Any Day"; Prefers Physical Gold To Bitcoin
Bullion Vault - Gold Mining Costs "Put Floor" at $1150, Supply to "Decline Rapidly"
VIDEO : Bloomberg - Will Gold Rally in 2014?
King One Eye - Top 10 Reads on Gold and Silver -- the best values in decades!
CHART : Kimble Charting - These 3-year worst performers (Dogs) about to perform well?
VIDEO : GoldBroker - Physical Gold, the Safest Asset in an Unsafe World
Coin Update - Silver Eagle Bullion Allocation to Drop Next Week
In Gold We Trust - Zhang Bingnan: Gold Safeguarding National Economy
The New York Times - China Grants Gold Import Licenses to Foreign Banks for First Time: Sources
AUDIO : FSN - Jerry Robinson - Is China's 24 Trillion Credit Bubble Abut to Pop?
Profit Confidential - If Gold’s a Bad Investment, Why Is This Country Buying 150% More of It?
Deviant Investor - Fire and Ice: Inflation and Deflation
NDTV (India) - Government seeks gold purchase information from jewellers as smuggling rises
01/14/14 - Bullion News
Money Morning - 1,600 Reasons to Buy Gold
TECHNICAL ANALYSIS : Gold Made Simple - Gold price trades back above the average cost of production – now up 6% from the new-year’s eve lows
GoldSilverWorlds - Gold Coin Demand Exploding In Europe And China On Gold’s Price Lows
Perth Mint Blog - Platinum Platypus To Continue In 2014
TECHNICAL ANALYSIS : Market Anthropology - Esoterica
Market Watch - Monday selloff is a warning sign
CHART : Kimble Charting - Three largest SPY declines in 7-years took place when this happened!
Numismaster - Gold: Bad Year, Good Decade
Mish's Blog - Gold Manipulation: Is it Illegal? Risk Free? What About JP Morgan?
Dollar Collapse - Europe’s Really Bad 2014 In Two Charts
Bullion Vault - China Slowdown Speeds Up
Perth Mint Blog - Why Gold Can Never Be In A Bubble
SHTFplan - Top Strategist: A Shocking Revelation About Gold Mining Companies
01/13/14 - Bullion News
CoinNews - 2014 American Silver Eagles Limited in Sales Start
VIDEO : Bloomberg - Jim Rogers Explains How Capitalism (the Free Market) is Suppose to Work
Commodity Trade Mantra - Economy Outlook For 2014 – From An Austrian Economist’s Perspective
GoldSeek - Why China wants low Gold prices?
Coin Update - First Day 2014 Silver Eagle Bullion Sales Reach 3,180,500
Seeking Alpha - Open Letter To Gold Investors: Will The Real Manipulator Please Stand Up?
CEO.CA - Silver Poised for Breakout
VIDEO : SGT Report - "He Who Owns the Gold Makes the Rules" -- DAVID MORGAN
01/12/14 - Bullion News
Silver Coins Today - 2014 American Eagle Silver Coins, Ordering Limits on Release
TECHNICAL ANALYSIS : TheGoldandOilGuy - New Gold Bull Market Has Started
TECHNICAL ANALYSIS : Trading to the Mark - Gold retrospective for 2013: If you traded with these charts, you profited
Zero Hedge - Did Goldman Just Kill The Music? - "The S&P500 Is Now Overvalued By Almost Any Measure"
The Indian Express - A golden corridor
INFO~GRAPHIC : Bloomberg - Waste : Congress funds another project that America doesn't need
01/11/14 - Bullion News
TECHNICAL ANALYSIS : Edge Trader Plus - Gold And Silver – There Are Reasons Greater Than Demand For Owning Them
My Record Journal - Man charged with selling fake Morgan Silver Dollars
MoneyBeat - When Does A Bubble Spell Trouble?
Forbes - The Most Reliable Indicator Of An Approaching Market Top
McClellan Oscillator - Presidential Cycle Inverting?
MoneyNews - Gold, Silver Imports by India Tumble as Government Keeps Curbs
Reuters - Shanghai Gold Exchange eyes launch of international board
Zero Hedge - When A Stock Bubble Goes Horribly Wrong And Hyperinflation Results
VIDEO : Bloomberg - El-Erian: Jobs Report Puzzling, Worrisome, Shocker
XinhuaNet - China to expand cross-border use of RMB: PBOC
01/10/14 - Bullion News
BullionVault - Fed Tapering, Jobs & Gold
CoinWeek - How to Avoid Becoming the Victim of a Fake Gold Coin
TECHNICAL ANALYSIS : SilverSeek - Silver Bottoming?
TECHNICAL ANALYSIS : Rambus Chartology - Gold… The Bull vs Bear ; Checkmate or Game On ?
King One Eye - Gold and Jobs, Aqua Vortex Edition
Bloomberg - China Seen by Bloomberg Industries Boosting Bank Gold Reserves
CoinWeek - Precious Metals IRAs … A Primer
Wall St. Cheat Sheet - Are Goldbugs Getting More Physical?
01/09/14 - Bullion News
VIDEO : CNBC - Who will buy Treasurys now?
VIDEO : Prometheus Market Insight - Technical Analysis : Historic Sentiment Extreme Suggests Stock Market Bubble on Verge of Collapse
Business Insider - MONETARY TECTONICS: Here Are 50 Slides Detailing The War Between Inflation And Deflation
VIDEO : Bloomberg - Gold Restrictions Fuel Black Market in India
Numismaster - Will 2014 Gold Eagle Demand Beat 2013?
Money and Markets - What's Ahead for Gold?
AUDIO : McAlvany Weekly Commentary - 2014: Year of Unintended Consequences
TECHNICAL ANALYSIS : Market Anthropology - Australian for Gold
CSInvesting - Tobin’s Q: The Market is 60% Overvalued
Perth Mint Bullion - Comex Stocks: Claims On Bullion Well Below Historical Highs At 5:1
MINING - Canada's coldest mines
01/08/14 - Bullion News
Silver Coins Today - Ending Annual Sales Record for 2013 American Eagle Silver Coins
BMD - What are Physical Precious Metals Capital Gains Rates...
ETF Daily News - Why Gold Still Belongs In Your Portfolio
VIDEO : Bloomberg - Can Palladium Build on a Strong 2013 Market?
Zero Hedge - One Week Into 2014, UK Royal Mint Runs Out Of Gold Sovereigns
Casey Research - 23 Reasons to Be Bullish on Gold
MineWeb - Nic Brown of Natixis looks at some of the big themes likely to be seen in the gold market over 2014 and explains why he is a big fan of platinum
Daily Reckoning - The Best Bet Against a Reckless Fed
FOFOA - Chapter 1
TheGoldandOilGuy - The Most Important Trading Tool That Money Can’t Buy
Coin Update - 2014 Silver Eagle Bullion Coin Sales Begin January 13
Zero Hedge - They Give Awards For That?!
Kimble Charting - Finally proof…”Deflation” is taking place at the Fed!
01/07/14 - Bullion News
VIDEO : CNBC - Ron Paul: Correction hasn't corrected anything
VIDEO : CNBC - Inflation Threat
MineWeb - Further short term volatility for gold expected
INFO~GRAPHIC : GoldSilverWorlds - The Wonderful Uses Of Silver
VIDEO : Kitco - No U.S. Economic Recovery Says James Turk
TECHNICAL ANALYSIS : Market Anthropology - Two roads diverged in a yellow wood...
GoldSeek - It’s not (just) about the Gold by David Morgan
In Gold We Trust - China’s FX Research Center: Gold Is The Strategy
Proactive Investors - Spot gold continues to firm as Asian investors snap up physical bullion
Zero Hedge - Gold "Speculation" Drops To Record Low
AUDIO : Tom Woods - David Stockman: Krugman Wrong, Critics Right About Fed, Economy
Business Week - BullionVault’s Gauge of Client Buying Declines to Five-Month Low
CoinNews - How the Denver Mint Makes Dies to Produce Coins

Affiliate Ad
01/06/14 - Bullion News
Daily Reckoning - The Terminal Velocity of Money
TECHNICAL ANALYSIS : Acting Man - Gold in 2014 and Beyond
Trader Dan's Market Views - A Real FLASH CRASH
Mining - Shorts could be behind gold price flash crash
TECHNICAL ANALYSIS : Gold Made Simple - Gold price now up 5% in 2014 but remains UNDER the cost of production for nearly a month
GoldSilver - Weimar Hyperinflation's 1000 Billion Mark Note | Mike Maloney
Capital Liberty News - Jim Rogers: Collapse of the Federal Reserve is ‘a probability’
VIDEO : Silver-Investor - David Morgan's 2014 Silver Survival Guide
Reuters - India considers easing gold import curbs - govt sources
Gold Chat - Reinhart and Rogoff: 1933 US gold reprice was a debt default
BusinessWeek - SNB Expects $10 Billion Loss for 2013 as Gold Price Plummets
01/05/14 - Bullion News
PDF : Wizzen Trading - Technical Analysis : Double bottoms Up
ElliottWave - Historic Optimism in the Stock Market - What Does it Mean?
Market Watch - Stock market to find out if the Fed made the right move, Week ahead: FOMC minutes, jobs report, and a slow start to earnings season
MineWeb - Don’t get too carried away by gold’s good 2014 start
In Gold We Trust - Unprecedented Total Chinese Gold Demand 2013
Daily Reckoning - The Fed’s War on Pennies
AUDIO : McAlvany Financial - First High Quality Gold Hoard In Over A Decade
CSInvesting - Templeton’s 16 Rules; Go Where the Outlook is MOST Miserable; Young Investors
Sprott's Thoughts - Who Is Teaching the Young About Investing?
01/04/14 - Bullion News
Acting Man - This Unexpected Event Will Cut the S&P 500 in Half
AUDIO : Peak Prospertiy - Brian Pretti: The World's Capital Is Now Dangerously Boxed In - Creating asset bubbles ready to burst
CoinWeek - The Coin Analyst: U.S. Modern Coins in 2014 U.S. Global Investors - Interactive Recap: Our Favorites from 2013
01/03/14 - Bullion News
VIDEO : CNBC - We'll have to wait till Monday to see if "things get real" here - Art Cashin
TDMV - Strong Physical Demand out of Asia is the story
VIDEO : CNBC - 2014 won't be a good year for the US dollar says Michael Woolfolk, Currency Strategist at BNY Mellon
The Telegraph - IMF paper warns of 'savings tax' and mass write-offs as West's debt hits 200-year high Debt burdens in developed nations have become extreme by any historical measure and will require a wave of haircuts, warns IMF paper
Market Watch - Gold has its S.O.S. moment, and it’s bullish
Zero Hedge - Physical Gold Demand Soared As Gold Price Tumbled In 2013
Seeking Alpha - Eric Parnell Positions For 2014: The Payoff In Precious Metals Has Enormous Potential
SRSrocco Report - The Historic Gold-Oil Ratio Forecasts A Much Higher Price For Gold
Perth Mint Bullion - Monthly Sales - December 2013
VIDEO : GoldBroker - The Coming Failure of the Gold Paper Market and the Importance of Owning Physical Gold as Insurance
01/02/14 - Bullion News
Resource Clips - Fools for Gold - Matthew Hart examines how the yellow metal makes men mental by Greg Klein
AUDIO : Korelin Economics - Rick Ackerman and Technicals – Thu 2 Jan, 2014
Financial Sense - Gold Down 28% in 2013 Despite "Skyrocketing Demand"
Library of Economics & Liberty - Why Government Doesn't—and Can't—Manage Resources Like a Private Business
In Gold We Trust - Sun Zhaoxue: US Intends To Suppress Gold To Ensure Dollar’s Dominance
How Fiat Dies - How We Know Inflation is Coming
Cyniconomics - 2013 Most Viewed Posts
Forbes - U.S. Mint Gold-, Silver-Coin Sales Rise In 2013 On Retail Bargain Hunting
Brisbane Times - Gold and silver bullion worth $200K stolen from war veteran's home - Australia
Brisbane Times - Bullion collector fourth to be robbed in recent months - Australia
AUDIO : ABC Brisbane - Police appeal for help in bullion theft - Australia
01/01/14 - Bullion News
The Sovereign Investor - This Hated Sector Will Surprise Everyone in 2014
Investing - Silver A Wise Investment Against Inflation
My Budget 360 - The Great Income Divide: IRS data shows 50 percent of households make less than $35,000 per year. Top 10 percent pay 68 percent of income taxes
SoberLook - By the End of 2014, Student Loan Balances held by the Federal Government will Exceed $850 Billion
Perth Mint Bullion - 2014 Australian Kookaburra 1oz Silver Bullion Coin Sold Out
McAlvany Weekly Commentary - Albert Cheng: Gold Markets Move East
321gold - Bitcoin Takes on Gold
The Japan Times - Bank of Japan likely to maintain easing policy, chief says
Other pages, on this Guide, that you
may like...


For Bullion Market News...
Notice:
The charts, commentary, and information on the Free-Bullion-Investment-Guide.com are in no way an endorsement of how you should invest or divest.
|
Support this Guide & Paypal Thank You for Your Support |
|
|
 | |||||

Recent Articles
-
Newsletter of the Free Bullion Investment Guide - April 2026
Apr 05, 26 04:44 PM
 The April 2026 newsletter of the Free Bullion Investment Guide provides the latest updates, fundamental and technical gold and silver market analysis, the best articles from last month, and a list of…
 -
Newsletter of the Free Bullion Investment Guide - February 2026
Feb 07, 26 02:12 PM
 The February 2026 newsletter of the Free Bullion Investment Guide provides the latest updates, fundamental and technical gold and silver market analysis, the best articles from last month, and a list…
 -
Newsletter of the Free Bullion Investment Guide - January 2026
Jan 07, 26 04:07 PM
 The January 2026 newsletter of the Free Bullion Investment Guide provides the latest updates, fundamental and technical gold and silver market analysis, the best articles from last month, and a list o…
 -
Newsletter of the Free Bullion Investment Guide - December 2025
Dec 07, 25 04:35 PM
 The December 2025 newsletter of the Free Bullion Investment Guide provides the latest updates, fundamental and technical gold and silver market analysis, the best articles from last month, and a list…
 -
Newsletter of the Free Bullion Investment Guide - November 2025
Nov 08, 25 01:58 PM
 The November 2025 newsletter of the Free Bullion Investment Guide provides the latest updates, fundamental and technical gold and silver market analysis, the best articles from last month, and a list…

18W LED Security Light (Dusk to Dawn & Motion Sensor) - $32.99
from:
 LED Lighting

) (as of March 11, 2011)")
This website is best viewed on a desktop computer.
Keep this Guide Online
& Paypal
Thank You for
Your Support
with Feedly
Search the Guide
| search engine by freefind | advanced |

Give a lasting gift of the iconic Silver Maple Leaf bullion coin [More]
Free Shipping on Orders over $100 (CDN/USA)
The Sovereign 2026 Gold Bullion Coin in Card

Britian's
Royal Mint

Daily
Newsletter
Mintages & Photos
|

|
Silver Panda |

Mintages
for
2024
Gold, Silver, & Platinum
Austrian Philharmonic Bullion Coins

|
Silver Philharmonics  |
Platinum Philharmonics

Platinum and Palladium Bullion


Mintages
for
2025
Gold & Silver Mexican Libertad
|
Gold Libertads |


Updated Mintages for
American Gold Buffalo
American Gold Eagle
American Silver Eagle
2024 & 2025
Jerusalem of Gold Bullion
Coin photos
(bottom of page)
 Obverse side")


Help Us Expand our Audience by forwarding our link
www.free-bullion-investment-guide.com.
Thank You!
Last Month's

In No Particular Order
April 2026
|
All Articles were Originally Posted on the Homepage Gold Nanoparticle Cancer ResearchSona Nanotech’s Hyperthermia Platform Boosts Immunotherapy Response in Colorectal Cancer Study - Tipranks Sona Nanotech Showcases Cancer Therapy Results At Prestigious Industry Cancer Conferences - Financial Times Development of gold nanostars coated with mesoporous silica for chemo-photothermal therapy - Published Research Paper - Journal of Drug Delivery Science and Technology (Science Direct) |
All Articles were Originally Posted on the Homepage


Click Ad to Request a Free Appraisal Kit
ExpressGoldCash
Customer Reviews 4.9 stars


Give a lasting gift of the iconic Silver Maple Leaf bullion coin [More]
Free Shipping on Orders over $100 (CDN/USA)
