Homepage / Archived News or Quarterly News / 4th Quarter 2014
4th Quarter - 2014
Charts, Bullion News & Commentary
This page provides a comprehensive overview of the U.S. Dollar, Gold, Silver, Platinum, and Palladium during the 4th Quarter of 2014.
For the U.S. Dollar and each of the precious metals, you'll find charts, and you will find Bullion News Headlines from the quarter. Every news link was originally posted on this guide's homepage.
The quarterly charts provide insight into the volatile precious metals markets, while the news below the charts provides a deeper understanding of the fundamentals influencing these markets.
The charts below are provided courtesy of
US Dollar Charts - 4th qtr. of 2014
US Dollar Price Chart (October 1st, 2014 - December 31st, 2014)

Bullion News
The US Dollar
During the 4th Quarter of 2014, the US Dollar Index moved in the same direction as it did during the 3rd quarter of 2014; up.
There are several reasons why the US dollar has moved up since July.
- The decision by the Fed to end its QE (quantitative easing) program late last year has resulted in the US dollar gaining strength, as the markets look forward to a change in the Fed's monetary policies.
- Positive U.S. GDP: 2nd Quarter GDP was 4.6%, 3rd Quarter GDP was 3.5%, and consumer sentiment was recorded at its highest levels since the financial crisis.
- The massive monetary expansion by the Bank of Japan has resulted in a stronger dollar against the yen.
- Fear of a recession in Europe, and Mario Draghi (President of the European Central Bank) is expected by the markets to implement his form of QE, which has weakened the Euro against the US Dollar.
- The markets expect Janet Yellen, the Federal Reserve Chairman, to raise short-term interest rates.
(continued...)
US Dollar Price Chart (October 1st, 2013 - December 31st, 2014)

Bullion News
US Dollar Price Chart (January 1st, 2013 - December 31st, 2014)

Bullion News
Interest Rate Hike???
The possibility of an interest rate hike is slim to none for FY15; the articles below explain why I make this prediction.
These articles help this argument
- VIDEO : Bill Gross: "New Natural Interest Rates is Zero or Negative"
- 555 Trillion Reasons Why Central Banks Won't Let Rates Normalize
- VIDEO : KLEINSCHMIDT – CONTRARIAN VALUE - Tocqueville Fund’s Robert Kleinschmidt prides himself on being an independent thinker...While the rest of Wall Street has been expecting the Federal Reserve to raise interest rates he says they won’t and explains why...
- The
government is already in a soft default and is addicted to low interest
rates: Government expenses at $3.87 trillion while receipts enter at
$3.29 trillion
SilverGoldBull - Customer Reviews - 5.0 stars
Gold Price Charts - 4th qtr. of 2014
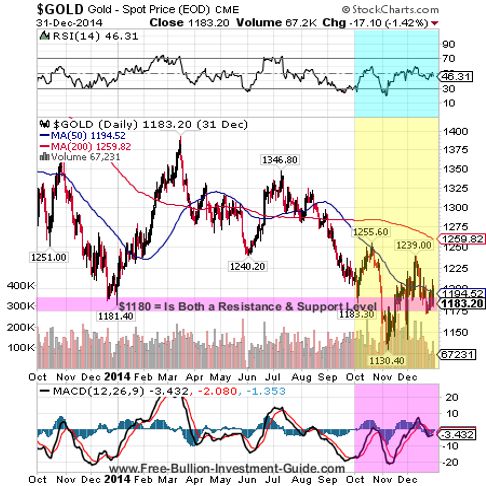
Gold Price Chart (October 1st, 2014 - December 31st, 2014)

Bullion News
Gold Price Summary
The price of gold during the 4th quarter of 2014 moved up and down.
Early in November, the price of gold broke below its support level of $1180 a troy ounce, to a low of $1130 a troy ounce.
The break in Gold's support level completed and confirmed a triple bottom in gold's chart.
The RSI (Relative Strength Indicator) is in neutral territory, indicating the price of gold could literally go in any direction.
However, the MACD's histogram (blue bar chart) looks to be about to take a positive move in the next quarter, indicating the price may be about to move higher.
(continued...)
Gold Price Chart (October 1st, 2013 - December 31st, 2014)
Bullion News
When the price of gold broke below the $1180 support level, it turned into a new resistance level.
Looking at the 3year gold price chart (below), gold made $1180 a new resistance level when it broke below it. Gold's other price resistance levels for gold are $1350, $1400 and $1550.
Gold Price Chart (January 1st, 2012 - December 31st, 2014)

Bullion News

Silver Price Charts - 4th Qtr. of 2014
Silver Price Summary
Silver's price movement, during the 4th quarter of 2014, mimicked gold's
choppy trade. (continued...)
Silver Price Chart (October 1st, 2014 - December 31st, 2014)

Bullion News
If you look at silver's one-year chart below, you can see that late in the 3rd quarter of 2014, silver broke below its support level of $18.00 a troy ounce.
During most of this quarter, the price of silver stayed above its new support level of $15.00 (shown in the chart below).
However, early in December, the price of silver traded as low as $14.15, which ties to a previous support level (shown in the 7-year chart at the bottom of this section on Silver), but it managed to close that day above $15.00.
(continued...)
Silver Price Chart (October 1st, 2013 - December 31st, 2014)

Bullion News
Like gold, silver's RSI is in a neutral range, and its MACD suggests a possible improvement in the price of silver in the next quarter.
Silver Price Chart (January 1st, 2012 - December 31st, 2014)

Bullion News
Silver 7-year Chart
Silver Price Chart (March 1st, 2007 - December 31st, 2014)
The chart below shows the upper support level (red highlight) where silver hit $15.00 a troy ounce in this quarter and in 2010.
Silver's lower support level indicates it reached $14.15 in this quarter and 2009, and breaking below the long-term support level of $15.00 a troy ounce suggests it may repeat this trend in the near future.

Silver 7-year chart provided by TradingView.com

Platinum Price Charts - 4th qtr. of 2014
Platinum Price Summary
Platinum's price in the 4th quarter of 2014 consistently made lower highs and lower lows. (continued...)
Platinum Price Chart (October 1st, 2014 - December 31st, 2014)

Bullion News
Platinum Price Chart (October 1st, 2013 - December 31st, 2014)

Bullion News
Platinum's price peaked early in the 3rd quarter of 2014, at $1523.80 a troy ounce, briefly breaking its resistance level of $1500.
But
it seems the strength in the U.S. dollar has not only taken the wind
out of gold and silver, it has also crushed platinum's price, so much so
that platinum fell through its old support level of $1295, turning it
into a new resistance level for the precious metal.
However, like gold and silver, platinum's RSI is in neutral territory, and its MACD is showing a possible price recovery in the 1st quarter of 2015.
Platinum Price Chart (July 1st, 2011 - June 30th, 2014)


ExpressGoldCash - 4.9 star - Customer Reviews
Palladium Price Charts - 4th qtr. of 2014
Palladium Prices
The price of Palladium during the 4th Quarter of 2014 was very choppy, but generally, it moved in a positive direction. (continued...)
Palladium Price Chart (July 1st, 2014 - September 30th, 2014)

Bullion News
Palladium Price Chart (October 1st, 2013 - December 31st, 2014)

Palladium's demand has been rising from automobile sales and the price has continued to be supported by this fact.
Palladium Price Chart (January 1st, 2012 - December 31st, 2014)

The charts above are provided courtesy of
4th Quarter - 2014
Bullion News & Commentary
The Quarterly News starts with the end of the quarter articles, first.
Please note that not all of the links below work; the links are kept because the headlines still provide insight into how the markets were moving at the time.
12/31/14 - Bullion News
Gold Market Macro - Low gold prices are a blessing in disguise for physical gold accumulators
Daily Reckoning - Why You Should Be Prepared for Both Inflation and Deflation
CEO.CA - Why I Bought Gold Today
CHARTS : Zero Hedge - Gold & Silver Slammed Back Below FOMC Levels
CHART : Jesse's Cafe' Americain - US Dollar Very Long Term Chart for Year End 2014
VIDEO : Bloomberg - James Rickards : A Tough Year for Energy: Why Commodities Are Crashing
TECHNICAL ANALYSIS : Market Anthropology - Fill'er Up
GoldReporter.de - Turkish gold imports surge in November - Google Translation Link
Daily Sabah - Turkish gold imports surge in November
VIDEO : Finance and Liberty - David Morgan - Liberty Mastermind Webinar
GoldSeek - Why You Need to Own Gold In 2015 and Beyond
Mises Institute - Government Spending Does Not Help the Economy 12/31: CNBC - 5 Most Egregious Examples of Government Waste This Year
Zero Hedge - Gold Held In NY Fed Vault Drops To Lowest In 21st Century After Biggest Monthly Withdrawal Since 2001
12/30/14 - Bullion News
US Global Investors - Gold Beat All Other World Currencies in 2014
CHARTS : Zero Hedge - "Peak Gold Production" Hits In 2015
Business Insider - Investors Need To Understand The Relationship Between The US Dollar And Commodities
Money Morning - 2015 Silver Price Forecast
BullionStar - The Netherlands Planned To Introduce New Currency In 2012
The Bullion Desk - Gold lending rates remain in backwardation as physical demand improves
Gold-Eagle - U.S. Mint Gold-Coin Sales Head for Biggest Drop in Eight Years
TECHNICAL ANALYSIS : SOLARCYCLES - End Of 2014
EconomicPolicyJournal - Bernanke Admits What Really Happens at Fed Meetings...It's All Scripted by Staffers
CHART : Kimble Charting - Domestic stock funds experience $600 Billion of outflows
MoneyBeat (WSJ) - Fed Downplays Worries About Leveraged ETFs
VIDEO : Algo Trades - Final Forecast Of The Year!
12/29/14 - Bullion News
MINING - Dollars and Gold Revisited by Mickey Fulp - The Mercenary Geologist
Market Watch - Bernanke's "Mission Accomplished" Moment | Bernanke tells U.K.’s King: We saved our economies
Advisor Perspectives - Treasury Snapshot: Where Are Yields Headed in 2015?
The Toronto Star - Why gold and oil have parted ways
CoinNews - Gold and Other Precious Metals Decline in Thin Trading
GOLD NANO-PARTICLES : Economic Times - India-Born Professor Kattesh Katti’s Research shows Green Tea, Gold can Treat Prostate Cancer
GOLD NANO-PARTICLES : Sakal Times - ‘Gold Nano-Particles Future of Cancer Cure’
Dollar Collapse - 2014 In Review: How Could Gold Bugs Have Been So Wrong?
The Sovereign Investor - Keep Your Eye on These Three Forces in 2015
Bullion Vault - Russia's Big Lesson for Gold Investors
Reuters - China's net gold imports from Hong Kong hit 9-month high in Nov
Kitco - Global Mints See Strong Silver Sales For A Second Year
Economic Policy Journal - Nine Schools of Economic Thought
Free Shipping on Orders $199+ | 5.0 star Customer Reviews
12/28/14 - Bullion News
MontgomeryAdvertiser - Gold not Hedge against Inflation, but the Future
CEO.CA - 4 Reasons $1200 is an Important Level for Gold
The Telegraph - Gold retains position as safe haven for 2015
Mad Coin Dealer - eBay Completed Coin Sales - A Natural Oscillation in the Coin Market
VIDEO : Gordon T Long - MACRO ANALYTICS - Buying Monetary Insurance - w/Ronald Peter Stoeferle
Zero Hedge - "Will We Never Learn?" - Meet Subprime Auto 'Title Loans': 2014's Home ATM
Wealth Daily - Invesing in LIBOR Manipulation
Gold-Eagle - Will The US Dollar Remain The Reserve Currency Of The World?
Sputnik - Weakest Eurozone Members Need Reforms, Not Money: German Finance Officials
LewRockwell - China to Start Payments With Russia in National Currencies on December 29
BullionStar - SGE Withdrawals A Whopping 61t In Week 51, YTD 2016t
NANO-PARTICLES : MeD India - QUIZ on Nanotechnology and Nano-Particles
Business Insider - Here's What The New York Stock Exchange Looked Like In 1893
12/26/14 - Bullion News
GoldSilverWorlds - Ronald Stoeferle: Gold Outlook For 2015
CoinNews - 2015 America the Beautiful Quarters – Release Dates and Images
Shanghai Metals Market - Collections of Major Banks Views on 2015 Gold Price
Pragmatic Capitalist - How to Spot a Bad Forecaster
The Gold Report - Best of the Best: The Most Popular Thoughts from 2014
TECHNICAL ANALYSIS : Kimble Charting - Gold Bugs Index Could be Creating a Double Bottom
TECHNICAL ANALYSIS : McClellan Financial - Oil Follows Gold’s Crash Pattern
TECHNICAL ANALYSIS : Kitco - Could Platinum And Palladium Outperform Gold In 2015?
CHARTS : GoldtotheMoon - Long term (47year) Silver Charts with Technical Indicators
FoxBusiness - The Fed's Santa Claus Rally - One has to wonder what’s going to happen when U.S. markets grow up and realize there is no Santa Claus.
Zero Hedge - Game Over Japan: Real Wages Crash Most In 21st Century, Savings Rate Turns Negative
Shanghai Daily - Abe readies stimulus package to lift Japan out of recession
CoinWeek - The Morgan Dollar vs. the American Silver Eagle, Part 2
VIDEO : Future Money Trends - 3 Gold Conspiracies
12/25/14 - Bullion News
MERRY CHRISTMAS!
12/24/14 - Bullion News
TECHNICAL ANALYSIS : Market Watch - ’Tis the season for a stock market rally, but not for long
The Bullion Desk - Gold price flat as volumes decline ahead of holiday
CoinNews - 2014 American Eagle Silver Bullion Coin Record Ends at 44 Million
CHART : The Market Trend Forecast - Gold Still in a Bear Market?
GOLD NANO-PARTICLES : medGadget- Gold Nanorods Halt Growth of Cervical Cancer Cells
AUDIO : Jay Taylor - Frank Holmes Investing for Profits Without Drama
VIDEO : Peter Schiff - What is Really Stopping the Fed From Raising Rates?
FuturesMag - 68% of Traders Don't Expect a Rate Hike until - September 2015
Fed officials last week dropped a pledge to keep borrowing costs near zero percent for a “considerable time,” replacing it with a promise to be “patient,” according to a statement
GOLD NANO-PARTICLES : decodeScience - Gold Nanoparticles for Medical and Electronics Research
VIDEO : Bloomberg - Gold Is a Golden Investment for 2015: Aslam
CHART ANALYSIS : Advisor Perspectives - Gasoline Volume Sales, Demographics and our Changing Culture
AUDIO : McAlvany Weekly Commentary - Our Listeners Questions Answered Part II
Mauldin Economics - The US Dollar and the Cone of Uncertainty
Zero Hedge - Uncle Sam Does The Impossible: Loses $105 Million/Year Coining Money!
WoodTV - Bars dropped in red kettle not gold
Bullion Baron - BitGold: The Digitalization of Metal
12/23/14 - Bullion News
CMI Gold & Silver - The Goal of 2% Inflation, Rethought — New York Times
VIDEO : Bloomberg - The Fed Will Struggle to Reach Rate Target in 2015
SilverSeek - Why gold and silver will continue to be the perfect hedge in 2015
AUDIO : FSN - David Morgan – Many Opportunities For 2015
TECHNICAL ANALYSIS : Kimble Charting - Outflows biggest in 3-years, will stocks rally due to this panic?
The Deviant Investor - Crude Oil, US National Debt, and Silver
BullionStar - More Confirmation Germany Continues To Repatriate Gold
CNBC - Could Russia back its currency with gold?
Chronicle - Platinum Production Set to Decline by 1.2%
VIDEO : BNN - Deflation situation: Why cheaper oil is depressing gold prices
12/22/14 - Bullion News
CoinNews - Gold Prices End Below $1,180; US Mint Coin Sales Rise
GoldReporter.de - Great Britain tightens control of the gold and silver prices - Google Translation Link
CHARTS : Advisor Perspectives - NYSE Margin Debt Drifts Higher in November
The Bullion Desk - Gold, silver prices to rebound next year as dollar wanes - ANZ Research
SRSrocco Report - India Imports Record Amount Of Silver In November
Bloomberg - Ruble Swap Shows China Challenging IMF as Emergency Lender
AUDIO : Sprott Money - Ask The Expert - Marc Faber
The Telegraph - China quietly joins Asia's currency wars to avert deflation
Economic Policy Journal - The Magic and Miracle of the Marketplace: Christmas 1964 vs. 2014
American Thinker - The Answers to Why the Russians Buying Everything Off the Shelves...?
Laissez Faire - Jim Rickards: “Like a Virus With No Cure”
Historinhas - Inflation Everywhere Will Always Get Worse (Economists Erroneously Believe)
The Corner - What if QE operates on the supply side and keeps prices low?
Sunshine Profits - Gold prices after the end of QE
Web of Debt - Russian Roulette: Taxpayers Could Be on the Hook for Trillions in Oil Derivatives
12/21/14 - Bullion News
DailyForex - Why Gold is not Rallying
VIDEO : Contra Corner - David Stockman Interview: The Case For Super Glass-Steagall
JCK - New Jersey Finds Nearly 10,000 Violations in Latest Cash-for-Gold Sweep
McClellan Financial - Yield Curve’s Effect Thwarted By Fed’s Actions
BullionStar - Will Chinese Gold Demand End 2014 With A Boom?
Kitco - Just Like The Fed, Rickards Recommends Patience
MINING - Canada approves world's largest copper-gold project
Gryfen - The Fed’s War on Honest Money
12/19/14 - Bullion News
Bullion Vault - Gold 2015: A Quick Heads-Up
Market Oracle - The Commodities Market Is Not Dying, It’s Just Hibernating
Mail & Guardian - Commodity markets limp into 2015
The Bullion Desk - Two year highs in the dollar caps gold below $1,200/oz
VIDEO : BullionStar - Koos Jansen & Tuur Demeester About The Gold Repatriation Movement
Wealth Daily - Investing in U.S. Government Debt - Why Gold is the ONLY Safe Haven
Zero Hedge - Just What Is China Buying?
BullionStar - India Silver Import 6789t YTD
Gold-Eagle - Russia Busts "Gold-Selling" Rumors, Reports It Bought Another 600,000 Ounces Taking Gold Holdings To New Record High
REWIND : VIDEO : Kitco - Kevin O'Leary's 'Cold, Hard, Truth' on Gold Investing
Investing and Trading - Basic Trading Concepts Defined

SD Bullion - 4.8 star Customer Reviews
12/18/14 - Bullion News
King One Eye - Fascinating Chart Action on Dollar and Gold
GoldStockBull - U.S. Gold Production Declined 7% During First 9 Months of 2014
CEO.CA - Peak Gold...
TECHNICAL ANALYSIS : SafeHaven - Gold Building Foundations For Rally
GOLD NANO-PARTICLES : PHYS.org - Gold Nano-Rods Target Cancer Cells
VIDEO : Trim Trabs - Charles Biderman on CNBC: Global Zero Interest Rates Creating Global Recession
24hGOLD - The Fed Is Sitting On a $191 TRILLION Time Bomb
Advancing Time - Bond Market Bubble Has Ugly Ramifications
Gold Chat - Money, Trust and Gold
AUDIO : Sovereign Man - How to evaluate if your bank is safe, and what to do if it’s not
The Bullion Desk - Swiss gold exports to China fall to 34 tns in November
Zero Hedge - Swiss Central Bank Plunges Into NIRP, Sends Deposit Rates Negative, Scrambles Against Safe-Haven Capital Flight
Bullion Barron - Reserve Bank of Australia Audits Our Gold Reserves
VIDEO : Gordon T Long - Interview with Gordon T Long
12/17/14 - Bullion News
The Bullion Desk - Federal Reserve to be ‘patient’ with rate hike
INFO~GRAPHIC : GoldSilverWorlds - The Many Phases Of Silver
Market Watch - Opinion: Europeans want their gold back, and why that’s bad for the euro
BullionStar - Guest Post: Is Russia Selling Oil For Gold?
Money Morning - Gold Price Forecast 2015 Driven by These Two Key Factors
StreetTalkLive - Surprise...Everyone Was Wrong About The End Of QE
AUDIO : McAlvany Weekly Commentary - This Week : Pre 1914, gold standard restricted Inflation, Almost all hyperinflation occurred after 1914, Politicians have an Inflationary bias
CHARTS : Advisor Perspectives - What Inflation Means to You: Inside the Consumer Price Index
India West - Gold Surge from Switzerland Raises Black Money Fears
GOLD NANO-PARTICLES : Israel21c - Gargle with Gold to Find Oral Cancer - A revolutionary diagnostic system under development in Israel uses a mouthwash embedded with gold nano-particles to detect cancer cells.
CoinWeek - US Mint Releases Second Report on Alternative Ways to Manufacture Coins
The Local - Spain's gold dust bread 'world's most pricey'
12/16/14 - Bullion News
VIDEO : Bloomberg - James Rickards : Fed Will Implement QE4 in Early 2016
CoinNews - Security Enhancement for 2015 Gold Maple Leaf Bullion Coins
GoldChat - How I Learned to Stop Worrying and Love the Gold
biiwii - Is the End of QE Bearish for Gold?
GoldReporter.de - De-hedging: gold producers expect gold prices rise - Google Translation Link
Reuters - India to weigh gold policy impact after jump in November imports
Bloomberg - China’s Treasury Holdings Fall to Lowest Since February 2013
VIDEO : SGT Report - The Derivatives Nightmare & Precious Metals Move To Strong Retail Hands -- Rick Rule
TECHNICAL ANALYSIS : Market Anthropology - the Crude Reality in Oil
Dollar Collapse - This Is What Gold Does In a Currency Crisis
GOLD NANO-PARTICLES : PHYS.org - MU scientist and inventor advances the study of nanomedicine
CoinWeek - The Nativity on Coins
kirotv - Pike’s Peak Gold Rush and the Birth of the Denver Mint
12/15/14 - Bullion News
Project Syndicate - Why Are Commodity Prices Falling?
Casey Research - Russian Bear—or Gold Bull?
The Bullion Desk - Gold price suffers, investors increasingly expect US rate rise
GoldReporter.de - Gold market: "Commercials" with the greatest short position since the end of August - Google Translation Link
PDF : Gold Standard Institute - Journal Issue #48
AUDIO : FSN - John Rubino – Dodd-Frank Is Dead, Long Live Dodd-Frank
Sovereign Man - Yes, it’s possible for a gold-backed renminbi to dethrone the dollar
AutoCar Professional - BASF develops new 4-way conversion catalyst system for petrol engines
GOLD NANO-PARTICLES : ScienceCodeX - Promising new method for rapidly screening cancer drugs
GoldSilverWorlds - 17 Reasons Why I Trust Silver
MetalMiner - Russia, China, India Central Banks Buying More Gold as Oil Prices Drop
Bullion Vault - Johnson Matthey Exits Gold & Silver Refining After 160 Years
12/14/14 - Bullion News
The Telegraph - HSBC fears horrible end to Japan's QE blitz as Abe wins landslide
Gold-Eagle - One Foot On A Banana Peel...The Other In A Grave
Dollar Collapse - Well Played Wall Street...
Zero Hedge - Sales Of Silver American Eagles Rise To Record High For Second Consecutive Year
Mish's Blog - Bill Gross: "New Natural Interest Rates is Zero or Negative"
CHART : Kimble Charting - Put to Call ratio suggesting S&P could turn soft!
BullionStar - Why Austria Is Likely To Repatriate Its Gold From London
The Daily Bell - Jim Rogers: Choose Farming for Your Family and Finances
VIDEO : Market Watch - Ray Dalio’s no-brainer: Stock may dip when monetary impact weakens
Bio & Tech Insights - Americans’ wealth poorer than before the recession
CMI Gold & Silver - Remember Savings Bonds?
GOLD NANO-PARTICLES : ScienceDaily - The gold standard: Affordable catalyst for energy and environmental applications
12/12/14 - Bullion News
CHARTS : McClellan Financial - What Hindenburg Omens and an Oil Crash Mean
CHARTS : Advisor Perspectives - The Fed Balance Sheet: What Is Uncle Sam's Largest Asset?
VIDEO : CNBC - Santelli Exchange: Money supply not growing fast enough?
Gold Chat - Why WGC's India gold policy won't make much impact on import "problem"
GOLD NANO-PARTICLES : PHYS.org - Arming Nano-Particles for Cancer Diagnosis and Treatment
About.Ag - Information on 28% Capital Gains Tax Rate for Silver and Gold
CEO.CA - Stealth Rally in Gold
BullionStar - Gold Chat With Bron Suchecki On The Chinese Gold Lease Market
Zero Hedge - Austria Considers Repatriating Its Gold
Profit Confidential - Top 10 Countries with the Highest Gold Reserves
Northern Miner - Citigroup favours palladium
VIDEO : Forbes - A Tipping Point For Cancer Treatment
12/11/14 - Bullion News
The Heritage Foundation - Jim Grant, Recession and Recovery in 1921
The Gold Report - Elliott Wave Charts Point to Shocking Countertrend for Gold: Steven Hochberg
The Bullion Desk - Silver to see 11 million ounce deficit in 2015 – HSBC
MINING - Here is what India Needs to Effectively Manage Gold Demand
Plata - Artificially Lowered Interest Rates Cause Stagnating Wages and Unemployment
AUDIO : Jay Taylor - A Look at Gold Market Fundamentals
TF Metals Report - Comex Institutes Trading Collars For Precious Metals
Profit Confidential - Gold Prices Manipulated for Past Two Years?
Gold Chat - Chinese regulations: rule of law or rule by law?
BullionStar - Gold the $ and the FED
Bloomberg - Fed Bubble Bursts in $550 Billion of Energy Debt: Credit Markets
Gold-Eagle - The Mother Of All Bank Runs!
NANO PARTICLES : World Health - Targeted Melanoma Therapy via Nano-Particle Innovation
12/10/14 - Bullion News
Bloomberg - U.S. Silver-Coin Sales Climb to Annual Record as Prices Rebound
VIDEO : CNBC - Santelli Exchange : Liquidity 'transmission'
GoldReporter.de - Gold reserves, these countries in accordance with the Swiss gold Initiative - Google Translation Link
AUDIO : McAlvany Weekly Commentary - Our Listeners Questions Answered...How is gold valued/used in a currency crises?...Is the world economy in a “Coffin Corner”?...Deflation, inflation or both and?
abcNEWS - Mexico Vows to Sell Dollars to Halt Peso's Slide
BullionStar - A Close Look At The Chinese Gold Lease Market
GoldChat - PBOC paper recommends leasing its reserves to manipulate gold price
CEO.CA - Gundlach Says 10-year Yield Could Fall to 1%, Bullish Gold
Market Watch - The end of silver’s bear market and one last dip before Santa
CoinWeek - Bullion Coins: NGC Partners with GovMint, SilverTowne, Heritage and Minshull Trading on 2015 Silver Eagles
DNAinfo - Landlord's Deathbed Confession Sends Siblings on Hunt for Hidden Silver
12/09/14 - Bullion News
Contra Corner - Towering Federal Debt Hidden In A Monetary ‘Roach Motel’ Where The Bonds Come In But Never Come Out
Numismatic News - Take bullion delivery fast
The Wall Street Journal - 5 Reasons China’s Stocks Are Tanking
Sunshine Profits - Is the halt of QE3 the end of the loose monetary policy?
TECHNICAL ANALYSIS : Market Anthropology - Following a "Deflated" 2008 Redux in Commodities
SRSrocco Report - Silver Eagle Sales Surpass 2013 Record At Nearly 43 Million
The Bullion Desk - India should establish its own gold exchange – World Gold Council
South China Morning Post - 68 Hong Kong gold traders to operate in Qianhai from March
The Deviant Investor - Debt, Default, and Taxes (DDT) Are Poison
Mish's Blog - Physical Gold and Silver vs. Paper Gold and Silver: How Much Markup Are You Willing to Pay?
Inside Futures - Have Gold Prices Bottomed
Forbes - NorFed : Protecting Us From A 'Terrorist' Who Made Pure Silver Coins: The Bernard von NotHaus Case
Economic Policy Journal - The Shale Oil Crash Could Be Worse Than the Housing Bubble Crash
GOLD NANO-PARTICLES : MDPI - Au-Nanomaterials as a Superior Choice for Near-Infrared Photothermal Therapy
The Blaze - Someone Is Leaving Gold Coins Wrapped in $1 Bills Inside Salvation Army Kettles, With This Message
12/08/14 - Bullion News
Epic Times - The Case for Monetary Freedom and Free Banking
Bloomberg - Gold Bulls Return as Wagers on Stimulus Accumulate: Commodities
GoldReporter.de - After silver price increase: Margins in futures trading can be increased - Google Translation Link
Wolf Street - Treasury Warns Congress (and Investors): This Financial Creature Could Sink the System
Sovereign Man - We seem to have miscalculated
My Budget 360 - No inflation they say: Increases from 2007 include rent going up by 27 percent, food increasing 12 percent, health insurance 42 percent.
Casey Research - 7 Questions Gold Bears Must Answer
BullionStar - China Net Gold Import 1,212t Jan – Nov
Mises Institute - What a Reserve Currency Should Look Like
VIDEO : CNBC - BIS report shows dangers of strong dollar
TECHNICAL ANALYSIS : Kimble Charting - S&P 500 – Time to protect your holdings here, due to this?
INFO~GRAPHIC : Visual Capitalist - Is Big Tech In Another Bubble?
12/07/14 - Bullion News
The New York Times - The Golden Age - gold has experienced a renaissance of sorts, quietly re-emerging as the centerpiece of a handful of initiatives in Europe, Asia and the Middle East
The Telegraph - Dollar surge endangers global debt edifice, warns BIS - BIS warns that the world is in many ways even more stretched today than it was in 2008. Debt levels in rich countries have jumped by 30 percentage points since the Lehman crisis to 275pc of GDP, and by the same amount to 175pc in emerging markets. The world has exhausted almost all of its buffer
PDF : Wizzen Trading - Technical Analysis : Downtrend Resuming
VIDEO : Zero Hedge - Jim Grant Sums It All Up In 2 Stunning Paragraphs
Rick Ackerman - Market Orgy Ignores Middle Class Death Spiral
TECHNICAL ANALYSIS : CEO.CA - One More Flush for Gold Before Year End
AUDIO : Peak Prosperity - Mike Maloney: The Coming Wealth Transfer
The Standard (Hong Kong) - Precious dreams - Chinese Gold & Silver Exchange Society president hopes to see the bullion markets in Hong Kong and China get connected to their overseas counterparts by the first quarter of next year
BullionStar - Belgium Investigating To Repatriate All Gold Reserves
Bloomberg - Turkey Imported Most Gold in Six Years as Slump Spurred Buying
Business Insider - Jim Rogers Reveals The Key To Being A Successful Investor
12/05/14 - Bullion News
CoinNews - US Mint Sales Dates for 2015-Dated Bullion Coins
Wealth Daily - Gold Buys Protection Against Central Banks
Mises Institute - Keynesian Economics and the Dead End Economy
Contra Corner - Only Yesterday—-How The Federal Debt Went From $1 Trillion To $18 Trillion in 33 Years
Money Morning - Gold in 2015: What the Gold Repatriation Movement Tells Us
BullionStar - World Gold Council Rectifies 2013 Chinese Gold Demand
AUDIO : McAlvany Weekly Commentary - This Weeks Show : Saudi’s throw down to bust U.S. energy suppliers, The Dutch move 122 tons of gold out of U.S., Sovereign banks now grabbing their gold back
TECHNICAL ANALYSIS : Kimble Charting - Japan… time to party likes its 2007 again!
MINING - Is Gold and Silver run out of big sellers?
The Daily Bell - EU Deflation: Real Problem or Eurocrat Exaggeration?
12/04/14 - Bullion News
CNBC - Bill Gross: You can't cure debt with more debt
Gold Chat - Blatant and massive market intervention
The Globe and Mail - How Canadian gold miners' cash costs now stack up - Dundee Capital Markets Research Report
The South China Morning Post - China's gold output growth to slow in 2015 amid price falls
The Bullion Desk - LBMA says GOFO to be scrapped on January 30
iol - Platinum shortfall expected
The Sovereign Investor - Dodge the Debt: Finding Income in America Today
The Wall Street Journal - 5 Things to Know as the ECB Kicks the QE Can Down the Road
Contra Corner - B-Dud Explains The Fed’s Economic Coup—-Or Why Every Asset Price Is Manipulated
CoinWeek - NorFed : Bernard von NotHaus Sentenced to Probation for Liberty Dollar Conviction
GoldReporter.de - Indians have 22,000 tons of gold
TECHNICAL ANALYSIS : Market Anthropology - The Delta blues - Side I
12/03/14 - Bullion News
Money Morning - How the Fed Sees Itself Is Not Pretty
GoldtotheMoon - The biggest bubble ever, the money bubble [Part 1]
CoinWeek - The Morgan Dollar vs. the American Silver Eagle, Part 1
FOFOA - Global Stagnation
Profit Confidential - Survey Shows Real Inflation Running at About 5%
VIDEO : CNBC - Santelli Exchange: Disguising asset bubbles with Peter Schiff
Gold Chat - Gold lease rate curve inversion
CHART : Kimble Charting - Valuations are only 91% above 100-year averages…Cheers!!!
The Telegraph - Stock markets look much as they did in 2000 and 2007
Forbes - Five Biggest U.S. Banks Control Nearly Half Industry's $15 Trillion In Assets
NANO-PARTICLES : PHYS.org - Researchers turn gold nanoclusters into 12-sided dodecahedron crystals
GATA - Norfed : Judge in Liberty Dollar case orders some metal forfeited and some returned
Affiliate Ad
12/02/14 - Bullion News
Sunshine Profits - What Does the End of QE3 Really Mean?
Sovereign Man - Five complete lies about America’s new $18 trillion debt level
TECHNICAL ANALYSIS : MINING - Dollar destruction of commodity prices could be ending
VIDEO : Bloomberg - Oil Story Translates to Gold in Corresponding Moves
Mises Institute - Tiny Houses May Signal a Big Change
Liberty Blitz Krieg - Housing Fraud is Back – Real Estate Industry Intentionally Inflating Home Appraisals
Acting Man - Gold Forward Rates Plunge
TECHNICAL ANALYSIS : SOLARCYCLES - Happenings
TECHNICAL ANALYSIS : Kimble Charting - VIX (Fear Index) – Lowest yearly average since 2006!
SRSrocco Report - MASSIVE INDIAN SILVER IMPORTS: Setting Up For Another Big Record Year
The Deviant Investor - Silver Open Interest Anomaly
Perth Mint Blog - Prices Rally In Aftermath Of Swiss 'No' Vote On Gold
12/01/14 - Bullion News
The Sovereign Investor - The Coming Currency Conundrum
Bloomberg - Gold Gains Most in 14 Months as Oil Rally Revives Demand - Includes Video with Willem Buiter, chief economist at Citigroup, who wrote "Gold Is A 6,000 Year Old Bubble," (last week)
Zero Hedge - It Wasn't The Swiss: Continuing Plunge In GOFO Means No Easing Of Worst Gold Shortage In Over A Decade
Mises Institute - Federal Reserve Attacks the Gold Standard
Perth Mint Blog - The Perth Mint's November Sales : Silver Sales Increase, Gold Doesn't
CHART : GoldtotheMoon - Gold to Silver Ratio hit 80 and bounced down, but may try to touch 80 again.
Silver Coins Today - 2014 American Silver Eagle Coin Sales on Record Pace, Strong in November
Advisor Perspectives - The Latest on Real Disposable Income Per Capita
VIDEO : The Royal Mint - Interview with Wuon-Gean Ho, the designer of the Royal Mint's Lunar Bullion coin, at her studio in London
Sovereign Man - This was the most valuable company in history (Worth 10 times as much as Apple)
Plata - A Silver Coin that is Money To Calm the National Tantrum in Mexico
11/30/14 - Bullion News
Bloomberg - Surprise End to India Gold Controls Boosts Wedding Demand
SNBCHF - Swiss Gold Referendum: Results and Analysis
TECHNICAL ANALYSIS : Golden-Eagle - Thin Thanksgiving Blunder
Market Update - Gold price to record in Russian rubles - Google Translation Link
TECHNICAL ANALYSIS : TheGoldandOilGuy - Investors That Do Not Understand The Power Of Seven Will Lose Money in 2015
Acting Man - Can QE Prop Up Asset Prices Forever?
The Corner - Keynesians Trojan horse a sign of changing times at OECD
Economic Policy Journal - The Remarkable Increase in Sales of US Mint Silver Eagle Sales
NANO-PARTICLES : News Medical - Next-generation biomarker detects tumour cells, delivers anti-cancer drugs
Business Insider - Lithuania Just Made The Largest Coin Pyramid Ever
11/28/14 - Bullion News
Wealth Daily - Mining Stocks vs. Physical Gold
McClellan Financial - GOFO Squeeze
VIDEO : Kitco - How Oil's Slump Is Affecting Gold - Wyckoff
The Bullion Desk - India confirms 80:20 rule on gold imports scrapped immediately
The Bullion Desk - India’s decision to revoke 80:20 gold import rule ‘surprising’ – UBS
Zero Hedge - Gold Shortage, Worst In 21st Century, Sends 1Y GOFO To Lowest Ever... And India Just Made It Worse
VIDEO : CNBC - Fed now expected to stay lower for a lot longer
SNBCHF - Former UBS banker and economist George Dorgan on finews: The four fronts at the Gold Initiative - Google Translation Link
The Telegraph - Swiss vote provokes '6,000-year gold bubble' attack
SRSrocco Report - SILVER EAGLE & MAPLE LEAF RECORD SALES: Five Times Larger Than 2007
Bloomberg - Platinum, Palladium Price Fixings Make Way for Electronic System
Coin Update - Angel’s 30th Anniversary Celebrated with New Silver Bullion Coin
INFO~GRAPHIC : Visual Capitalist - The Returns of Every Asset Class So Far in 2014
Contra Corner - How Bloomberg’s Algo-Writers Serve The Cult Of Keynesian Central Banking
11/26/14 - Bullion News
Happy Thanksgiving!
TECHNICAL ANALYSIS : SafeHaven - Gold and Silver Update
Forbes - Silver Coins, Small Gold Coins Are Popular Items For Holiday Gift-Gifting This Year
Financial Post - Goldman, HSBC sued over allegations of platinum, palladium price fixing that date back to 2007
AUDIO : McAlvany Weekly Commentary - Charles Nenner: “Gold Close to Major Bottom”
SNBCHF - Why was the gold price so low in 1999/2000?
VIDEO : Gordon T Long - MACRO ANALYTICS - What Are The Rich Doing With Their Money w/John Rubino
4-traders - Researchers Submit Patent Application, "Nanoparticle-Assisted Ultrasound for Cancer Therapy", for Approval
BullionStar - Analysis Dutch Gold Repatriation: Why, How And When
VIDEO : CNBC - Futures Now: Swiss gold referendum
11/26: TECHNICAL ANALYSIS : The Deviant Investor - Silver: What COT Analysis Tells Us
Library of Liberty & Economics - Why America can't have small government (and China can)
Keith Weiner Economics - Why The Founders Didn’t Give Us a Democracy
11/25/14 - Bullion News
CHARTS : Advisor Perspectives - NYSE Margin Debt Declines in October
TECHNICAL ANALYSIS : Sunshine Profits - Gold & Silver Trading Alert: Invalidation of Platinum’s Breakout
CoinWeek - How to Minimize the Risk of Having Precious Metals Seized When Going Through Airport Security (TSA)
CoinNews - Precious Metals Rise as Dollar Dips, US Coin Sales Gain
VIDEO : Bloomberg - Federal Reserve Strategy Too Focused on Short-Term Data
GoldStockBull - France Joins Growing List of Countries Attempting to Repatriate Their Gold
Bloomberg - China’s Gold Imports Rise for a Third Month on Jewelry Sales
MineWeb - China 2014 gold demand heading for 2,100 tonnes
Acting Man - The Swiss Referendum on Gold: What is Missing from the Debate
The Bullion Desk - Swiss ‘no’ vote could still have implications for gold market – HSBC
GoldReporter.de - Max Otte: The United States makes Germany with gold tractable - Google Translation Link
Laissez Faire - Money: The Green Shapeshifter That Rules
Investing and Trading - U.S. prosecutors to interview London FX traders
11/24/14 - Bullion News
Investment U - The Case for Gold... Even As It Falls
TECHNICAL ANALYSIS : MINING - Gold-silver ratio nears bullish breakout
11/24: Sunshine Profits - What causes the moves in the U.S. dollar?
Zero Hedge - Student Debt By Major: What Not To Study To Avoid A Lifetime Of Debt Slavery
my budget 360 - Since 1985 college tuition costs have soared by 538 percent. No surprise that total student debt is now over $1.22 trillion.
GOLD NANO-PARTICLES : Chemical & Engineering News -Google’s Nanoparticle Diagnostic Vision
CHART : Kimble Charting - No calendar year (since 1950) has gone further into the year without a 4-day losing streak than 2014
Shanghai Metals Market - India's central bank cautious on response to gold import surge
BullionStar - Total Chinese Gold Reserves Approaching 16,000t
The Bullion Desk - Platinum seen in record 1.33 mln oz deficit in ’14 – Johnson Matthey
Bullion Vault - Jim Rogers' No.1 Investing Tip
CMI Gold & Silver - How the Government is Creating a Black Market in Financial Services
ValueWalk - Solar Energy Powers Silver Demand To Record High
11/23/14 - Bullion News
Sober Look - The Fed Concerned About "Importing" Disinflation
Ahead of the Herd - Golden Gains come After the Pain
PDF : Wizzen Trading - Technical Analysis : Shake And Bake
The Burning Platform - NO ONE TOLD YOU WHEN TO RUN, YOU MISSED THE STARTING GUN
TECHNICAL ANALYSIS : Inside Futures - Volatile Trading Week In Gold
TECHNICAL ANALYSIS : SOLARCYCLES - Friday Blow-Off Top?
AUDIO : Gordon T Long - Financial Repression For Dummies
South China Morning Post - Gold volatility spikes in Asia during China’s lunch break
Zero Hedge - Asian Gold Traders Suspicious Of Recent "Turbo Steroid Moves"
The Telegraph - Japanese QE tsunami risks global meltdown
The Bullion Desk - OPINION – What Does the End of QE Mean for the Precious Metals?
Gold-Eagle - SNB’s Jordan Warns of Danger of Voters Passing Gold Initiative
AUDIO : Peak Prosperity - Treebeard: Becoming The Change We Wish To See - Exploring the development of inner resilience
Bullion Vault - Mad Dog Gaddafi, the Dutch Central Bank & Your Own Gold Reserves
11/21/14 - Bullion News
Economic Policy Journal - The Cost of Your Thanksgiving Dinner Climbs
BDlive - Many gold miners nearing breaking point
AUDIO : Ellis Martin - Ellis Martin Report with David Morgan--Bottom's Up?
BullionStar - The Netherlands Has Repatriated 122.5t Gold From US
Money Morning - Proof the Federal Reserve Has No Idea What It's Doing
Acting Man - The Consequences of Imposing Negative Interest Rates
TECHNICAL ANALYSIS : Kimble Charting - Hi Yo Silver – “Bullish reversal wick” could be forming at dual support!
The Daily Bell - Squeaking of the Swiss National Bank: 'No Gold for Us!'
The Sovereign Investor - Swiss Gold Vote Could Mark the End of Fiat Money
RT - Iraqi dealers confirm ISIS hoarding gold, precious metals to issue currency
Zero Hedge - "Gold Is Money And Nothing Else" - JP Morgan's Full December 1912 Testimony To Congress
CNBC - Fed to issue rules notice on banks and commodities in early 2015

11/20/14 - Bullion News
TECHNICAL ANALYSIS : SafeHaven - Gold: Now What?
AUDIO : Day Trader Show - Interview with Silver Guru - David Morgan - Great Interview
Reuters - Gold rises as price drop tempts physical buyers
TECHNICAL ANALYSIS : Market Update - Asia does not want to finance American debt? - Google Translation Link
TECHNICAL ANALYSIS : SOLARCYCLES - Bear Market Bottom
INFO~GRAPHIC : Visual Capitalist - Everything You Need to Know About the Swiss Gold Referendum
ValueWalk - Gold Vote Poll Shows Shift Towards ‘No’
BullionStar - Switzerland Net Exports 100t Of Gold In October
E-piphany - Summary of My Post-CPI Tweets
The Bullion Desk - South African Mine closures, output cuts likely if gold price stagnates
MineWeb - Senate panel to grill Wall Street bankers on commodities activity
SLIDE-SHOW : China Daily - Gold retailers get creative to attract buyers
11/19/14 - Bullion News
TruthInGold - United States Mint Bullion Sales of its American Silver Eagles Topped 1 Million in Their Limited Return on Monday, Nov. 18, following a week and a half absence.
11/19: The Bullion Desk - Swiss gold ‘yes’ vote would shake market – HSBC
AUDIO : McAlvany Weekly Commentary - The Last Great Gold Hoard
Business Insider - Long-Term Interest Rates Have Been This Low Only Twice In The Past 214 Years
Reuters - Silver demand to fall 7 percent in 2014 - Thomson Reuters GFMS
Bullion Vault - India Gold Imports Double on Diwali to "2013 Crash" High
TECHNICAL ANALYSIS : TalkMarkets - Gold Traders/Investors…Keep A Close Eye On This Action
GoldSeek - The Secret Advantage Gold/Silver Owners Have Over Everyone
BullionStar - Why Did European Central Banks Sell Gold?
Economic Policy Journal - As If the Federal Reserve isn't Bad Enough in It's Current State...
Business Insider - Japan's Biggest Problem Is Basically Unfixable
Sprott Money Blog - Russia Continues to Accumulate Massive Amounts of Gold
Moneyweb - Mixed Views on the New Platinum Council.
Great Falls Tribune - Trail of Coins, Footprints Leads to Arrest
11/18/14 - Bullion News
11/18: BullionStar - The World We Live In
11/18: VIDEO : CNBC - VIDEO: Santelli Exchange Q: Why Hasn't the Fed Raised Rates Yet? A: Because they Can't
11/18: The Telegraph - Belgium new sick man of Europe on debt-trap fears
11/18: The Corner - Japan recession gives ECB food for thought
11/18: Zero Hedge - Ukraine Admits Its Gold Is Gone: "There Is Almost No Gold Left In The Central Bank Vault"
11/18: The Event Chronicle - Russia is stockpiling gold bullion
11/18: Bloomberg - Gold Advances to Two-Week High as Russia Boosts Reserves
11/18: GOLD NANO-PARTICLES : UPI - Nanoparticles to detect cancer cells in a blood sample - This will make it easier to know if all cancer tissue has been removed after a surgery, instead of the wait time usually associated with taking scans months later.
11/18: TECHNICAL ANALYSIS : Kimble Charting - King Dollar & Euro… A “Trend Change” has to happen!
11/18: TECHNICAL ANALYSIS : The Deviant Investor - Gold, Silver, Crude and S&P Ending Wedge Patterns
11/18: TECHNICAL ANALYSIS : Market Anthropology - The Commodity Supercycle Ain't Over - Yet
11/18: VIDEO : Kitco - Kitco Interviews NYT Besteller Robert Ringer
11/17/14 - Bullion News
Silver Phoenix 500 - Imprudent Reactions And False Hopes
CoinNews - Gold Dips, Bullion Silver Eagles Top 40M in Return
JM Bullion - JM Bullion announces launch of new 2015 1 1/4 oz Canadian Silver Bison Coin - scroll down page to see Info~Graphic
BullionStar - India Precious Metals Import Explodes In October
Reuters - The Reserve Bank of India - India cbank deputy says talking to govt on increasing gold import curbs
TECHNICAL ANALYSIS : Sunshine Profits - Gold & Silver Trading Alert: How High Will Gold Go?
BullionStar - SGE Withdrawals Strong, China Increases Solar Power
Bullion Vault - Central Eurozone's QE "Could Include Gold Bullion" to Boost Inflation, Swiss "Must Be Able to Sell" as Japan Hits Recession Despite QE
AUDIO : GoldSeek Radio - Chris Waltzek Interviews Silver Guru - David Morgan
Ludwig von Mises Institute - Central Banks are Not Innocent Bystanders
Central Bank News - Central Bank News Link List - Nov 17, 2014 - Draghi says ECB measures may entail buying government bonds
VIDEO : Bloomberg - Is Federal Reserve Policy Leading a Boom or Bust Market?
The Daily Wealth - "$1.6 Trillion in Defaults Coming," Legend Says
11/16/14 - Bullion News
PDF : The Gold Standard Institute - Journal Issue #47
Gold Chat - 135 years of US Fed Earmarked Gold
TECHNICAL ANALYSIS : CEO.CA - A Constructive Week for Gold – What’s Next?
Reuters - SNB Head says No Sovereign Fund for Gold if Referendum Passes - Reuters advocating the Mainstream Media Bias Against Gold with false News about Polls
Zero Hedge - Deutsche Bank Says "Yes" Vote Has "Narrow But Clear Lead"
PDF : Wizzen Trading - Technical Analysis : Another Magic Trick
Howe Street - This Week in Money : John Rubino - Solar Energy and Silver | Mike “Mish” Shedlock – China’s billionaires want to flee their homeland
TECHNICAL ANALYSIS : SOLARCYCLES - Weekend Update
BullionStar - Who’s Feeding China’s Gold Hunger?
Mises Economics Blog - True Money Supply Decelerates
Profit Confidential - What Canada/China’s Yuan Trade Deal Means for U.S. Dollar
AUDIO : Chris Martenson - Eric Sprott: Global Gold Demand Is Overwhelming Supply
Zero Hedge - The Real Reason Why Germany Halted Its Gold Repatriation From The NY Fed
GOLD NANO-PARTICLES : BusinessWire - Maryland High school Student uses Gold Nano-Particles in the Fight Against Cancer to Win MIT Science Contest
VIDEO : PressTV - Iran inaugurates ME's biggest gold-processing plant
11/13/14 - Bullion News
Mauldin Economics - Three Steps Forward, Two Steps Back
Londonist - Where Are London’s Gold Vaults?
Sunshine Profits - Sunshine Profits’ Take on the Swiss Gold Referendum
GoldReporter.de - The demand for gold coins and gold bars in Germany rose in the third quarter compared to previous quarters and the previous year - Google Translation Link
BDlive - Price manipulation scandal demands answers
The Wall Street Journal - India Regains Place as Top Gold Consumer, For Now
Perth Mint Blog - Indian Jewellery Demand A Highlight In Subdued Q3 Gold Market – World Gold Council
TECHNICAL ANALYSIS : Kimble Charting - The Next Move for the Euro will be the same for Gold
The Bullion Desk - Russia buys 55 tns of gold in Q3, central banks seek protection
GoldChat - New blog by an ex-RBA gold sale/leasing analyst
VIDEO : USA Watchdog - Outlook for Dollar Not Good-James Turk
Casey Research - “Paper Gold” and Its Effect on the Gold Price
GOLD NANO-PARTICLES : NanoWerk - NIH Award for Cancer Diagnosis with Photo-Switchable Nano-Particles
11/12/14 - Bullion News
Tocqueville Fund’s Robert Kleinschmidt prides himself on being an independent thinker...While the rest of Wall Street has been expecting the Federal Reserve to raise interest rates he says they won’t and explains why...
VIDEO : Wealth Track - KLEINSCHMIDT – CONTRARIAN VALUE : Link to Video Above
TECHNICAL ANALYSIS : Gold-Eagle - Gold Needs Some Giddy-up…And Soon
The Sovereign Investor - Gold: The One Commodity Buffett and Bernanke Just Don’t Understand
Mining Weekly - Swiss regulator flags attempt to manipulate bullion benchmarks
AUDIO : McAlvany Weekly Commentary - Richard Duncan: QE4? “They’ll have to.”
Money and Markets - Inflation and Deflation: Two Sides of the Same Coin!
11/11/14 - Bullion News
Rick Ackerman - Deflation’s Worst Nightmare: A Short-Squeeze on the Dollar
Sunshine Profits - The Negative Relationship Between Gold and the U.S. Dollar
Zero Hedge - As QE3 Ends, Fed Reserves Have Biggest Drop Since Start Of QE
CoinNews - US Mint to Resume Bullion Silver Eagle Sales on Nov. 17
The Corner - Bond purchase: A signal of coming collapse
VIDEO : Bloomberg - Central Bank Winners and Losers by Balance Sheets
The Corner - Bond purchase: A signal of coming collapse
GoldReporter.de - Gold Market: Change US banks back to the buyer - Google Translation Link
TECHNICAL ANALYSIS : SOLARCYCLES - Cross Asset Position
VIDEO : CNBC - Pisani: Seeing real moves in gold
The Deviant Investor - Silver to S&P Ratio: What It Tells Us
GoldSilverWorlds - The Dow Jones To Gold Ratio: Will 2015 Be The Turning Point?
CHARTS : Zero Hedge - Just 15 WTF Charts
VIDEO : Learn Liberty - An Example of Young Americans Showing What the Know about the Business Cycle
Economic Policy Journal - ISIS Wants to Introduce Gold and Silver Coins as Its Money
11/10/14 - Bullion News
The Bullion Desk - "The recent gold price drop represents an excellent opportunity for long-term investors to add the yellow-metal to their diversified portfolios," Joe Wickwire, Fidelity Investments Portfolio Manager
Perth Mint Blog - 2015 Year Of The Goat 1oz Bullion Coins Officially Sold Out
VIDEO : Gordon T Long - MACRO ANALYTICS - Following Japan's Failed Economic Model w/Charles Hugh Smith
USA Today - China hoarding gold to challenge U.S. dollar?
BullionStar - Chinese Gold Demand Strong, Mainstream Media Twisting
VIDEO : RT - Jim Rogers: By the end of this decade US dollar will lose world dominance
Sovereing Man - Still happening: Canada just became North America’s first offshore renminbi hub
VIDEO : CNBC - Rick Santelli and David Stockman, former OMB Director under President Reagan, discuss the truth behind infrastructure spending
CHART : Bloomberg - Swiss Gold Vote Approval Would Boost Reserves
Gold Investing News - Survey: Switzerland Looks to Vote on Future of Gold
CoinNews - US Mint Coin Production in October Tops September
The Gold Report - Frank Holmes Talks No-Drama Investment Strategy
VIDEO : Casey Research - Only a Handful of Companies Have Any Real Cash: Mish Shedlock
Money Morning - Gold Stocks Are Bottoming – Here's How to Profit
Market Watch - Gold will signal when stocks have peaked
11/09/14 - Bullion News
Ludwig von Mises Institute - Why The Theory of Money and Credit Is More important Than Ever
Economic Policy Journal - This is Why We Need the Mises Institute
PDF : Wizzen Trading - Technical Analysis : Gold Pulls A Rabbit Out Of A Hat
AUDIO : GoldSeekRadio - Interview with David McAlvany
TECHNICAL ANALYSIS : CEO.CA - Gold’s 3% Rally Sets Stage for Important Week Ahead
GATA - FT : UBS to settle allegations over precious metals trading
CHART : GoldtotheMoon - Gold to Silver Ratio is Getting Close to a Top...
AUDIO : YouTube - Alan Greenspan talks GOLD (UNCUT VERSION)
Of Two Minds - One Chart, One Question
Ahead of the Herd - Gold's Fundamental Supply Picture
The Telegraph - The 1,100-year-old Royal Mint is moving in a modern direction
Bloomberg - Changing Century-Old World Silver Fix Was Just the Start
Xinhua.Net - News Analysis: PBOC's quiet liquidity injection
11/07/14 - Bullion News
Wealth Daily - It is not Surprising that the Dollar has Been Strong. But We Have to Ask, Compared to What?
TECHNICAL ANALYSIS : Kimble Charting - U.S. Dollar could reverse direction here, says Joe Friday
Zero Hedge - Greenspan's Stunning Admission: "Gold Is Currency; No Fiat Currency, Including the Dollar, Can Match It"
The Telegraph - Miners facing 'bloodbath' if gold sinks to $1,000
VIDEO : BNN - Frank Holmes : Fear and Love: The trade in gold and why streamers stand out
Reuters - Century-old gold price 'fix' swept away with ICE platform
Seeking Alpha - CPM Group Needs To Take Silver Investor Demand Seriously
Profit Confidential - Money Supply Strongly Suggests Higher Inflation Ahead
Business Insider - LARRY FINK: Savers Need An Extra Trillion Dollars To Support Themselves In Retirement
BullionStar - Beijing Forum: New Global Financial Order Is Essential
11/06/14 - Bullion News
Reuters - Gold miners plan drastic cuts to stay afloat as bullion sinks
The Telegraph - It's all change for UK coinage as Royal Mint reveals new portrait of The Queen will be used next year
Investing - "At a yet unannounced date, the U.S. Mint will stop selling 2014-dated American Silver Eagles as it begins to build 2015-dated inventory for sale in early January. It has already produced some coins for next year but that stopped when demand picked up again for this year’s issues."
GOLD NANO-PARTICLES : Cancer Research UK - What exactly is Google’s ‘cancer nanodetector’?
Market Watch - Buyer beware? Investor sentiment at highest level of 2014
TECHNICAL ANALYSIS : SOLARCYCLES - Chart Update for November
VIDEO : CNBC - QE is over, but Western Central Banks are Forcing Banks to buy more Gov't #Debt - Santelli Exchange
Peak Prosperity - Central Planners Are In A State of Panic
The Bucks Herald - Metal detectorist is quids over rare coin find
MINING - Deep-sea miner Nautilus to charter ship as floating base
11/05/14 - Bullion News
BullionStar - The Mainstream Media Versus Gold
My Budget 360 - The government is already in a soft default and is addicted to low interest rates: Government expenses at $3.87 trillion while receipts enter at $3.29 trillion
The Telegraph - Gold funds down by 80pc: should you invest?
Zero Hedge - US Mint Sells Out Of Silver Eagles Following "Tremendous" Demand
Economic Times - Silver lining in precious metals' rout catches out coin mints
AUDIO : McAlvany Weekly Commentary - Ian McAvity, Chief Executive Officer and President of Duncan Park Holdings Corp. on Gold
The Gold Report - Gold, Economic Theory and Reality: A Conversation with Alan Greenspan
Economic Policy Journal - BREAKING: Russia May Ban Circulation of US Dollar
Contra Corner - Why There Is No Escape Velocity: Household Spending Is Chained To Income Absent A Credit Bubble
Profit Confidential - How Markets Will Handle End of Money Printing Era
Bloomberg - 1,500 Tons of Gold on the Line in Swiss Vote to Buy Back Bullion
Numismaster - Plastic newest composition for coins
11/04/14 - Bullion News
Zero Hedge - Interest Rates Cannot Rise - Here's Why
Bonner and Partners - Are You in “Dollar Denial”?
The Daily Bell - QE: An Ending That Isn't
Sober Look - Decomposing the velocity of money
Money Morning - The Fed's Lost Grip on Interest Rates
Sprott Thoughts - Jim Rickards Exclusive Interview: The Fed Basically Still Uses LTCM’s Financial Models
VIDEO : TheGoldandOilGuy - Chris Vermeulen's Latest Technical Analysis on the Commodity Markets
GOLD NANO-PARTICLES : Discovery - Death Ray 'Spasers' Kill Cancer
Bullion Vault - Gold Buyers Drop 19%, Sellers Rise 9%
Scrap Monster - India's Gold bullion imports hit 17-month high in October
CoinNews - US Mint Bullion Coin Sales Rally in October
Gold Reporter.de - German Precious Metal Dealers Report Huge Run on Silver Coins
Perth Mint Blog - The Perth Mint's October Sales
South China Morning Post - Chinese unmoved by slump in gold to 4-year lows, prices seen dipping further
MINING - JPMorgan not leaving physical commodities: report
11/03/14 - Bullion News
Casey Research - Jeff Clark Tackles Tough Questions from Investors
The Bullion Desk - Comex gold price falls again on strong dollar, more technical selling
TECHNICAL ANALYSIS : Sunshine Profits - Gold & Silver Trading Alert: HUI to Gold Ratio at Its 2000 Low
Global Financial Intelligence - CRASH OF GOLD AND SILVER PHYSICAL DEMAND TRIP - Google Translation Link
Bullion Vault - Gold Standard: Crackpot or Near Perfection?
VIDEO : Bloomberg - Marc Faber: Japan Is Engaged in a Ponzi Scheme
Gold-Eagle - Gold And US Dollar
The Deviant Investor - What About Gold Now?
TECHNICAL ANALYSIS : SafeHaven - Rambius Chartology - Precious Metals Bear Market- Phase III ( Part III) ...The Strategy
Acting Man - Monetary Metals Supply and Demand Report
VIDEO : Bloomberg - Federal Reserve Bank of Dallas President Richard Fisher speaks in New York about the U.S. economy and Fed policy - Full Speech
True Contrarian - "The art of investing is not about figuring out what has already happened. It's about anticipating the future...
GOLD NANO-PARTICLES : Dark Daily - Gargling with Gold Nanoparticles Provides a Non-invasive Way to Diagnose Cancer and May Provide Pathologists with a Useful New Clinical Laboratory Test
11/02/14 - Bullion News
AUDIO : FSN - Danielle Park – Getting Ready For The Other Shoe To Drop
Zero Hedge - Silver Coin Sales At US Mint Soar To Highest In Two Years
VIDEO : TF Metals Report - Koos Jansen was a featured guest on the German financial TV
AUDIO : Rick Ackerman - Monetary Masturbation No Match for Deflation
Emirates 24/7 - India slashes gold tax as prices sink to 2010 levels
VIDEO : CNBC - Kiosk carnage becomes indicator of gold's top
Daily Mail - Support for Swiss gold referendum falls in latest poll
TECHNICAL ANALYSIS : Bullion Barron - Failed Triple Bottom in Gold
VIDEO : Kitco - Technical Analysis : Gary Wagner : Gold Broke Below $1,180 Level; What’s Next?
TECHNICAL ANALYSIS : SOLARCYCLES - November
PDF : Wizzen Trading - Technical Analysis : Halloween Hell For Metals
TECHNICAL ANALYSIS : Gold to the Moon - Gold & silver hits support levels, November will be crucial
TECHNICAL ANALYSIS : SafeHaven - Gold, Dow and VIX Analysis
Free Shipping on Orders $199+ | 5.0 star Customer Reviews
10/31/14 - Bullion News
The Sovereign Investor - Gold and Deflation: History Shows That Conventional Wisdom is Wrong!
The Bullion Desk - Gold price tumbles below major technical support
TECHNICAL ANALYSIS : Business Insider - The Dollar Is On The Brink Of The Biggest Technical Break In Fiat Currency History
Money and Markets - Gold: The Ultimate Store of Value?
Bloomberg - Kuroda Surprises With Stimulus Boost as Japan Struggles
The Independent - Japan lifts world stock markets with surprise extension of stimulus programme
TECHNICAL ANALYSIS : Trader Dan's Market Views - Surging US Dollar Technically Strong on the Chart
Reuters - MF Global settles platinum, palladium manipulation claims
BullionStar - The Great Chinese Silver Market Debate
China Daily - Precious metal shipments to Hong Kong under scrutiny
TIMELINE : CNBC - The gold price and the Fed's rocky relationship
VIDEO : CNBC - Santelli Exchange: Central bank happiness
Sprott Money Blog - Kim Kardashian and Fiat Money Have the Same Intrinsic Value
Casey Research - How to Get Bacteria to Tell Cancer to Kill Itself
10/30/14 - Bullion News
MINING - Bears are Ripping Precious Metals Apart
The Bullion Desk - GOFO-Less Market on the Horizon, Regulation Pushing Banks Out
TECHNICAL ANALYSIS : Gold-Eagle - Gold Weakens As The US Dollar Strengthens…Again
BBC - Royal Mint Tries to Entice Investors with New Gold Bullion Coins
TECHNICAL ANALYSIS : SOLARCYCLES - October 2000 vs. October 2014
BullionStar - Chinese Gold Demand 1541t YTD
Bloomberg - China Said to Investigate Surge in Precious Metals Exports
CHARTS : Zero Hedge - Gold Drops Below $1200 On Heavy Volume, Silver Freefalls To Feb 2010 Lows
VIDEO : CNBC - Alan Greenspan, Former Fed Chair, Goes for the Gold
GoldSeek - The REAL Reason Your Stockbroker Hates Gold...
rediff - India's silver jewellery exports gain momentum
10/29/14 - Bullion News
Investor Intel - Swiss referendum could effectively re-launch the ‘gold standard’
VIDEO : Bloomberg - Jim Grant talks about Federal Reserve policy, the bond market and the U.S. economy
CHARTS : Advisor Perspectives - NYSE Margin Debt Drifts Higher Again in September
AUDIO : McAlvany Weekly Commentary - Interview with The Aden Sisters - About this week’s show: We shouldn’t be in a bull market...but, Buy gold on any weakness, and QE ending?...not for long
Zero Hedge - Alan Greenspan: QE Failed To Help The Economy, The Unwind Will Be Painful, "Buy Gold"
VIDEO : Gordon T Long - FINANCIAL REPRESSION AUTHORITY w/Grant Williams
AUDIO : Peter Schiff - The Deflation Propaganda Effort Continues
VIDEO : CNBC - Why there is a lot of Disbelief that this is the last we'll see of QE
The China Money Report - Chinese media: “We are the Gold Consumption Super-Power.” Chinese citizens now holding over 6,000 tons
ProducersWeb - A Critic's View on Gold and What to Expect from SOME Pawnshops and Bullion Dealers
Bloomberg - Russia Buys Most Gold for Reserves Since Financial Crisis of ’98
Sovereign Man - Historical figures’ salaries in gold: Leonardo da Vinci
10/28/14 - Bullion News
OilPrice - These Gold Numbers Are About To Hit A 15-Year High
Reuters - U.S. Mint's Eagle gold coin October sales are highest since January
Bullion Vault - Gold as Investment Insurance
VIDEO : Zero Hedge - How China & Gold Will Shape The Future
The Bullion Desk - Chinese imports of gold from HK at 5-mth high, physical demand improves
MINING - How the central bank squandered Switzerland's gold reserves
Monetary Metals - Fans of Central Banking Have an Achilles Heel
TECHNICAL ANALYSIS : Market Anthropology - The World According to ZIRP
The Deviant Investor - A Tale of Two Cities
The Bullion Desk - SocGen pulls out of GOFO rate setting
AUDIO : FSN - David Morgan – Silver Summit Wrap-Up
Economic Times - Platinum jewellery is gaining more favours among young Indian customers, say retailers
VIDEO : Perth Mint Blog - 1 gram Kangaroo Minted Gold Bar
10/27/14 - Bullion News
TECHNICAL ANALYSIS : Investing - The Negative Correlation of The Dollar And Gold: A Myth?
Futures Mag - Gold returning to greatness?
Hard Assets Investor - Don't Get Bullish On Gold Until It Breaks $1,350
The Bullion Desk - Gold prices steady, GOFO slips into backwardation
Sovereign Man - Quantitative Easing is like “treating cancer with Aspirin”
CHARTS : Advisor Perspectives - Treasury Snapshot: A Checkpoint with this Week's Expected End of QE
VIDEO : Daily Reckoning - Why the Fed Will Launch Another Round of QE
Zero Hedge - Can't Find Any Inflation? Here's A Place To Start
Profit Confidential - Gold buying in India is up 450% in the first nine months of 2014 compared to the first nine months of 2013
Munknee - Own Physical Gold and/or Silver? Here Are Some Ideas On How To Store/Hide It
The Gold Report - Oliver Gross Says Peak Gold Is Here to Stay
10/25/14 - Bullion News
VIDEO : DailyFX - Technical Analysis : WTI Eyes $80 On Glut Concerns, Gold Holds Ahead Of US Event Risk
Times of India - Swiss gold exports to India cross record high level of over 11 billion Swiss francs
Metal Miner - Dwali in India and National Day in China Come to Gold’s Rescue
ZEAL - Bullish Silver Stealth Buying
CoinWeek - Ancient Coins: The Most Famous Coin of Antiquity
AUDIO : GoldBroker - Egon von Greyerz: A Swiss Gold Referendum YES Vote Will Be a Trendsetter for Central Banks
SLIDESHOW : Investment U - Precious Metals Investing: Bullpen Charts
The China Money Report - U.S. Pressures World Against Asian Infrastructure Bank
San Fransisco Chronicle - Giant gold 'Butte Nugget’ sells to secret Bay Area buyer
Zero Hedge - Another Deutsche Banker And Former SEC Enforcement Attorney Commits Suicide
Journal-Sentinel - Watchdog Report - FDA approves cancer drugs without proof they're extending lives
10/24/14 - Bullion News
McClellan Financial - Deflation Is Getting Too Popular
VIDEO : Bloomberg - Cohan: Fed Is Somewhat Deranged, QE Worsened Inequality
Bullion Vault - Silver Buyers "Not Investing, But Stacking"
Numismatic News - Arches 5-ounce outsells Shenandoah
TECHNICAL ANALYSIS : SOLARCYCLES - New Moon Reversal?
Wolf Street - The High Price of Free Money: Bankers are Fretting that the Wealth Gap Poses a “Risk to the Financial System”
VIDEO : CNBC - Buyback blues hit the Street
VIDEO : BNN - Canadian trading hub for yuan could materialize as early as November
SF Gste - 6-pound gold Nugget is Rock Star of S.F. Antique Show
Free Shipping on Orders $199+ | 5.0 star Customer Reviews
10/23/14 - Bullion News
Money and Markets - The Binge, the Bartender and the Austrian Hangover Theory by Charles Goyette
CHARTS : GoldSilverWorlds - What Is The Link Between Gold And QE?
CHARTS : Advisor Perspectives - A Long-Term Look at Inflation
AUDIO : McAlvany Weekly Commentary - Cry for me Argentina! A Tearful Inflation
Profit Confidential - About That Referendum in Switzerland...
Reuters - Swiss gold referendum holds risks for franc
VIDEO : Kitco - All The Easy Gold Is Gone - Discovery Channel’s Gold Rush Crew
Daily Reckoning - Your Personal Gold Standard - by James Rickards
China Daily - Tulip Mania - Precious tulips plundered in Central China
10/22/14 - Bullion News
Global Research - The Instability of Financial Markets: Why is Volatility Increasing
Ludwig von Mises Institute - The End of QE3, Trouble Ahead for the Bulls?
VIDEO : CNBC - Santelli Exchange: End of QE crutch
CoinWorld - Demand for American Eagle silver bullion coins pushing sales totals toward record
The Silver Institute - Total Silver Investment May Increase By One Billion Ounces Over the Next Decade
Sovereign Man - New data shows it will take 398,879,561 years to pay off the debt
BullionStar - China Gold Association: 2013 Gold Demand 2199t
CHARTS : Advisor Perspectives - What Inflation Means to You: Inside the Consumer Price Index
The Deviant Investor - Gold Or Crushing Paper Debt?
Reuters - Top bullion consumer China works on first gold forwards, options
INFO~GRAPHIC : Visual Capitalist - A History of Notable Stock Bubbles
The Independent - Nelson Bunker Hunt dead: Former world’s richest man dies in modest circumstances in US after losing his fortune
The Bullion Desk - CME ‘proud’ of silver fix system, says more improvements on horizon
10/21/14 - Bullion News
CoinWorld - 2015 Panda bullion, collector coins lack inscriptions for weight, metal, fineness
CoinNews - Gold Hits 5-Week High, Silver Eagle Bullion Coins Top 36M
Numismaster - Silver Demand Tops Gold
GoldReporter.de - Australians found two gold nuggets with 4 pounds of weight - Google Translation Link
GoldCore - First Swiss Gold Poll Shows Pro-Gold Side In Lead At 45%
GoldChat - Gold market update
IBTimess - Russia's Gold Rush: Putin Orders Gold Reserve Buying Spree To Beat Western Sanctions
South China Morning Post - LME plays Asia card in bid for gold pricing job
The Pharmaceutical Journal - Study Identifies How Gold Nano-Particles Penetrate Skin
Of Two Minds - In Uncharted Waters
Profit Confidential - About That QE4...
The Blaze - JP Morgan Set to Pay $1 Billion to Cover Yet Another Fraud...Derivatives... Looming Issues to Come
VIDEO : The Atlantic - Why Are Americans So Bad at Saving Money?
VIDEO : CNBC - Teaching Your Kids About Money Early Will Payoff
10/20/14 - Bullion News
TECHNICAL ANALYSIS : Kitco - Gold Bulls Run Into Sticky Fibonacci Resistance
The Globe and Mail - How much does it really cost to mine an ounce of gold?
CHART : King One Eye - Gold Silver Ratio Chart
VIDEO : CNBC - Goldman Sachs Sees the Stock Market's Salvation through the End of the Year and It's all about the BuyBacks
VIDEO : Zero Hedge - Rick Santelli & Peter Schiff: QE Consequences...
MineWeb - A year of hard-wrought lessons for platinum
CoinWorld - World mints are catering to big buyers with half-ounce silver coins
EconomicPolicyJournal - Price Inflation for the Masses: McDonald's Gets More Expensive
BullionStar - The Chinese Precious Metals Market Is On Fire
NDTV - Indian Government May Reimpose Curbs on Gold Imports
CHART : GoldBroker - Russian Gold Reserves Rise Sharply
Business Insider - Here's The Career Advice Investing Legend Jim Rogers Gives Everyone
10/19/14 - Bullion News
Investing - Inflation Already Happened
The Telegraph - World economy so damaged it may need permanent QE
PDF : Wizzen Trading - Technical Analysis : Chop For Metals And Blood For Markets
AUDIO : Peak Prosperity - Fuzzy Numbers - Crash Course Chapter 18
Got Gold Report - Frank Holmes : What the Strong Dollar Does to Yellow and Black Gold and Why We're Seeing Green
Times of India - Pushya Nakshatra sees gold sale soar in city - The sale of gold jewellery in particular was up by 20%-30% in comparison to the festive period last year.
Bloomberg - Gold Bulls Lured Back for First Time in Two Months: Commodities
AUDIO : TF Metals Report - Interview with Eric Sprott
AUDIO : Physical Gold Fund - Interview with Jim Rickards
The New York Times - Seeking an Explanation After a Benchmark Bond’s Unnerving Move
Casey Research - What If Deflation Wins?
AUDIO : Chris Martenson - Dan Amerman: Will Our Private Savings Be Sacrificed To Pay Down The Public Debt?
News Observer - Apartments pushed up US homebuilding in September
10/17/14 - Bullion News
Money Morning - Of All Safe Haven Investments, Gold Reigns Supreme
CATO Institute - Accuracy of Macroeconomic Forecasts
TECHNCIAL ANALYSIS : SOLARCYCLES - Comparing Stock Market Peaks
Sovereign Man - Russians and Chinese are ditching the dollar as Europeans start using renminbi in their reserves
Hard Assets Investor - Marc Faber : Gold Buffers Stock Market Correction
CEO.CA - A Major Turning Point?
The Corner - US companies: When having too much money is a bad sign
McAlvany Weekly Commentary - Russell Napier: A Dearth of Dollars
MedicalPhysicsWeb - Nanoparticles Target Tumour Vasculature
Kitco - LBMA Receives Eight Proposals For New Gold-Fixing Mechanism!
Money and Markets - Central Banking’s “Fatal Flaws” Dooming the Economy!
Bloomberg View - Just Try to Refinance. I Dare You
10/16/14 - Bullion News
Minyanville - Michael Gayed: The Wrong Rates Are Rising
TECHNICAL ANALYSIS : SOLARCYCLES - Capitulation?
VIDEO : Sprott Group - Sprott Precious Metals Roundtable Webcast - October 2014
CHARTS : Next Big Trade - The Dollar Will Be Sacrificed and Gold Will Soar
VIDEO : Bloomberg - Federal Reserve Bank of St. Louis President James Bullard : Fed Should Consider Delay in Ending QE - Full Interview
The Bullion Desk - Race for gold fix wide open after LME wins PGM benchmarking role
SLIDE-SHOW : Visual Capitalist - A Year’s Worth of Resources in British Columbia
The Deviant Investor - Gold Prices Since 9-11
Sovereign Man - Forget about Ebola – here’s why US banks (and your savings) are now EXTREMELY vulnerable
Reuters - Labor strife, safety concerns push South Africa platinum mechanization
Bloomberg - Platinum Falls Below Gold for First Time Since April 2013
AsiaOne - Singapore gold trade set to keep glittering
Yahoo Finance - LBMA names Morgan Stanley as gold, silver market maker
10/15/14 - Bullion News
The Corner - The Fed Tightens and Then is Surprised with the Outcome!?
Perth Mint Blog - 25 Years Of The Australian Kookaburra
Zero Hedge - 12 Charts That Show The Permanent Damage That Has Been Done To The US Economy
Sprout Money - The Many Different Ways the Argentinean Situation Teaches You About the Importance of Owning Gold
Bloomberg - Gold Imports by India Seen Rising More Than Fourfold Last Month
Economic Policy Journal - Governments Need Inflation, Economies Don't
The Telegraph - BIS warns on 'violent' reversal of global markets
CEO.CA - Is Deflation Bullish for Gold?
Jesse's Cafe' Americain - Gold's Potential Triple Bottom and the 1.618 Golden Ratio In Timing
VIDEO : FNN - James Turk: Forget promises, buy physical assets
CoinWorld - Royal Canadian Mint, APMEX issue small Grey Wolf silver bullion coin
VIDEO : CNBC - Time to reduce reliance on the dollar: Russia PM
10/14/14 - Bullion News
Futures Magazine - Jim Rogers on the Fed and Global Economics
Canada Real Time (WSJ) - Canada’s Main Stock Index Hits Correction Territory
CoinNews - Gold Nears 4-Week High; Silver Eagles Top 35M
Bullion Vault - FT's Martin Wolf in "Not Wrong" Shocker
CNBC - More QE might be appropriate if economy faltered: Fed's Williams
Acting Man - Gold Outperforms Stocks Year-to-Date
VIDEO : Economic Policy Journal - Peter Schiff: China's Boom and Lust for Gold
TECHNICAL ANALYSIS : The Deviant Investor - Silver, Warfare and Welfare
The Corner - Basel III and the liquidity ratio mess
The Bullion Desk - Several Chinese banks eyeing gold, silver fixes – LBMA spokesman
TECHNICAL ANALYSIS : Market Anthropology - How Very Wet This Water Is...
AUDIO : FSN - John Rubino – Suddenly We Have Lots of Problems
10/13/14 - Bullion News
SRSrocco Report - PHYSICAL GOLD INVESTMENT: The United States Ranks Worst In The World
Seeking Alpha - Do Silver Shorts Know There Is A Physical Supply Deficit?
GoldReporter.de - China confirms gold demand of more than 2,000 tons - Google Translation Link
Econ Matters - The Fed Has to Sell Treasury Holdings Back to Marketplace
Sovereign Man - One simple chart to explain the defining problem of our times
VIDEO : CNBC - Venezuela's staggering inflation rate - "Do the reason's sound familiar?"
Dollar Collapse - Suddenly, We Have Problems
Zero Hedge - Doug Kass: The Day The Market Died
MoneyBeat (WSJ) - Here’s Why the 200-Day Moving Average Matters
VIDEO : USA Watchdog - Greg Hunter Interviews Jim Rickards
Jesse's Cafe' Americain - Harvey Organ's Gold and Silver Blog Has Been Completely 'Deleted by Court Order'
10/12/14 - Bullion News
CHARTS : Inside Futures - Silver and Gold, Silver and Gold! - What are the Past Trends of the Gold/Silver Ratio Telling Us...?
AUDIO : BullionStar - Turd Ferguson Interviews Koos Jansen
Econ Matters - The Fed Can`t Raise Rates Because the Sky Is Blue
VIDEO : Peak Prosperity - Understanding Asset Bubbles
Forexlive - Loads of FX-related comments from central banks and others over the weekend – all in one place
GRAPHIC : Stat Monkey - World Gold Production Statistics by Country
VIDEO : Fox Business - Former U.S. Mint director Ed Moy explains why he sees opportunity in gold.
CoinWeek - The Coin Analyst: U.S. Mint News Update for October
PHYS.org - Researchers create plasmonic paper for detecting chemicals and biologically important molecules
10/10/14 - Bullion News
TECHNICAL ANALYSIS : GoldSilverWorlds - 5 Reasons Why The Gold Price Could Have Bottomed at $1,180
MineWeb - Silver in supply deficit but price unmoved so far
Profit Confidential - Why Stock Buybacks Will End Up Being a Terrible Investment for Companies
McClellan Financial - COT Data Show A Bottom For Copper
Goldreporter.de - Silver has extreme potential to catch up - Google Translation Link
Free-Bullion-Investment-Guide - First Cancer Research Update for Dr. Steven Curely's Research Team at the Baylor College of Medicine
AUDIO : WallStforMainSt- Jim Rickards: China Wants The SDR
The New York Times - U.S. Opposing China’s Answer to World Bank
GATA - Goldcorp CEO visits Australia and predicts 'peak gold' next year
VIDEO : GoldBroker - Chris Powell on the Western Gold Price Suppression Scheme
The Bullion Desk - CME cuts margins for gold, silver, platinum
Bloomberg - Sibanye Sees South Africa Platinum Union Growing in Gold
The Bullion Desk - LBMA confirms at least 12 applicants in gold fix race
10/09/14 - Bullion News
VIDEO : Kitco - Doug Casey Suggest that Individuals Take Advantage of the Dollar's Current Strength and Move Out of It with...
Bloomberg - Gold Posts Longest Rally Since June as Rate Concerns Ease
VIDEO : CNBC - Peter Boockvar of the Lindsey Group laments the state of the American saver
VIDEO : CNBC - Peter Boockvar says the Fed's minutes show why it's finally time for gold to shine again - Rest of Interview posted immediately above
Bullion Vault - Central Banks "Face a Mess" Buying Gold, Platinum & Palladium
The Deviant Investor - When Will They Ever Learn?
TECHNICAL ANALYSIS : SOLARCYCLES - V-Correction Or Breakdown Part 2
CHARTS : Advisor Perspectives - Market Tops and Bottoms Since 1950: The October Effect
The China Money Report - After 400 Years…China is back on top of the World Economy
USA Today - China currency push takes aim at dollar
Sprott Money Blog - The East Saves in Precious Metals, The West Saves in Fiat
SRSrocco Report - U.S. MINT RECORD SILVER EAGLE SALES: Best All Year
MineWeb - World top 15 gold producers - output still rising but peaking this year
10/08/14 - Bullion News
TECHNICAL ANALYSIS : SafeHaven - Gold: a Simpleton's View
VIDEO : GoldtotheMoon - Silver...When to Buy, When to sell...
MICRO-DOCUMENTARY : Gold-Silver Profits - Boom And Bust Cycles Are Created By Central Banks
MineWeb - Is Russia and South Africa looking to corner the PGM Market...
VIDEO : CNBC - Fed minutes: Staff cuts growth outlook due to higher dollar
Zero Hedge - FOMC Talks Down Dollar, Fears Growth Slowdown, "Considerable Time" Misunderstood
INFO~GRAPHIC : JM Bullion - The 15 Greatest Gold Heists of All Time
AUDIO : McAlvany Weekly Commentary - Inflation, Deflation & Gold
The Gold Report - David Morgan's Secret to Being Grateful, Even at $17 Silver
BloombergView - How Low Can Gold Go? by Barry Ritholtz
FOLLOW-UP : BloombergView - Gold Brings Out the Cranks by Barry Ritholtz
Bullion Vault - China's Demand to Buy Gold Jewelry Jumps as Golden Week Spending Rises 12%, Premiums to London Price Firm
INFO~GRAPHIC : Visual Capitalist - The History of Metals
CoinWeek - Mike Getlin: Google Killed Merit Gold
10/07/14 - Bullion News
Numismatic News - Gold for profit or wealth preservation?
Profit Confidential - A Rational Look at Silver
TECHNICAL ANALYSIS : TradingView - Two Possible Scenarios for Gold's Future Price
Bullion Vault - Gold Mining Costs "Led by Prices", Not the Reverse
PDF : Sprott Precious Metal Watch - Review of the September's Market
Oil Price - The U.S. Government Is Warning on Platinum Mining Here
VIDEO : Bloomberg - Jim Rickards: Fundamental U.S. Economy Is Very Weak
TECHNICAL ANALYSIS : The Deviant Investor - Gold and the S&P 500 Index: Sum and Ratio
True Contrarian - THE U.S. DOLLAR IS TODAY'S BUBBLE
Zero Hedge - Chart Of The Day: Why Every Corporate Bond Manager Is Freaking Out
REWIND : Liberty Fund - Mises on the gold standard as the symbol of international peace and prosperity (1949)
Daily Pfennig - The Dollar drops the most in over a year...
VIDEO : The Street - Gold Bear Turns Near-Term Positive as Some Technical Indicators Shift
CHARTS : McClellan Oscillator - Commercials Betting On Big Dollar Downturn
The Sovereign Investor - Currency Swap: Escape the U.S. Dollar While It’s Strong
10/06/14 - Bullion News
GoldStockBull - Why NED Davis is Dead Wrong About $660 Gold
Bloomberg - S&P 500 Companies Spend 95% of Profits on Buybacks, Payouts "The point of concern is where the future growth is going to come from."
TECHNICAL ANALYSIS : Market Anthropology - On the Dark Side of the Dollar
Numismatic News - Will Rationing Return to Limit Purchases of 2014 Silver American Eagle Bullion Coins from the U.S. Mint?
International Man - Will Gold Crash with the Dow… or Soar?
VIDEO : Kitco - Everyone’s Shorting Gold; Due For A Rally - Frank Holmes
TECHNICAL ANALYSIS : Acting Man - Financial Markets, Payrolls and the Interest Rate/Inflation Consensus
GoldReporter.de - "Commercials" Only Sell 188 Tonnes of Gold to Date - Google Translation Link
Ludwig von Mises Institute - Inflation's Not the Only Way Easy Money Destroys Wealth
TECHNICAL ANALYSIS : Kimble Charting - Currency Forces…May they be with you, going forward!
Bullion Vault - Gold Bullion Hits Triple-Low Near $1180, Sentiment at "Rock Bottom" on Absent China, Rising Dollar
Sovereign Man - This one chart shows exactly how undervalued gold is right now…
10/05/14 - Bullion News
ValueWalk - Tocqueville Gold Strategy Q3 2014 Investor Letter
Bloomberg - Gold Bulls Retreat as Short Holdings Rise to Highest Ever
TECHNICAL ANALYSIS : GoldtotheMoon - Gold stocks hit major support level
Pittsburgh Post-Gazette - Silver's slide hurting investors, but may help shoppers
MINING - Precious metals market report by Alasdair Macleod, GoldMoney, Head of Research
Daily Pfennig - The Many Roads To Currency Ruination
Yahoo Finance - Dollar’s Rally Has Grown Even More Extreme
VIDEO : RT - Max Keiser and Jim Rickards Currency Wars and the Death of Money
BullionStar - China Buys 45t Of Gold Ahead Of Golden Week
VIDEO : Peak Prosperity - A National Failure to Save & Invest - Crash Course Chapter 16
GRAPHIC : Zero Hedge - The Change In Cost Of Living Since 1938
Mish's Blog - Shifting Debts: The Gold Standard: Both Good and Necessary
FARS - Supersensitive Nanodevice Can Detect Extremely Early Cancers
10/03/14 - Bullion News
TECHNICAL ANALYSIS : Kitco - Charts Don't Lie, No Sign Of A Bottom In Silver
CEO.CA - How Dire is it for Gold?
TECHNICAL ANALYSIS : The Daily Gold - Precious Metals to Face More Body Blows
SilverCoins - 101 Uses of Silver in Everyday Life
TECHNICAL ANALYSIS : Kimble Charting - Long Decline in Silver Could Soon Be Over
CoinNews - 2014 Platinum Eagle Bullion Coin Sales Stop at 16,700
Bullion Vault - Who Needs Alan Greenspan When You've Got Gold?
Wealth Daily - When Insiders Start Buying Gold
My Budget 360 - Inflation over 270 years: It is hard to feel the tornado of price erosion when you are standing in the eye of the financial storm.
Zero Hedge - "Hiring Grandparents Only": 230K September Jobs Added In 55-69 Age Group; 10K Lost In Prime, 25-54 Group
Coventry Telegraph - Unearthed: Four amazing metal detecting discoveries
Investing and Trading - London Metal Exchange (LME) To Increase Trading Fees
Market Watch - Bernanke may have tried to save $300 a month in failed refi
10/02/14 - Bullion News
Money Morning - Taking Profits in a $1.5 Quadrillion Bubble
VIDEO : Mish's Blog - Gordon Long Video Interview of Mish: Topic - Financial Repression (and How to Defend Yourself From It)
Sovereign Man - Gold is making a dramatic comeback in the financial system
CHART : Perth Mint Blog - Monthly Sales – September 2014 - Gold Sales Increase...
The Deviant Investor - Gold To Silver Ratio – Sentiment
VIDEO : CNBC - Fed to Stay Lower For...ever?
The Telegraph - Mario Draghi's QE: too little for markets, too much for Germany
CHART : Jesse's Cafe' Americain - US Dollar Long Term Chart
GRAPHIC : The Austrian Insider - Can an Economy Grow Without Inflation?
Mises Economics - The Road to Poverty Is Paved with Small Inflations
VIDEO : CNBC - John LaForge of Ned Davis Research offers the Worst Forecast on Gold so Far this Year...$660.00
REWIND : CMI Gold & Silver - 15 Most Impenetrable Bank Vaults
Numismatic News - Silver Can Be more than an Investment
10/01/14 - Bullion News
CoinNews - US Mint Bullion Coin Sales Leap in September
TECHNICAL ANALYSIS : SOLARCYCLES - Last Quarter Of 2014
VIDEO : CNBC - Santelli Exchange: Consumer credit challenged
Market Realist - Why Commodities are Under Pressure as the Dollar Advances
Bullion Vault - Gold Prices Killed by Not-So "Super" Dollar
TECHNICAL ANALYSIS : Kimble Charting - Portfolio Construction Impacted By What Happens Here!
Investing - Platinum Falls On Weak Catalytic Converter Demand
CoinWeek - The Coin Analyst: Gold and Silver Prices Could Reverse Soon
AUDIO : FSN - Chris Vermeulen – One Last Flush-Out For Precious Metals?
Sovereign Man - This is huge: Chinese renminbi becomes directly tradable with the euro
Mish's Blog - Draghi Pressures ECB to Buy "Junk-Rated" Loan Bundles of Greece and Cyprus
Bloomberg - Austrian Mint’s Sales to Fall 47% on Lower Prices, Germany's Silver Tax
Other pages, on this Guide, that you
may like...
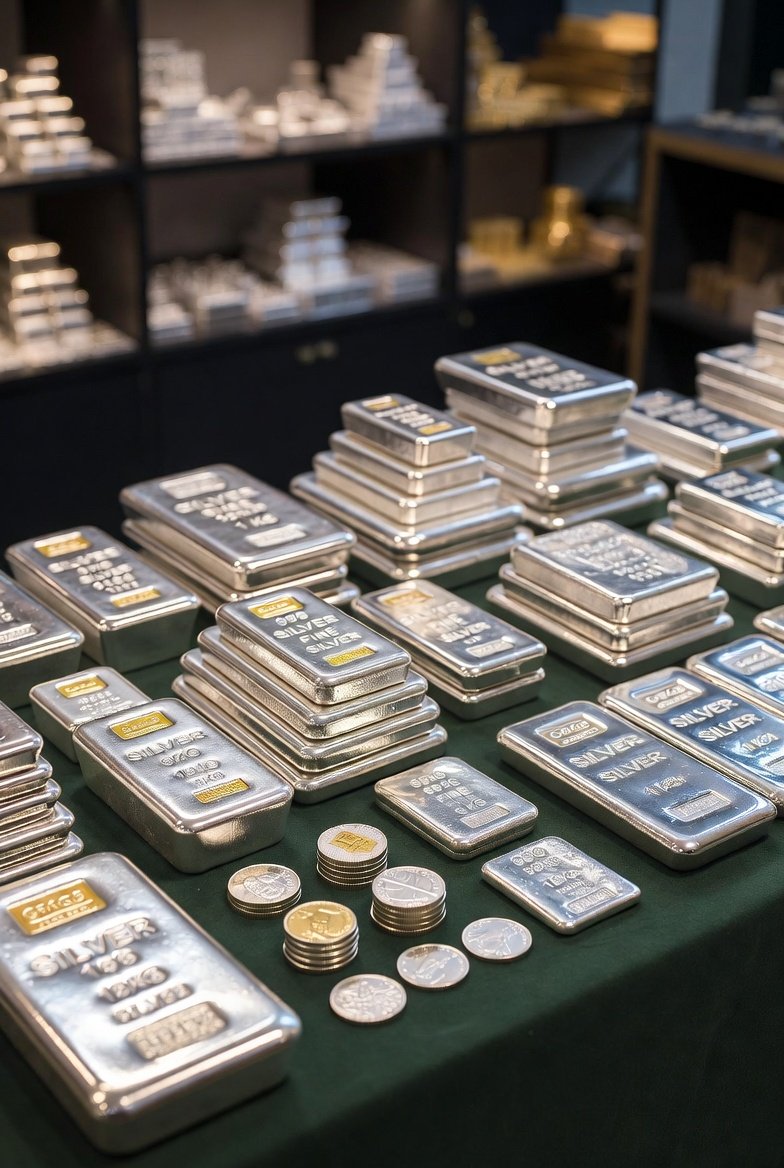
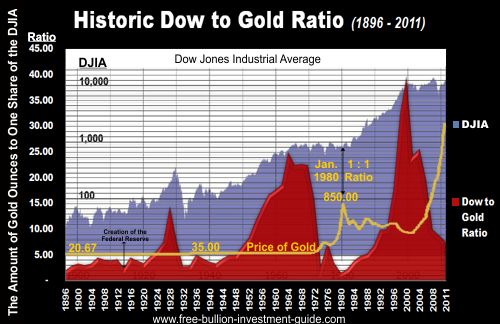



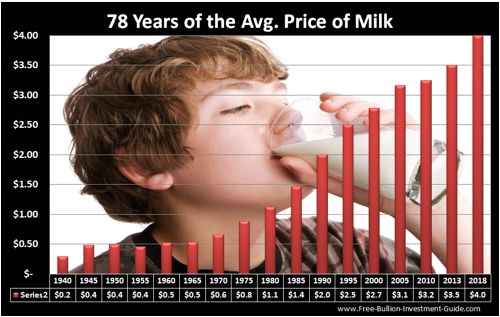














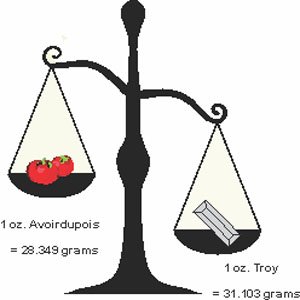



For Bullion Market News...
Notice:
The charts, commentary, and information on the Free-Bullion-Investment-Guide.com are in no way an endorsement of how you should invest or divest.
|
Support this Guide & Paypal Thank You for Your Support |
|
|
 | |||||


Recent Articles


-
Newsletter of the Free Bullion Investment Guide - October 2026
Oct 05, 26 04:57 PM
 The October 2026 newsletter of the Free Bullion Investment Guide provides the latest updates, fundamental and technical gold and silver market analysis, the best articles from last month, and a list o…
-
Newsletter of the Free Bullion Investment Guide - September 2026
Sep 05, 26 08:47 PM
 The September 2026 newsletter of the Free Bullion Investment Guide provides the latest updates, fundamental and technical gold and silver market analysis, the best articles from last month, and a list…
-
Newsletter of the Free Bullion Investment Guide - August 2026
Aug 05, 26 04:26 PM
 The August 2026 newsletter of the Free Bullion Investment Guide provides the latest updates, fundamental and technical gold and silver market analysis, the best articles from last month, and a list of…
-
Newsletter of the Free Bullion Investment Guide - July 2026
Jul 05, 26 08:41 PM
 The July 2026 newsletter of the Free Bullion Investment Guide provides the latest updates, fundamental and technical gold and silver market analysis, the best articles from last month, and a list of r…
-
Newsletter of the Free Bullion Investment Guide - June 2026
Jun 05, 26 03:06 PM
 The June 2026 newsletter of the Free Bullion Investment Guide provides the latest updates, fundamental and technical gold and silver market analysis, the best articles from last month, and a list of r…

18W LED Security Light (Dusk to Dawn & Motion Sensor) - $32.99
from:
 LED Lighting



This website is best viewed on a desktop computer.

Keep this Guide Online
& Paypal
Thank You for
Your Support

with Feedly
Search the Guide
| search engine by freefind | advanced |


1838 Victoria Gold Sovereign
First Sovereign issued during Victoria’s reign Wyon
The Royal Mint (U.K.)

Daily
Newsletter
2027 U.K. Gold Sovereign Updates
Gold and Silver American Eagle & Gold Buffalo Bullion Coin Mintage Updates
Updates for
Australian Lunar
Gold, Silver, and Platinum Bullion Coins


|
Platinum: |
2026 Silver Australian Koala
Photos & Mintage Update

Updated Mintages and 2026 Photos for
Australian Gold, Silver, and Platinum Kangaroos
Gold Australian Kangaroos:

Silver Australian Kangaroo:

Platinum Australian Kangaroo:

Mintages
for
2024 &
2025 - Recently Posted
Gold, Silver, & Platinum
Austrian Philharmonic Bullion Coins
|
Silver Austrian Philharmonics  |
Platinum Austrian Philharmonics
2026 Silver Australian Kookaburra
Photo & Mintage Update


Help Us Expand our Audience by forwarding our link
www.free-bullion-investment-guide.com.
Thank You!
Last Month's

In No Particular Order
October 2026
|
The 60/40 Portfolio Meets Its Match: Why Commodities Are Becoming the Third Pillar of Diversification - Goldman favours a more permanent role for commodities - The Dark Side of the Moon (substack) Precious Metal Royalty Companies on Track To Meet Full-Year Guidance - The Gold Report Info~Graphic: Ranked: The Top Currencies Used in Global Payments - Visual Capitalist Germany Debases Commemoratives - Soaring silver prices have prompted Germany to reduce the precious metal content of its commemorative coins, continuing a centuries-old practice of adjusting coinage to economic realities - Numismatic News The 2026 Gold Nations Report: Which Countries Hold the Most Gold and Why It Matters - The Gold Bullion Co. (.pdf) In Gold We Trust Report: Monthly Gold Compass October 2026 - Contents: Gold, Silver, Mining Stocks, Macro Analysis, and Proprietary Models - incrementum Royal Mint Marks Four Decades of Gold & Silver Britannia Bullion Coin Anniversaries - The Royal Mint (U.K.) eBay Extends Authenticity Guarantee to Coins - Numismatic News Info~Graphic: Seven Events That Shaped a Century of Gold Prices - IN TODAY'S MONEY, AN OUNCE IS WORTH ALMOST FIVE TIMES WHAT IT WAS IN 1934 - MINING VISUALS Weak September Jobs Report Just Stalled the Fed's Hiking Cycle, Not Started a Cutting One - Start Up Fortune Charts Report: In Gold We Trust Report 2026 Chartbook - incrementum Over The Past 55 Years, American's Standard Of Living Has Fallen Much More Than Most People Realize - In 1971, the median household income was $9,030, or 220 ounce of gold. In 2025, the median household income was $87,460, of just 25 ounces of gold- ZeroHedge Silver shortage could flip to surplus in 2027: Deutsche - MINING.COM (.pdf) Report: October 2026 - Monthly Gold Monitor - STATE STREET INVESTMENT MANAGEMENT US Mint Gold Coin Sales Plunge to Lowest Level Since 2000 - SILVERTRADE Info~Graphic: The World's 20 Largest Primary Silver Mines by 2025 Output - Mining Visuals Gold Hasn’t Forgotten the Rules. The Market Changed the Game - The Dark Side of the Boom (.pdf) Report: Gold Mining Company Peer Group Analysis: 2nd Quarter 2026 - Contents: Production & Cost Statistics, Producer Margins, Capital Expenditure, Cash Flow Analysis, Balance Sheet Analysis, Investor Returns, Market Ratios - Metals Focus U.K. Debt Will Be Repaid - But What Will the Money Be Worth? - Voima Gold Core Inflation Holds Steady in September, Energy Costs Push CPI Higher - mrcNewsBusters GOLD FRAUD: Precious Metals “Courier Fraud” Becoming More Common - A growing form of fraud is putting precious metals dealers and their customers on alert as scammers persuade victims to buy gold for nonexistent investigations - Numismatic News The Financial Times "We don’t understand the gold price" - FT - Alphaville Democratic Socialism Demolished Europe - Daniel Lacalle |
|
All Articles were Originally Posted on the Homepage Gold Nanoparticle Cancer ResearchSwiss Researchers Use Gold to Pinpoint the Location of Cancer Cells - Money Metals Exchange Sunlight Helps Vincristine Form Drug-Bearing Gold Nanoparticles in Five Minutes - AZONANO Gold nanoparticles under the laser: a review maps the road from clean synthesis to cancer theranostics - BioEngineer Gold nanoparticles show promise as dual cancer imaging and therapy tools - BioEngineer |
Click this link to Learn more about Gold Nanoparticle Cancer Research
All Articles were Originally Posted on the Homepage

BGASC - Customer Reviews

Click Ad to Request a Free Appraisal Kit
ExpressGoldCash
Customer Reviews 4.9 stars